Transcription
Unit 3: Data representationIntroduction to Unit 3In this unit you will look at different ways to represent data in tables, charts,graphs and diagrams. The emphasis is not on the techniques to produce theserepresentations, but on the question of whether or not the representation bestrepresents the data.Purpose of Unit 3The aim of this unit is to look at a variety of ways to represent data and tocompare these for the best representation of the data given. The unit willlook at : frequency tables, pictograms, bar charts, line bar charts, histograms,pie charts, line graphs, frequency polygons, stem-leaf plots, scatter plots.ObjectivesAt the end of this unit you should be able to: organise data describe data read and interpret displays of data construct appropriate displays of data: frequency table, pictogram, barchart, line bar chart, histogram, pie chart, line graph, frequency polygon,stem-leaf plots, scatter plots justify the choice of display used for given data critically analyse data displays state common pupil errors in data representation illustrate methods to misrepresent data use appropriate project work in the classroom to assist the pupils in theirlearning of data representationTimeTo study this unit will take you about 10 hours.Module 6: Unit 357Data representation
Unit 3: Data representationSection A: Represent or model dataWhat is the best way to represent the collected data? Is the data discrete orcontinuous, is the data qualitative or quantitative, how does one change fromone form of representation to another, what is the effect of changing scale?These are questions to be considered. Too frequently the emphasis is onoperational understanding, on the techniques of drawing a bar chart, a piechart, a cumulative frequency curve while questions as to why to use the(most of the time) stated representation in the given circumstances (are theyvalid? are they appropriate?) are hardly considered. It should be left to thepupils to decide what is the most appropriate way to represent their data (andthat is the difficult part—the actual drawing of chart is not the problem ingeneral, and could be done by a computer). One way to do this is bycomparing different forms of representing the data.Graphical displays should: show the data induce the viewer to think about substance rather than aboutmethodology represent large data sets in a relatively small space make large data sets coherent encourage pupils to make comparisons between different pieces of data reveal the data at several levels of detail serve a reasonably clear purpose be integrated with the statistical and verbal descriptions of the dataSection B: TablesData collected is generally first tabulated in frequency distribution tables.These tables might contain data that is grouped or ungrouped. Sometimestwo-way tables are used.These were covered in the previous Unit 2, section D1.Section C: Nature and format of dataThe type of representation that can be used depends ona) the nature of the data, i.e., discrete or continuous datab) the format in which the data is given ungrouped or groupedDiscrete dataDiscrete data can be displayed in bar charts (categorical data), bar-linegraphs (discrete quantitative data) or pie charts (categorical data / discretequantitative, provided the number of categories or discrete values is notlarge).Module 6: Unit 358Data representation
In a bar graph or bar-line graph the height of the bar or line is proportionalto the frequency.Bars are to be drawn separated equally, with same width. The discrete valueor category is placed at the centre of the bar. The frequencies, along thevertical axis, are placed against the lines (NOT the spaces). Bar-line graphsare very appropriate with discrete data (number of children in the family,shoe size of pupils, etc.), bar graphs (also called frequency diagrams) aremore appropriate for grouped discrete data or for categorical data.In a pie chart the angle at the centre of each sector is proportional to thefrequency. Therefore the radius of the pie chart is not relevant. The numberof sectors should, generally, not exceed 6 - 8 to make the presentationmeaningful and allow comparison between the various sectors.Continuous dataContinuous data is best displayed in histograms. In a histogram thefrequencies are proportional to the area of the bar. In cases where bars of thesame width are considered the histogram becomes a bar graph, but the barstouch each other. Details will be discussed below.N.B. It is rather common to display certain discrete data (for example, scoreson a test, number of children in a family, i.e., numerical data that can beordered) in a bar graph with the bars touching each other. This is strictlyspeaking not correct, but you should not try to make the distinction withstudents of this age.Independent vs. dependent variablesAn independent variable is presumed to have an effect on another variable.It is the variable that is manipulated or changed by the researcher toinvestigate the effect on a dependent variable. It is also known as themanipulated or experimental variable that we have discussed above. Theeffect of the manipulation is observed on the dependent variable. Theindependent variable is a variable that by itself does not necessarily give riseto the behaviour of interest except if manipulated.The dependent (or outcome) variable is that variable which occurrence orfrequency of occurrence depends on the conditions and the manipulation ofthe independent variable. It is called the dependent variable because its valuedepends on and varies with the value of the independent variable.The independent variable is commonly plotted along the horizontal axis andthe dependent variable along the vertical axis.Write down the different data representations (charts, graphs, diagrams) youremember.1. What type of data is most appropriately represented by each of therepresentations you listed above?2Module 6: Unit 3What type of data cannot be represented by each of the representationsyou listed?59Data representation
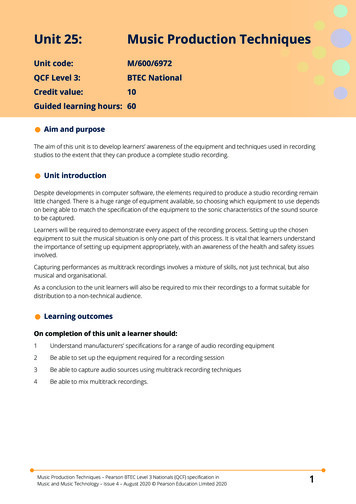
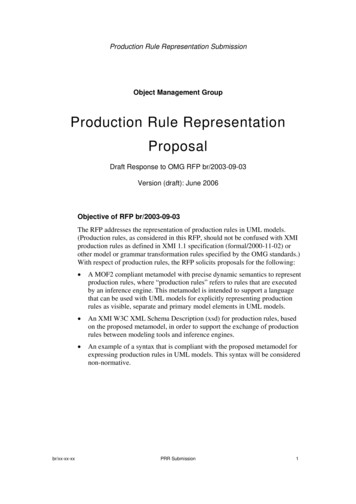
Section D: Graphical representationsData can be represented in various ways, and in the following sections youare going to look at the following representations of data. Bar charts (Section D1) Line/stick graphs (Section D2) Histograms (Section D3) Pie charts (Section D4) Pictograms (Section D5) Line graphs/charts (Section D6) Frequency polygons (Section D7) Stem-leaf diagrams (Section D8) Scatter diagram (Section D9)In each section special attention will be given to the type of data that can berepresented in that particular way.Section D1: Bar charts (bars horizontal or vertical)Most appropriate use: to compare categories (qualitative data, theindependent variable is non-numerical) and grouped discrete quantitativedata (scores on a test, amount spend by customers in a shop)How to draw: Rectangles with equal width are used. The height/lengthrepresents the frequency of the category. Do not draw the bar adjacent. Labelthe diagram as a whole (title), the bars and the frequency axis. Indicate scaleon the frequency axis.Examples of qualitative data displayModule 6: Unit 360Data representation
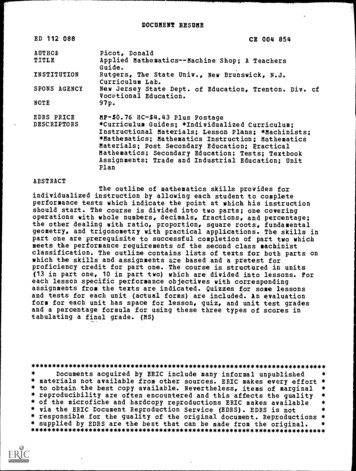
Examples of quantitative discrete (grouped) data display.Number of customers in a groupModule 6: Unit 361Data representation
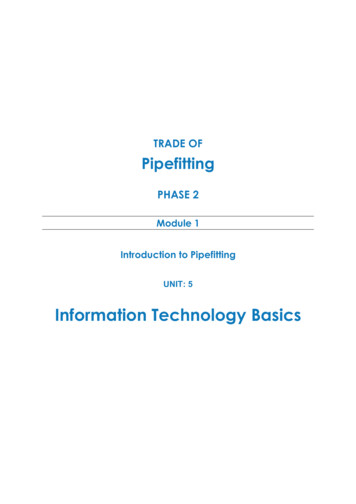
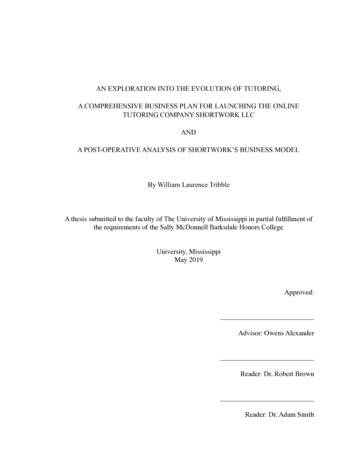
Section D2: Line/stick graphs(can be horizontally or vertically displayed)Most appropriate use: to compare discrete variablesHow to draw: lines/sticks of length proportional to the frequencies.Labellingas with the bar graph.Section D3: HistogramsMost appropriate use: to represent grouped continuous variables. Alwaysdepicts frequency (or count) versus a continuous or nearly continuousvariable.How to draw: Rectangles whose areas are proportional to the frequencies.The rectangles are adjacent (that is, the rectangles touch each other.) Theaxes are labelled, the graph has a title.Example: The height of 100 maize plants was measured, to the nearest cm,one month after planting.Height of maize plants1 - 20 cm21 - 40 cm41 - 60 cm61 - 70 cmModule 6: Unit 3Frequency122854662Frequency density0.61.42.70.6Data representation
N.B.(i) Different notations for the classes are in use, 1 - 20 standing forheights from 1 to 20 both inclusive in the above case. Also thenotation [1, 20] or 1 height 20 can be used.Some books use as the first class 0 - 20 to mean 0 height 20 andwrite the next class as 20 - 40 to imply 20 height 40, etc. Thenotation to be used is a matter of agreement.(ii) Attention is to be paid to the upper and lower boundaries. Thecontext dictates how they have to be taken.In the above example of measurements to the nearest cm, theboundaries are half way between two classes. The rectangles are tobe drawn—in the above example—from 0.5 (the lower boundary) to20.5 (the upper boundary), from 20.5 to 40.5 and the last one from60.5 to 70.5.In case the variable is age (a continuous variable) the situation isdifferent. Ages are given in completed years, not to the nearest year.A person of 20 years and 11 months and 25 days is still considered tobe 20. Consider the following example.The ages of applicants for a teaching post have the followingdistribution.AgeFrequency20 - 24425 - 29230 - 34235 - 442In the class 20 - 24 fall all applicants with age 20 age 25, in theclass 25 - 29 fall all applicants with ages 25 age 30, etc. The classboundaries are 20, 25, 30, 35, 45.Module 6: Unit 363Data representation
(iii) The frequency density is the frequency divided by the class width(upper boundary – lower boundary of the class). This is a fine point,probably one that you should not teach.(iv) In cases that classes have all the same width, the frequency densityand frequency are directly proportional and some authors will labelthe axis: “frequencies” in that case.(v) Discrete grouped data (test scores, amount of money spent in a shop)should be displayed in bar graphs. However it is rather commonpractice to display grouped discrete data as if continuous.Amount spent by pupilsin the tuckshop (thebe)1-100101 - 200201 - 300301- 400401- 500Frequency611742The data is best displayed on a bar chart.Module 6: Unit 364Data representation
However the data is also displayed in histograms - taking the data as if it iscontinuous. Class boundaries 0.5 /100.5/200.5, etc. are then correct, but forstudents of this age, whole-number boundaries on a histogram would be“close enough.”(vi) Grouping data is a means to summarise the raw data. Be aware thatby grouping some of the original information is lost.If, for example, in a test marked out of 10 the scores were:Mark012345678910Frequency33323343321Then by grouping:MarkFrequency0 -162-354-566-778 and more6some of the original information can no longer be found in the groupedfrequency table. This has implications for calculation of mean / median /mode. These measures obtained from the raw data will differ from(approximated) values obtained from the grouped frequency table. Changingthe class width will again lead to different approximations for the measuresof central tendency. Grouping results in what is referred to as “groupingerror.” The error is reduced by using small class intervals. If the classintervals are increased so does the ‘grouping error’ in the approximation forthe mean and median obtained from the grouped frequency table.Module 6: Unit 365Data representation
Self mark exercise 11. Represent the following data in a bar chart.The month in which form 1 pupils in a school were born are tabulated inthe frequency table below.Mon. Jan Feb Mar Apr May Jun Jul Aug Sep Oct Nov DecFreq. 333216183024185421692. Represent the following data in a bar chart.The amount (in thousands of litres) of petrol sold at a petrol stationduring a month wasType of petrolLeadedUnleadedDiesel453520Number of litres (x 1000)3. Represent the following data in a bar chart.The percent of pupils obtaining a certain grade in a test are listed:GradeABCDEFG% of pupils25362415944. Use the following raw data of the length (mm) of nails found in packetsof ‘assorted 520441345a) Make a grouped frequency table taking class intervals 10 -14,15 - 19, etc., and draw a histogram.b) Make a grouped frequency table taking class intervals 10 - 19,20 -29, etc., and draw the histogram.Compare the two representations of the data.Suggested answers are at the end of this unit.Module 6: Unit 366Data representation
Section D4: Pie chartsMost appropriate use: to represent data as part of a whole, to illustratedifferences in categories (qualitative or discrete variables) provided thenumber of categories is limited (generally between 2 and 8).How to draw: Measure of the angle at the centre of the circle is proportionalto the frequencyfrequency of the category(measure of the angle at the centre 360º)total of all frequenciesSection D5: PictogramsMost appropriate use: to illustrate broad differences between categories(qualitative and discrete variables).How to draw: Draw simple pictures (instead of bars) to represent thefrequency. A key is to be added to show what each picture represents.Module 6: Unit 367Data representation
Self mark exercise 21. Display the following data in a pie chart and pictogram.The total world wool production was distributed over various countriesas follows in 1994:CountryAustraliaUSSRNew ZealandArgentinaSAOthers% of wool world production produced30%30%20%10%10%10%2. Display the following data in a pie chart and pictogram.The type of vehicles coming to a petrol station during one day aretabulated belowPerson carsLorriesBussesCombis26128143. Display the following data in a pie chart and pictogram.The sizes of T-shirts sold during a month in a shop wereSizeSMLXLNumber sold123456184. Comparing the two representations, pie chart and pictogram, list someadvantages and disadvantages of each.Suggested answers are at the end of this unit.Module 6: Unit 368Data representation
Section D6: Line graphs/chartsMost appropriate use: to illustrate changes of continuous variables (overtime)How to draw: plot the given corresponding pairs of data as points and joinconsecutive points by line segments.ExampleIf trends—changes over time—are looked for, line graphs can be used.Line graphs are used for both discrete and continuous data. For example, inthe line graph is displayed the number of cars sold in a certain garage over1the first 8 months of a year. Although ‘in between’ values such as 2 , 3 1 ,24etc., do not exist the points are joined with straight lines to show the trend.For trend lines not all ‘in between’ values have to make sense. Trend linesshould not be confused with linear graphs. In linear graphs the ‘in between’values must exist, otherwise it would be inappropriate to draw the line.Module 6: Unit 369Data representation
Self mark exercise 31Represent the following data in a line graph and comment on the trend.Number of pupils in a primary school 1993 - 65478490510524a) Represent the following data in a line graph and comment on thetrend.Infant mortality rate per 1000 live birthsYear1971Infant mortality rate 100198119917145b) If the trend is continuous what do you expect the infant mortality rateto be in 2001?3The number of teacher trained for the Senior Secondary School inBotswana are tabulated:Year1996199719981999Number trained81105115184a) Represent this data in a line graph and comment on the trend.b) If the trend is continuous what number of Senior Secondary schoolteachers do you expect to be trained in the year 2000?Suggested answers are at the end of this unit.Module 6: Unit 370Data representation
Section D7: Frequency polygonsMost appropriate use: to compare grouped continuous variables, forexample, distribution of the height of girls (in grouped form) and distributionof the height of boys (in grouped form). Drawing the frequency polygons onthe same axes allows easy comparison. This is far superior to drawing twohistograms on one grid!How to draw: Plotting the points with co-ordinates (mid-interval value,frequency) and connecting these with straight line segments. Adding pointson the horizontal axis at both sides.Example: The following grouped frequency table summarises the net contentof 50 packets of a supermarket’s brand of potato crisps labelled 25 grams.Net mass ( g)Mid-pointFrequency23.5 24.524.0224.5 25.525.0925.5 26.526.02526.5 27.527.0927.5 28.528.0428.5 29.529.01TOTAL50A frequency polygon is drawn by plotting the frequency for each intervalagainst the mid-point of the interval and joining the points with straight linesegments. The points (24.0, 2), (25.0, 9), . (29.0, 1) are plotted and joined.The polygon is continued to the axis so the points (23.0, 0) and (30.0, 0) areincluded.Module 6: Unit 371Data representation
Self mark exercise 41. A factory producing hats measured the circumference of the heads of 100people in centimetres to the nearest centimetre. The following resultswere obtained.Head circumference c (cm)Frequency50 c 52852 c 541254 c 563056 c 584458 c 606a) Represent the data in a frequency polygon.b) If you are to give advice to the factory manager as to the size of hatsto be produced what advice would you give? Explain.2. a) Represent the following data in a frequency polygon. The data givesthe mass of apples from one tree.Mass of apple (g) 20 –30 30-40Frequency61840-503450-603060-7012b) Using the same scale and axes, represent the following data givingthe mass of the same type apples from another tree in the orchard.Mass of apple (g)Frequency20 –30 30-4031440-502650-603660-7021c) Comparing the two polygons what conclusion(s) can you make?Explain.Suggested answers are at the end of this unit.Section D8: Stem-leaf diagramsMost appropriate use: To represent ungrouped quantitative data. Also tocompare two sets of ungrouped quantitative data (male and female data onthe same variable for example). Stem-leaf diagrams are the only graphicalrepresentations that also display all the original data values.How to draw: Part of the number, often the whole number part, is used as thestem (placed vertically under each other), the other part of the number formsthe leaves. Place an explanatory legend beneath the diagram and a title aboveit.Example:Potato crisps come in packets marked 25 grams. The mass of 25 packets wasfound to the nearest 0.1 .8Module 6: Unit 372Data representation
Data can be organised in stem-leaf diagram. The whole number part of themass can be used to form the stem shown at the left of the vertical line andthe decimal part of the masses forms the leaves on the right. The leaves oneach level or row in the diagram increase in value outwards from the stem.Contents of packets of crisps (g)242526271570123355678002344893578n 2524 1 represents 24.1 gramThe ‘scale’ is very important as 24 1 could mean 241, 24.1, 2.41, 0.241,etc., depending on the quantities displayed. The diagram has a title and thesample size n 25 is noted.The stem-leaf diagram can be stretched by choosing the stem to representmore levels.For example24.0 to 24.424.5 to 24.925.0 to 25.4etc.Contents of packets of crisps (g)24242525262627271570123355678002344893578n 2524 1 represents 24.1 gramThe stem-leaf diagram can also be made ‘double’ allowing comparison.For example, the following stem-leaf diagram gives the height of pupils in aclass. The girls are on the left, the boys on the right.Height of pupils in Form 2XGirls44331098654322086542n 41Module 6: Unit 3151516161717Boys25791223455668890445816 8 represents 168 cm73Data representation
The diagram makes visual that on the whole the girls are shorter than theboys. Or does it?Self mark exercise 51. A sample of eggs from an one day’s production has mass in 485852Draw a stem-leaf diagram using stems 4, 4, 5, 5, 6, 6, 72. Represent the following data in (a) a grouped frequency table (b) ahistogram.Contents of packets of crisps (g)2424252526262727n 7827 0 represents 27.0 gramSuggested answers are at the end of this unit.Module 6: Unit 374Data representation
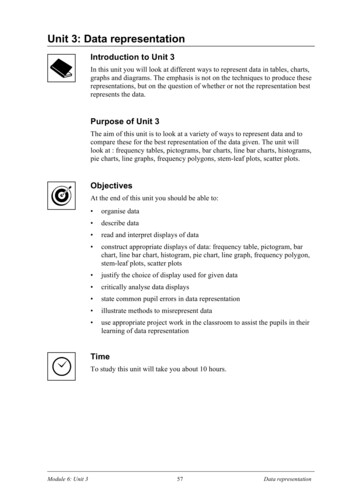
Section D9: Scatter diagramsMost appropriate use: When looking at statistical data it is often observedthat there are connections between sets of data. For example the mass andheight of persons are related: the taller the person the greater his/her mass.To find out whether or not two sets of data are connected scatter diagramscan be used.How to draw: In a scatter diagram each plotted point represent a pair, forexample a (mass, height) pair of one person.ExampleThe scatter graph illustrates that generally taller boys have greater mass.Module 6: Unit 375Data representation
The relationship in a scatter diagram between the two sets of variables isdescribed with the word correlation.Positive correlation between two variables x and y can be described in wordsas: if x increases then y will also increase or if x decreases then y willdecrease (x and y are directly proportional). Negative correlation betweentwo variables x and y can be expressed in words as: if x increases y willdecrease or if x decreases then y will increase (x and y are inverselyproportional).Strong positive or negative correlation between two sets of data does notprove that the two variables are causal related. For example, the length of aspring and the mass attached to it are likely strongly positively correlatedand a greater mass attached causes the spring to extend more. If in a scatterdiagram a positive correlation was found between the scores in mathematicsof the pupils in a class and the distance they stay from the school (thosestaying close to school score low, those staying far from school score high)then it is very unlikely that there is any causal relationship (if a pupil movesto a place far from school his/her marks in mathematics are unlikely toincrease!). This type of non causal correlation is called spuriousModule 6: Unit 376Data representation
correlation, and is surprisingly common.Estimating values:If two sets of data show correlation you can use your scatter graph toestimate missing values. You draw the ‘best fitting’ line through the pointwith co-ordinates (mean value of x, mean value of y).Example:Two judges awarded marks in a science fair for projects. Judge A scored outof 20 and judge B scored out of 15.Judge A1512819761781516Judge B129713831251214Plotting these data in a scatter graph gives the following graph.The line of best fit is drawn through the point (12.3, 9.5) as the mean scoreof judge A is 12.3 and the mean score of judge B is 9.5 and such that aboutthe same number of points is at each side of the line.Judge A scored a project 14 marks but the project was not seen by judge B.You can now use the line of best fit to obtain an estimate for the score ofjudge B. You find 14 on the Judge A axis. Follow the arrows in the diagramto find the estimate for the mark judge B most likely should have given: 10.4(or rounded to 10 as only whole marks were awarded).Module 6: Unit 377Data representation
Self mark exercise 61. Do you expect positive (strong or weak), negative (strong or weak) or nocorrelation between the following variables? Justify your answer.a) Number of days absent from school and the mark in the examinationb) Number of boys and number of girls in a familyc) Level of education and incomed) Income and time spent in barse) Age and number of pages read in one hourf) Number of rooms in a house and the number of doorsg) Arm length and length of javelin throwh) Circumference of head and intelligencei) Length of spring and mass attached to its endj) Amount of pocket money and number of friendsk) Age of a car and its second-hand selling pricel) The shoe sizes of pupils and the distance they travel to schoolm) Depth of tread on a car tyre and the distance travelled2. During the term 10 pupils obtained the following scores in mathematicsand science (out of 283429a) Draw a scatter graph to represent the data.b) Are pupils’ score in mathematics and science correlated?c) Find the mean of the maths scores and the science scores to draw theline of best fit.d) A pupil scored 35 in mathematics. Work out an estimate for thepupil’s score in science.e) Another pupil scored 40 in science. Work out an estimate for thepupil’s score in mathematics.Module 6: Unit 378Data representation
3. A supermarket asked randomly some of their customers how many timesthey come to the supermarket in a three month period and how far awaythey live from the supermarket.The results are tabulated below:Number of visitsDistance from supermarket (km)91078126117144125612811153134513108415911216a) Plot a scatter graph to represent this data.b) Describe the correlation of the data.c) Find the mean number of visits and the mean distance. Use these todraw a line of best fit.d) Estimate the number of visits made by a customer living 10 km fromthe supermarket.e) How reliable do you think the estimate in (d) is?Suggested answers are at the end of this unit.Section E: Representing data for understandingRepresenting data in diagrams is to enhance the understanding of the data.The question to be asked in each situation is: What kind of representation(s)would help you to make sense of the given data? Too frequently questionsare set that prescribe to transform data (frequency table data for example)into a given format (bar chart for example). However it is important thatpupils learn to decide what might be the most appropriate format to presenttheir data. Different formats should be considered and within a given format(bar chart for example) the effect of re-scaling or changing class width.Transforming from one format to another is also a skill to be developed.Module 6: Unit 379Data representation
Practice task 11. Find some realistic raw data (3 different sets) and represent the datausing several of the above-mentioned forms of representation. Discussand justify which of the representations is the most appropriate torepresent your raw data.2. The table below gives different forms of representing data and the skillrequired to transform from one format to the other.To VerbalTableFromVerbalreformulating, analysing,expressing in extractingown amFormulamodellinganalyticalmodellingreorganising, plottingregroupingfittingGraph/Chart/ interpretationLeaf-Stem/Pictogramreading offRe-scaling,using differentclass subjectexplainingIllustrate each transformation with an appropriate example.3. Class based activitySplit your class into two groups A and B. Present to each group the samedata sheet.Group A is to use the data to make the country look as good as possiblewhen compared with the other countries.Group B using the same data is to present the data such that it shows thatthe country has much to do to catch-up with the other countries.Groups are to be encouraged to use any diagram: bar charts, pie-charts,pictograms, histograms, frequency polygons, scatter graphs, stem-leafplots.The data sheet is on the following page.Write an evaluative report on the activity.Module 6: Unit 380Data representation
Data tion density(#/km2)22295220Annual pop. growth2.9%3.1%2.8%2.7%3.3%Children per woman5.26.05.56.56.5Under 5 tors1/50001/46001/70001/10 0001/38000Safe water availableto x% of population54%72%66%60%24%Access to healthservices80%52%82%50%22%Literacy, male84%72%74%81%45%Literacy, female65%48%60%65%21%Secondary tants)30/10 00028/10 00043/10 00019/10 000-TV sets per 1000inh.162126263Radios per 1000 inh.122127848147Inflation rate13%12%14%48%38%Food importdependency75%31%5%7%22%Economic growth6.1%-1.0%-0.9%-2.9%-3.6%Pop - populationInh - inhabitantsModule 6: Unit 381Data representation
Representing data for understanding (continued)An activity for use in the classroomUse of visual representations of written text is frequently very helpful tounderstand the text. The ‘standard’ representations as used in statistics arenot the only way data or text can be represented.Practice task 21. Below are descriptions of five situations. Present these to pupils workingin groups and ask them to come up with at least two diagrams to clarifythe situation described. Each group could be given one or two situationsto represent in diagrams, pictures, charts, etc.2. After the groups have worked on the activity they are to present theirwork to the class for discussion. Some of the questions to be asked couldbe: What is the strength of the suggested representation? What is theweakness? How could it be improved? Are there other alternatives?The instruction given to pupils in each of the situations is:What kind of representation(s) would help you to make sense of each ofthe following passages (situation 1 – 5)?3. a) Write an evaluative report on the activity. Questions to consider are:Did pupils meet difficulties? Were pupils well motivated to work onthe activity? Were the objectives achieved? Did you meet somespecific difficulties in preparing the lesson or during the lesson?b) Present the report to your supervisor.Situation 1: KidnappedOne of the most influential educationalists in Botswana, Cees, waskidnapped from outside his Gaborone home this morning by masked armedmen. Although he was seized in broad daylight on one of the main streetsleading to the station fly over, only two eye witnesses have been found bythe police and they have been of little help.Mr. Cees left his home in DO I
two-way tables are used. These were covered in the previous Unit 2, section D1. Section C: Nature and format of data The type of representation that can be used depends on a) the nature of the data, i.e., discrete or continuous data b) the format in w