Transcription
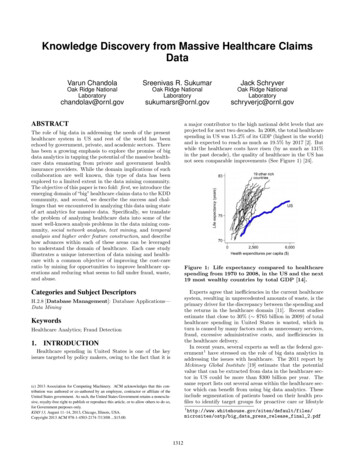
Epicor Data Discovery (EDD)ProductVisualizing Real-Time Operational DataX Epicor ERPEpicor Data Discovery (EDD) is a data visualization tool for Epicor ERP. With EDD,staff can use their natural visual abilities to quickly spot areas of interest in real-timeproduction data that they might have otherwise missed by just looking at rows andcolumns of numbers. BenefitsX Become a data-driven company ableto quickly make informed decisionsX Display live, role-based, key metricsto workers automatically when theylog inIn the Data Discovery view, users can set filters and drag and drop measures anddimensions to produce rich visualizations—a process like manipulating a pivot tablein a spreadsheet. They can then focus on a data point or area and drill down intothe underlying ERP transactional detail.X Visualize, anticipate, and preempt equipment and productiondegradation with Epicor IoTX Save time by visually spottinganomalies and automatically drillingdown into transactional detail in EDDDriven by real-time Business Activity Queries (BAQs) in Epicor ERP and other datasources, EDD complements Epicor Data Analytics (EDA)—EDD visualizes short-term,up-to-the-second enterprise data out of the box. Meanwhile, EDA allows for longerterm data exploration with full, pre-built content packs running in a cloud-baseddata warehouse.or Epicor ERPX Enable employees to accessand tailor visualizations in aself-service capacityDrag and dropmeasures anddimensions in theData Discovery Viewto gain new insights.Key FeaturesX Built for mobileX EDD included with Epicor ERPX Real-time Epicor ERP operational dataX Visualizes Epicor IoT data fromMicrosoft Azure IoT HubX Side-by-side display of EDD viewswith forms and trackers in Epicor ERPX Open Epicor ERP trackers and formsComparePercent of totalCorrelatefrom EDD selected dataX Connects to canned and customEpicor ERP Business Activity Queries(BAQs)X EDD Advanced connects to edbarPieBubbleanddotplotPivottableTrendlineEDD actionbuttonsinstantaneouslyswitch views ofyour databuilt in Microsoft SQL Server Analysis ServicesX Tied to Epicor ERP login—EDDAdvanced has additional option ofMicrosoft Single Sign-On for ActiveDirectory and Azure Active DirectoryBuilt in the new Epicor Kinetic Design System for a clean, modern, intuitive, andstreamlined user experience, EDD is accessible via SmartClient, web browsers,tablets, and modern smartphones. The application is designed to work just as wellon low-powered touch devices as it does on a powerful desktop with large screenreal estate. EDD automatically adjusts its layout and behavior to the browser anddevice accessing it.Resizable data cards can be animated when you mouse click on them, to cyclethrough multiple values like a stock ticker to provide a live feed of production data.Data views can be combined into a BI Dashboard with shared dimensions and crossfilters and added to Epicor ERP Active Home Page.
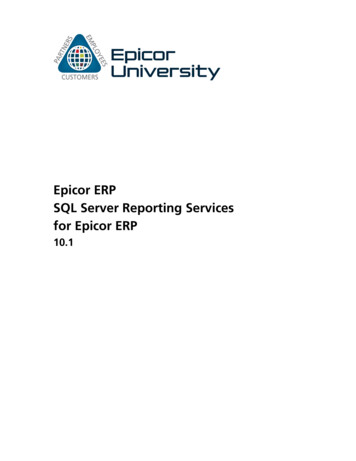
Epicor Data DiscoveryEDD ContentA full assortment of 30 metricsacross five role types are includedwith EDD. These provide greatstarting points for users to explorein the Data Discovery View orcreate new metrics.Executive roleXXXXXXAverage order total todayGross profit todaySales todayCOGS vs. profitOrders todayOrder historyFinance roleXXXXAR balanceAP balanceSales YTD vs. LYTDCustomers past due on paymentsa.k.a outstanding receivablesX Not invoiced shipments—numberand amountX Aged payablesX Aged receivablesIndicators with thresholds set up for IoT widgets make it easy to spot the alerts.Manufacturing roleX Clean vs. occurrence jobsX Manufacturing hours and indirect/downtime hoursX Job count by statusX Job cost element breakdownX Indirect hours by reasonProject management roleX Budget vs. actualX Completion percentX Profit marginsSupply chain roleEpicor IoT WidgetsX Quote win/loss analysisX Quotes—count and amountX Orders entered quantity andamount (sales) RMAs quantityand amountX Obsolete inventoryX Purchase price varianceX Open PO count and amountX Negative inventory items/outof stockX Orders past due quantityand amountX Orders backlogged quantityand amountX Orders shipped quantity andamount by defined criteriaX On-time/overdue shipments—counts and percentage vs.total shippedEpicor IoT is an Epicor ERP module thatintegrates with the Microsoft AzureIoT Hub. This application monitors andvisualizes data from sensors and otherEpicor products. Epicor IoT leveragesMicrosoft Azure IoT Hub to gatherEpicor ERP’s context and in-depthproduction data. Users gain intelligentinsights into the production and dayto-day enterprise activities—achievingdeep levels of operational efficiency.The Epicor IoT Data Discovery widgetalerts decision makers in real time towhat needs attention on the shopfloor and improves productivity asa result. Each machine or devicesensor can be set up with a KeyPerformance Indicator (KPI) settingsuch as allowable temperature ranges.EDD Card Views andDashboards in ActiveHome PageActive Home Page for Epicor ERPis an optional starting point for auser logging in and is where mostusers will first encounter EDD. A keycomponent of the Epicor Kinetic DesignSystem, Active Home Page containsquick access tiles for regularly usedforms, links to other applications,and resizable EDD card views. Fourconfigurable home pages are providedfor these role types—executive,financial, manufacturing, and supplychain—and are populated with theappropriate favorites, EDD card views,IoT widgets, and other widgets thatcan be easily rearranged and resized onthe page. Additionally, the “DiscoveryDashboard” widget adds an EDD BIDashboard as a tab in Active HomePage. You can also create custom EDDviews and BAQ grids from systemBAQs or your own BAQs and add themto your Active Home Page. The easyaccessibility of EDD from Active HomePage will promote data-driven decisionsin your business.
Epicor Data DiscoveryTypical Usage Stories“I want to see the ratio of jobs with scrap/rework/nonconformance reported versusjobs with no scrap/rework/nonconformancereported. I want to be able to see this bypart number for a user-defined date range.If the user does not choose a part, then alljobs in the time frame should be included.”—Production ManagerAnswer: EDD percentage ofjobs without scrap ornonconformance metricCustom EDD views and BAQ grids can be added to Active Home Page.“I need to be able to quickly review—ina KPI—the total count and amount ofall overdue AR invoices. I will need to beable to drill into the KPI and see all of thecustomers that have invoices past due andwhat the total amount overdue is for eachof the customers. I should be able to drillfurther and see which invoices make up thetotal amount overdue for each customerand—for each invoice—review how manydays overdue it is.”—Collections ManagerAnswer: EDD outstandingreceivables metricDiscovery Dashboard widget added as a tab in Active Home Page.“I need to be able to see the number ofquotes won versus the number of quoteslost within a rolling six-month time period.I also need to see the velocity of the winsand losses, as well as a Pareto analysisof wins and losses. I also need to seethe value of these quotes based on theexpected value.”—Sales ManagerAnswer: EDD quote win/lossanalysis metricEDD AdvancedEDD connects to Epicor ERP BAQs and External BAQs. EDD Advancedallows customers to connect EDD to outside data sources—most notably tomultidimensional cubes they have created in Microsoft SQL Server AnalysisServices. This allows the EDD BI Dashboard to be populated with both EpicorERP and external data sources with shared dimensions and cross filters. EDDAdvanced also allows log-ins to EDD to be set up outside of the ERP system viaAzure Active Directory or local Active Directory with data-level security set byrole. Epicor ERP users can still log in to EDD via Epicor ERP login.
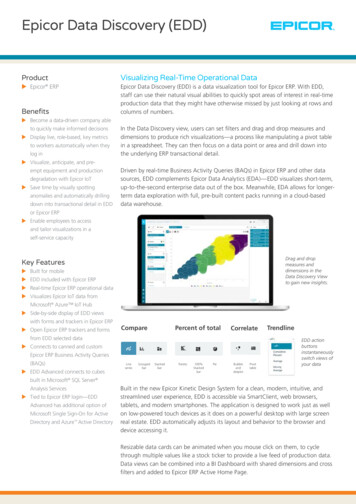
Epicor Data DiscoveryImage OverlayWe all love maps. They provide orientation. Theygive us a context for the data we are using, theyrelate most closely to our real-life experience, andthey are beautiful to look at. Now an image can actas a background in an EDD Avanced visualization,with data points placed in context on the image.Imagine being able to see a map of your country orthe world, with data points displaying information indifferent provinces or states, or a map of your plantfloor as shown. Or an image of a machine, with datapoints related to sensor placement on the machine.Data points on these maps can simultaneouslydisplay data in two categories (dimensions) via sizeand color, and your users can drill down for moreinformation. This map-based enhancement is sureto engage your users more than any other charttype and promote their use of real-time analytics forincreased reactive productivity.Key Performance Indicators (KPIs)Visually rich, color-coded and intuitive KPI tiles anddashboards can be created in minutes with this newenhancement in EDD Avanced. This expands the KPIfeature—first introduced with Epicor IoT widgets inEpicor ERP version release 10.2.400—to your otherreal-time data. The stoplight approach’s greateststrength is its intuitive logic. Your organizationsets the goals or operating parameters and thenmanagers can see problems (or achievements!) ata glance and drill down into what requires theirimmediate attention, in real-time.RequirementsX EDD is included in the Core packages of Epicor ERPVersions 10.2.100 and higherX EDD Advanced is an additional license or SaaSsubscription available for Epicor ERP Versions10.2.300 and higherX Discovery Dashboard widgets and IoT widgetsare available in Epicor ERP Versions 10.2.400 andhigherX To view EDD IoT content, a license or SaaSsubscription for Epicor IoT is requiredX EDD Advanced Image Overlay and KPI’s requireEpicor ERP Versions 10.2.600 and higher
Epicor Data DiscoveryLearn MoreDiscover how Epicor Data Discovery can deliver fresh insight into your business toempower decision makers throughout your organization.Contact your Epicor sales representative, call 1-800-999-6995, or visit www.epicor.com.About EpicorEpicor Software Corporation drives business growth. We provide flexible, industry-specific software designed to fit the preciseneeds of our manufacturing, distribution, retail, and service industry customers. More than 45 years of experience with ourcustomers’ unique business processes and operational requirements are built into every solution—in the cloud or on premises.With this deep understanding of your industry, Epicor solutions dramatically improve performance and profitability while easingcomplexity so you can focus on growth. For more information, connect with Epicor or visit www.epicor.com.Contact us todayinfo@epicor.comwww.epicor.comThe contents of this document are for informational purposes only and are subject to change without notice. Epicor Software Corporation makes no guarantee, representations, or warranties with regard to theenclosed information and specifically disclaims, to the full extent of the law, any applicable implied warranties, such as fitness for a particular purpose, merchantability, satisfactory quality, or reasonable skill andcare. This document and its contents, including the viewpoints, testimonials, dates, and functional content expressed herein are believed to be accurate as of its date of publication, May 18, 2020. Use of Epicorproducts and services are subject to a master customer or similar agreement. Usage of the solution(s) described in this document with other Epicor software or third party products may require the purchase oflicenses for such other products. Epicor and the Epicor logo are trademarks or registered trademarks of Epicor Software Corporation in the United States, and in certain other countries and/or the EU. Microsoftand Microsoft Azure are either registered trademarks or trademarks of Microsoft Corporation in the United States and/or or other countries. Copyright 2020 Epicor Software Corporation. All rights reserved.
Epicor Data Discovery Image Overlay We all love maps. They provide orientation. They give us a context for the data we are using, they relate most closely to our real-life experience, and