Transcription
Band gap engineering of a soft inorganic compound PbI2 by incommensurate van derWaals epitaxyYiping Wang, Yi-Yang Sun, Shengbai Zhang, Toh-Ming Lu, and Jian ShiCitation: Applied Physics Letters 108, 013105 (2016); doi: 10.1063/1.4939269View online: http://dx.doi.org/10.1063/1.4939269View Table of Contents: 08/1?ver pdfcovPublished by the AIP PublishingArticles you may be interested inLayer specific optical band gap measurement at nanoscale in MoS2 and ReS2 van der Waals compounds byhigh resolution electron energy loss spectroscopyJ. Appl. Phys. 119, 114309 (2016); 10.1063/1.4944431Engineering 180 ferroelectric domains in epitaxial PbTiO3 thin films by varying the thickness of the underlying(La,Sr)MnO3 layerAppl. Phys. Lett. 105, 132903 (2014); 10.1063/1.4897144Heterostructures based on inorganic and organic van der Waals systemsAPL Mater. 2, 092511 (2014); 10.1063/1.4894435Thermally-induced first-order phase transition in the (FC6H4C2H4NH3)2[PbI4] photoluminescent organicinorganic materialJ. Appl. Phys. 111, 053521 (2012); 10.1063/1.3690920Effects of stress on the optical properties of epitaxial Nd-doped Sr0.5Ba0.5Nb2O6 filmsAIP Advances 1, 032172 (2011); 10.1063/1.3647516Reuse of AIP Publishing content is subject to the terms at: issions. Download to IP: 128.113.37.4 On: Sat, 30 Jul 201618:17:54
APPLIED PHYSICS LETTERS 108, 013105 (2016)Band gap engineering of a soft inorganic compound PbI2by incommensurate van der Waals epitaxyYiping Wang,1 Yi-Yang Sun,2 Shengbai Zhang,2 Toh-Ming Lu,2 and Jian Shi1,a)1Department of Materials Science and Engineering, Rensselaer Polytechnic Institute, Troy,New York 12180, USA2Department of Physics, Applied Physics, and Astronomy, Rensselaer Polytechnic Institute,Troy, New York 12180, USA(Received 24 October 2015; accepted 18 December 2015; published online 5 January 2016)Van der Waals epitaxial growth had been thought to have trivial contribution on inducingsubstantial epitaxial strain in thin films due to its weak nature of van der Waals interfacial energy.Due to this, electrical and optical structure engineering via van der Waals epitaxial strain has beenrarely studied. In this report, we show that significant band structure engineering could be achievedin a soft thin film material PbI2 via van der Waals epitaxy. The thickness dependentphotoluminescence of single crystal PbI2 flakes was studied and attributed to the substrate-film coupling effect via incommensurate van der Waals epitaxy. It is proposed that the van der Waals strainis resulted from the soft nature of PbI2 and large van der Waals interaction due to the involvementof heavy elements. Such strain plays vital roles in modifying the band gap of PbI2. The deformationpotential theory is used to quantitatively unveil the correlation between thickness, strain, and bandgap change. Our hypothesis is confirmed by the subsequent mechanical bending test and RamanC 2016 AIP Publishing LLC. ion. VThe upsurge in the popularity of two-dimensional (2D)materials with the emergence of graphene1 in recent yearshas at the same time rejuvenated van der Waals (VDW) epitaxy, a materials growth technique invented almost 30 yearsago,2 which could yield layered materials with great crystallinity. The relatively weak VDW interaction between thefilm and substrate enables a broader choice of film candidates3 and easier film transfer process,4 making itself a goodcomplement to the conventional chemical epitaxy. However,such weak interaction also limits the further exploration ofits substrate-film coupling effect, whereas in the case ofchemical epitaxy accomplished by various techniquesincluding hot wall vacuum methods,5,6 the strain resultingfrom the registration of the film to the substrate could bringabout controllable modification in the film properties including the change of band gap,7,8 the adjustment of electronicband structure,9,10 the enhancement of the electron/holemobility,11 the modification of catalytic activity and ionicconductivity,12 thermodynamic ferroelectric/ferromagneticphase change,13,14 insulator-metal transition in stronglycorrelated oxides,15 and even superconducting phase transition.16,17 For most of the 2D materials, such as graphene,h-BN, and transition metal dichalcogenides currentlyinvolved in the VDW epitaxy, the film itself usually has anincreasingly high Young’s modulus18–20 that leaves theVDW interaction at the interface a negligible effect onstraining the film and modifying its electrical and opticalproperties. However, given a material soft enough, will a signification strain engineering be possible via VDW interfacialinteraction? Lead iodide (PbI2), among other 2D materials, isextremely soft (E ¼ 17 GPa),21 more than two orders lowera)Author to whom correspondence should be addressed. Electronic mail:shij4@rpi.edu0003-6951/2016/108(1)/013105/5/ 30.00than that of graphene (E ¼ 2000 GPa).18 Meanwhile, heavyatoms like Pb and I render an enhanced VDW interaction.Both make it an ideal candidate to study VDW epitaxy onstrain engineering. Finally, PbI2 itself has potential application prospects as radiation detectors22 and lasers.23 A possible manipulation of its optical property via the VDW epitaxycould be especially beneficial. Understanding the role ofVDW interaction on soft inorganic materials would help toshed light on manipulating the electrical, magnetic, and optical properties of 2D materials in future.Here, in this letter, we report the observation of theVDW epitaxy induced remarkable photoluminescence (PL)change in PbI2 flakes grown on muscovite mica substrates.The as-grown flakes exhibit a blue shift of PL peak withdecreasing thickness and increasing substrate-film couplingeffect. The tunable PL is in good agreement with the proposed model on strain-induced band gap shifting. Furtherbending test and Raman spectroscopy characterization areconducted as sound evidence to our hypothesis. Our discovery shows that a weak VDW epitaxial interface could havesubstantial impacts on the optical properties of the thin filmmaterial which is soft enough.The PbI2 flakes were synthesized via Chemical VaporDeposition (CVD) method through a single source evaporation process. Detailed growth conditions and characterizationsetups could be found from the supplementary material.24Figure 1(a) shows the morphology of the PbI2 flakes aftergrowth. They present themselves as well aligned triangles ortruncated triangles with the size of a tens of microns andsharp edges, indicating good crystallinity. The two insets ofFigure 1(a) marked by red rectangles show two other regionswhere the crystals are also aligned to one direction markedby the dashed arrows. While the different shape of the crystal, as investigated by our previous study,25 is a sign of108, 013105-1C 2016 AIP Publishing LLCVReuse of AIP Publishing content is subject to the terms at: issions. Download to IP: 128.113.37.4 On: Sat, 30 Jul 201618:17:54
013105-2Wang et al.Appl. Phys. Lett. 108, 013105 (2016)FIG. 1. Morphology and structural characterization of as-grown PbI2 flakes. (a) PbI2 orientation on the muscovite mica (001) substrate. The dashed arrowsindicate the parallel alignment of the crystals and hence the VDW epitaxy. The red rectangles are two other regions that have a similar line up; (b)-(f) individual PbI2 flake with different thicknesses from 90 to 400 nm as marked in the images; (g) AFM image of the 180-nm-thick flake as shown in (e); (h) AFM imageof the pile-ups of the flakes with an overall thickness of 1 lm, resembling wedding-cake growth; (i) diffraction pattern of mica substrate with [001] as zoneaxis; (j) low magnification TEM image of one PbI2 flake; (k) diffraction pattern of PbI2 with [0001] as zone axis [scale bar: (a) main figure and middle inset:20 lm, bottom inset: 50 lm; (b)-(f) 20 lm; (g) and (h) 10 lm].kinetics-driven growth instability; the uniform orientationsuggests the existence of VDW epitaxy. The thickness of theflakes, which is more of interest in current study, is revealedby the different colors as shown in Figures 1(b)–1(f) wherethe color changes from light yellow (b) to blue ((c) and (d))and red (e), and finally almost transparent (f) and so does thethicknesses from 90 nm to 400 nm as marked in the images.The thickness is confirmed by subsequent AFM characterization where the AFM image of the180 nm-thick flake wasshown in Figure 1(g). We may notice some layered feature ispresent at the edge of the flake, which is consistent with theoptical image of Figure 1(e) and the nature of PbI2 crystal.As the thickness continues to increase, the crystal adopts awedding-cake growth model17 where different flakes pile upwithout the presence of screw dislocations, as shown in theAFM image in Figure 1(h) where the overall thicknessreaches 1 lm. The structural information is further revealedby TEM diffraction patterns. Figure 1(i) shows the diffraction pattern of the mica substrate with [001] as zone axis(ZA), a pseudo hexagonal lattice26 with a lattice constant ofa ¼ 5.19 Å and b ¼ 9.04 Å. Figure 1(j) shows the low magnification TEM image of one PbI2 flake transferred onto aTEM grid, whose diffraction pattern is shown in Figure 1(k).The first set of patterns proves to be {33 60} of PbI2 with ZA[0001]. From the alignment of the TEM image and the diffraction pattern, the facets of the flakes prove to be {10 10},which is again in agreement with the surface free energyargument. Crystallographic analysis by combining both optical images (by which we know the orientations of both micaand film) and structural data (by which we conclude the respective parallel planes between mica and film) confirms theepitaxial growth.PL characterization was performed at room temperatureon the PbI2 flakes investigated in Figure 1. PbI2 is a directband gap material with a band gap between 2.3 and 2.4 eV(Ref. 27) and a green luminescence. Figure 2(a) shows thedifferent PL spectra of the flakes with different thicknessesshown in Figures 1(c)–1(f) as well as the powder precursor,the latter of which has a PL peak centered at 541 nm, indicating a band gap of 2.28 eV. All the peaks are normalized atthe peak intensity to emphasize the changing of peak position. From the spectrum, we may clearly notice a uniformtrend in the blue shift of the PL peak from 541 nm to 508 nm(2.28 to 2.43 eV) as the thickness decreases from bulk crystalto 110 nm thin film. The spectra for the thinnest 90 nm filmare absent due to the laser beam damage on the sample. Thetypical PL photoluminescence images of the flakes of athicker transparent flake and a thinner bluish flake are shownin Figures 2(b) and 2(c), respectively.As the film thickness far exceeds a few layers and takinginto consideration the single crystalline, high-temperaturegrowth features, we may well rule out the possibility ofquantum confinement, the grain size, and defected inducedPL shift. We propose that it is the VDW epitaxy and the resultant substrate-film coupling effect that dictates the shiftingof the PL peaks. According to Figure 1, we show the proposed epitaxial relationship with the blue sphere as the mica(M) lattice and the green square as the PbI2 (P) lattice inFigure 3(a). While we still use the conventional monoclinicindexing for mica lattice, the pseudo hexagonal lattice on theFIG. 2. PL spectra of as-grown PbI2 flakes. (a) PL spectrum of PbI2 flakeswith different thicknesses as shown in Figure 1. PL peaks have a uniformtrend of blue shift of about 0.15 eV as the thickness decreases from bulkcrystal to 110 nm; (b) and (c) optical images of thicker (b) and thinner (c)luminescent flakes.Reuse of AIP Publishing content is subject to the terms at: issions. Download to IP: 128.113.37.4 On: Sat, 30 Jul 201618:17:54
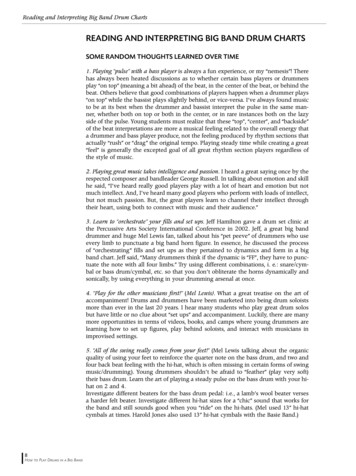
013105-3Wang et al.Appl. Phys. Lett. 108, 013105 (2016)FIG. 3. Quantitative analysis of the PL shift via deformation potential theory. (a) Proposed epitaxial relationship of mica lattice (blue) and PbI2 (green) basedon their lattice types and lattice mismatch. The [10 10 of PbI2 lines up with [310] of mica with a small lattice mismatch as shown by the lower inscriptions; (b)surface plot of the change of band gap with different biaxial strain according to the deformation potential theory. (c) Plot of change of band gap with theinverse of the thickness of the film with different interaction energies from 0.1 to 1 eV. The experiment data are also marked on the plot that fall within themodelling curve region. The yellow curve indicates the Matthews model where misfit dislocations are introduced.(001) plane of mica fits the 6 fold symmetry of PbI2 in termsof lattice type. Moreover, in the [310] direction of mica(in terms of a hexagonal indexing, it would be [11 20]) andthe [10 10] direction of PbI2, the two lattices have a goodlattice match of e ¼d½32120 M 2d½10 10 P2d½10 10 P¼ 0:011, hence creatinga biaxial compressive strain of ex ¼ ey ¼ 1:1%. Therefore,the overall epitaxial relationship is proposed to bePbI2[0001]jjMica[001] with offset angle ¼ 5 and10]jj mica[310].PbI2[10 To investigate quantitatively how the strain may manipulate the shift of band gap and thereafter the PL peak, deformation potential theory is applied. Shockley and Bardeenproposed in 1950s28 a deformation potential theory thatrelated the hydrostatic strain with the change of band gapthrough a coefficient named deformation potential.According to them, the shift in band gap in a non-polar crystal would be a sum of the valence and conduction band shiftand could be approximated asDEg ¼ jDEC j þ jDEV j ¼ ECij eij þ Evij eij ¼ Egij eij ;(1)where E1C and E1V are the deformation potentials of theconduction and valence band, respectively, and E1g is thepotential of the band gap. The theory was first used for thestudy of mobility of semiconductors and later applied withfairly good success in the strain engineering of epitaxial filmwith biaxial strain.29 The deformation potential parameter ofPbI2 has been studied earlier from its mobility data30 thatshowed a value from 5 to 9 eV, which is in a great consistency with a recent first-principle simulation on monolayerPbI2.31 Figure 3(b) shows the surface plot of the change ofband gap of PbI2 in terms of different values of ex and ey anda deformation potential of 7 eV from Eq. (1). The Poissonratio of PbI2 is taken as 0.3 according to the previous literature.32 As expected, the compressive strain increases theband gap which is consistent with the shifting direction ofPL peaks.Thin film mechanics analysis is conducted to take intoaccount the quantitative effect of thickness on the strainingof PbI2. For conventional chemical epitaxy where commensurate growth is usually observed, van der Merwe andMatthews33,34 successfully predicted the thickness dependentstrain in epitaxial film by considering the generation of misfitdislocations. According to them, a critical thickness of thefilm is reached when energetically it is more favored to generate dislocation at the interface to relax the misfit strain andtherefore the strain energy. Upon reaching the critical thickness, the relaxation of the strain is found to be33 Gintbhlnþ1 ;(2)e¼Gf ilm 8pð1 þ tÞhbwhere Gint and Gf ilm denotes the shear modulus at the interfaceand of the film, b is the Burgers vector of the misfit dislocation,h is the film thickness, and t is the Poisson’s ratio of film.Here, the absolute value of Gint reflects whether it is a stronglycovalent interface or a weakly bonded VDW interface. In thecase of PbI2, from the proposed lattice mismatch and theMatthews criterion of critical thickness, such thickness value isonly a few nanometers and all the films observed previouslyshould fall into the region where strain is partially relaxed.With combination of the deformation potential theory, we plotthe change of band gap with the inverse of thickness shown asthe yellow curve in Figure 3(c). The curve is plotted under thecondition that GGfintilm ¼ 1, which is certainly an overestimationsince the bonding strength at the interface should be lowerthan that of the film. However, even with the overestimation,the curve still deviates far away from the experimental data,indicating a much higher strain level in the film.According to above analysis, Matthews theory fails toexplain the observed phenomenon quantitatively. First, theMatthews theory was developed originally to apply for an epitaxy with accurate lattice registration (commensurate growth).But in the case of VDW epitaxy, such prerequisite is not necessarily satisfied and indeed incommensurate growth of ZnOnanowires on mica has been recently observed,35 where a substantial strain of 1% is observed in ZnO. Second, Matthewstheory only deals with the thermodynamic case. However,practically, nucleation and propagation barrier of misfit dislocation act as even more pronounced role in determining strainand critical thickness of thin films. Such scenario is commonly observed in the literature where critical thickness farexceeds the Matthews limit.36 By taking into account theseconsiderations and for a first-order approximation, in thisanalysis, the pseudomorphic thickness of the epitaxial growthReuse of AIP Publishing content is subject to the terms at: issions. Download to IP: 128.113.37.4 On: Sat, 30 Jul 201618:17:54
013105-4Wang et al.Appl. Phys. Lett. 108, 013105 (2016)is applied, which reaches maximum when the strain energycompletely balances out the energy gain from the substratefilm interaction. The strain energy per unit volume with a unitof GPa is a function of the biaxial strain and varies as37Ustrain ¼1ex ey ;s11 þ s12(3)where s11 and s12 are the components of the compliance matrix that can be evaluated by their stiffness counterpartsavailable from the earlier study.32 The substrate-film interaction per unit area, which is VDW in nature, on the otherhand, can be approximated as1UVDW ¼ 6 Eint A;3(4)where Eint denotes the interaction between a pair of latticepoints at the substrate and film and A is the area of the basalplane of the unit cell. Therefore, the pseudomorphic thickness can be estimated ash0 ¼UVDW2Eint ðs11 þ s12 Þ¼q ðnmÞ;UstrainA ex ey(5)where q ¼ 1:6 10 19 is the charge of an electron and Eintin eV. As the overall thickness of the film h exceeds h0 , weapproximate the strain relaxation process from the overallenergy consideration similar to what Matthews has done.The strain e would vary with the thickness of the film h suchthat the interfacial energy benefit always balances out thetotal strain energy, i.e.,e ¼ ½UVDW ðs11 þ s12 Þ h 1 2 ;(6)and therefore the strain would have a h 0:5 dependence onthe overall thickness. Figure 3(c) plots the change of the bandgap as the inverse of film thickness varies from 10 to 600 nmat three different Eint values: (1) 0.1 eV that is commonlyfound to be the value of unstrained two VDW layers lackingepitaxial registration,38 (2) 0.5 eV that is a typical value forthe adsorption energy of heavy metal atoms on VDW substrates,38 and (3) 1 eV resembling that of the weak chemicalbonds. The experimentally obtained data are also marked onthe graph. The plateaus in the three computed curves indicatethe threshold thickness when the maximum band gap changeis reached. From the plot, we may see that the experimentaldata fall within the region of 0.5 eV Eint 1 eV, suggestinga large VDW interaction. The two data points higher than the“plateau” value may possibly suggest a higher deformationpotential value. In addition, the mismatch between the experimental data and Matthew theory suggests the growth may follow incommensurate VDW epitaxy rather than commensurateVDW growth.To further confirm the cause of the PL peak shift and theexistence of VDW strain, bending test and Raman characterization are carried out, respectively. Figure 4(a) shows schematically the setup of the bending test where a single PbI2flake was transferred onto a thick polydimethylsiloxane(PDMS) stamp (10 mm long and 1.5 mm thick). Part of thestamp close to the PbI2 flake was clamped, while a micromanipulation probe was controlled manually to press and liftthe other free end so as to create a uniaxial tensile (compressive) strain. All the manipulation was done on the opticalmicroscope where the PL change caused by the strain can berecorded. Under such setup, the maximum strain exerted on theflake, with its lateral size and thickness neglected, would be39emax ¼3btanðhÞ;2l(7)where b and l are the thickness and length of the beam and h isthe bending angle just close to the clamped side. Figure 4(b)shows the PL spectrum of a thick PbI2 flake (approximatethickness 400 nm) under different stress states, where the compressive state has a bending angle of around 10 and the tensileone 5 equivalent to a strain of 3.97% and 1.96%. In theFIG. 4. Bending test and Raman characterization of the PbI2 flakes. (a)Schematic showing the setup of thebending test. (b) PL spectrum of thesame flake under compressive (black),neutral (red), and tensile (blue) strainstates. (c) Comparison of the dataobtained in (b) with deformationpotential approximation; (d) Ramanspectrum of 110-nm-thick (black),400-nm-thick (red) PbI2 flakes, and thepowder precursor (black). A visiblered shift at the first peak is shown asthe thickness decreases.Reuse of AIP Publishing content is subject to the terms at: issions. Download to IP: 128.113.37.4 On: Sat, 30 Jul 201618:17:54
013105-5Wang et al.neutral state, the PL peak positions at 536 nm, with some redshift compared with the one in Figure 2(a) with similar thickness. This very likely implies that when the film is transferred,the VDW strain is more or less relaxed that makes the bandgap shift towards the original value. The compressive and tensile strains, on the other hand, also have the effect consistentwith the previous deformation potential theory, with the compressive increasing the band gap (536 to 529 nm) and viceversa (536 to 550 nm). The PL spectra for the tensile strainshow an additional “shoulder” to the left of the main peak andwe attribute it to the possible delamination and damage to thefilm when stretched. The result of the bending test is furtherquantitatively studied as shown in Figure 4(c) where the modelling curve and the experimental data are present. We maysee that while both data points fit qualitatively the theoreticalvalue, the tensile strain matches pretty well and the compressive strain deviates quite far away. We believe that, in the caseof a large compressive strain, PbI2 may buckle up and do notfollow completely the curvature of the PDMS stamp and thusexperiencing a much smaller strain. Both the buckling in thecompressive state and the delamination in the tensile state areconsistent with the “soft nature” of the material itself. Also, atrelatively large strain value, the deformation potential theorymay be less accurate, since the theory is a linear approximationfor a small amount of strain at the vicinity of the original bandgap. Finally, to confirm the existence of compressive strain ofthe VDW epitaxial PbI2 flake, Raman characterization wasperformed. Figure 4(d) shows the Raman spectrum of the thinner (110 nm) and thicker (400 nm) flakes and also the powderprecursor, all of which show two peaks at Raman shifts ataround 167 cm 1 and 213 cm 1. The first peak is assigned tothe 2Eg vibration mode while the second one to the 4Eu peakaccording to the previous study,40 with the former one beingmore of interest to the present study since it is related directlywith the shearing motion of the I-Pb-I bonds.41 The spectrumshows as visible red shift from 165 cm 1 to 169 cm 1 as thethickness decreases, which implies a more rigid vibration andhence shorter I-Pb-I bond length and a possible compressivestrain. The second peak, the 4Eu mode is associated with themotion of the two iodide atoms in the z axis compared withthe Pb atom,41 which from the spectrum has very slight changethat is also consistent with our hypothesis.In conclusion, by studying single crystalline soft PbI2crystal through VDW epitaxy, we demonstrate that throughthe deformation potential theory that linearly (when perturbation is small) correlates the strain and the shift of bandgap, thickness-dependent VDW epitaxial strain can be significant (as high as 1.1%) and substantially influence thephotoluminescence properties of the hosted film with a lowYoung’s modulus and heavy atomic masses. Our results suggest a possible approach to modifying the electrical, optical,and possibly magnetic properties of 2D thin films grown byVDW epitaxy.Appl. Phys. Lett. 108, 013105 (2016)J. S. and Y. W. were supported by J.S.’s start-up fundfrom Rensselaer Polytechnic Institute and National ScienceFoundation under Grant No. CMMI 1550941.1K. S. Novoselov, A. K. Geim, S. Morozov, D. Jiang, Y. Zhang, S. A.Dubonos, I. Grigorieva, and A. Firsov, Science 306, 666 (2004).2A. Koma, K. Sunouchi, and T. Miyajima, Microelectron. Eng. 2, 129 (1984).3A. Koma, K. Ueno, and K. Saiki, J. Cryst. Growth 111, 1029 (1991).4A. Geim and I. Grigorieva, Nature 499, 419 (2013).5D. Pathak, R. Bedi, and D. Kaur, Optoelectron. Adv. Mater. 4, 657 (2010).6D. Pathak, R. Bedi, D. Kaur, and R. Kumar, Chalcogenide Lett. 8, 213 (2011).7R. People, Phys. Rev. B 32, 1405 (1985).8K. Zhang, V. Lazarov, T. D. Veal, F. Oropeza, C. F. McConville, R.Egdell, and A. Walsh, J. Phys.: Condens. Matter 23, 334211 (2011).9E. Yablonovitch and E. Kane, J. Lightwave Technol. 6, 1292 (1988).10A. Adams, Electron. Lett. 22, 249 (1986).11M. V. Fischetti and S. E. Laux, J. Appl. Phys. 80, 2234 (1996).12B. Yildiz, MRS Bull. 39, 147 (2014).13J. H. Lee, L. Fang, E. Vlahos, X. Ke, Y. W. Jung, L. F. Kourkoutis, J.-W.Kim, P. J. Ryan, T. Heeg, and M. Roeckerath, Nature 466, 954 (2010).14D. G. Schlom, L.-Q. Chen, C.-B. Eom, K. M. Rabe, S. K. Streiffer, andJ.-M. Triscone, Annu. Rev. Mater. Res. 37, 589 (2007).15A. J. Hauser, E. Mikheev, N. E. Moreno, J. Hwang, J. Y. Zhang, and S.Stemmer, Appl. Phys. Lett. 106, 092104 (2015).16E. Tang and L. Fu, Nat. Phys. 10, 964 (2014).17I. Bozovic, G. Logvenov, I. Belca, B. Narimbetov, and I. Sveklo, Phys.Rev. Lett. 89, 107001 (2002).18J.-U. Lee, D. Yoon, and H. Cheong, Nano Lett. 12, 4444 (2012).19A. Castellanos-Gomez, M. Poot, G. A. Steele, H. S. van der Zant, N.Agra ıt, and G. Rubio-Bollinger, Adv. Mater. 24, 772 (2012).20Q. Peng, W. Ji, and S. De, Comput. Mater. Sci. 56, 11 (2012).21W. Veiga and C. M. Lepienski, Mater. Sci. Eng., A 335, 6 (2002).22K. Shah, F. Olschner, L. Moy, P. Bennett, M. Misra, J. Zhang, M. R.Squillante, and J. C. Lund, Nucl. Instrum. Methods Phys. Res., Sect. A380, 266 (1996).23X. Liu, S. T. Ha, Q. Zhang, M. de la Mata, C. Magen, J. Arbiol, T. C.Sum, and Q. Xiong, ACS Nano 9, 687 (2015).24See supplementary material at http://dx.doi.org/10.1063/1.4939269 for thedescription of the van der Waals epitaxy growth and characterization ofthe PbI2 flakes.25Y. Wang, Y. Shi, G. Xin, J. Lian, and J. Shi, Cryst. Growth Des. 15, 4741(2015).26E. Radoslovich, Acta Crystallogr. 13, 919 (1960).27A. F. Da Silva, N. Veissid, C. An, I. Pepe, N. B. De Oliveira, and A. B. DaSilva, Appl. Phys. Lett. 69, 1980 (1996).28J. Bardeen and W. Shockley, Phys. Rev. 80, 72 (1950).29J. Liu, D. D. Cannon, K. Wada, Y. Ishikawa, D. T. Danielson, S.Jongthammanurak, J. Michel, and L. C. Kimerling, Phys. Rev. B 70, 155309(2004).30P. Bloch, J. Hodby, T. Jenkins, D. Stacey, G. Lang, F. Levy, and C.Schwab, J. Phys. C 11, 4997 (1978).31M. Zhou, W. Duan, Y. Chen, and A. Du, Nanoscale 7, 15168 (2015).32B. Dorner, R. Ghosh, and G. Harbeke, Phys. Status Solidi B 73, 655 (1976).33J. Matthews, D. Jackson, and A. Chambers, Thin Solid Films 26, 129(1975).34J. van der Merwe, Philos. Mag. 7, 1433 (1962).35M. I. B. Utama, F. J. Belarre, C. Magen, B. Peng, J. Arbiol, and Q. Xiong,Nano Lett. 12, 2146 (2012).36A. Fiory, J. Bean, L. Feldman, and I. Robinson, J. Appl. Phys. 56, 1227 (1984).37J. Shen, S. Johnston, S. Shang, and T. Anderson, J. Cryst. Growth 240, 6(2002).38K. T. Chan, J. Neaton, and M. L. Cohen, Phys. Rev. B 77, 235430 (2008).39C. Sun, J. Shi, and X. Wang, J. Appl. Phys. 108, 034309 (2010).40W. M. Sears, M. Klein, and J. Morrison, Phys. Rev. B 19, 2305 (1979).41L. Pedesseau, J. Even, C. Katan, F. Raouafi, Y. Wei, E. Deleporte, andJ.-M. Jancu, Thin Solid Films 541, 9 (2013).Reuse of AIP Publishing content is subject to the terms at: issions. Download to IP: 128.113.37.4 On: Sat, 30 Jul 201618:17:54
Band gap engineering of a soft inorganic compound PbI 2 by incommensurate van der Waals epitaxy Yiping Wang,1 Yi-Yang Sun,2 Shengbai Zhang,2 Toh-Ming Lu,2 and Jian Shi1,a) 1Department of Materials Science and Engineering, Rensselaer Polytechnic Institute, Troy, New York 12180, USA 2Department