Transcription
Advanced Mathematical Decision Making (2010)Table of contentsAdvanced Mathematical Decision MakingIn Texas, also known asAdvanced Quantitative ReasoningStudent MaterialsThese student materials are excerpted from one of seven units that make up the 2010AMDM/AQR instructional materials (developed under the name Advanced MathematicalDecision Making).Unit I: Analyzing Numerical DataUnit II: ProbabilityUnit III: Statistical StudiesUnitUnitUnitUnitIV: Using Recursion in Models and Decision MakingV: Using Functions in Models and Decision MakingVI: Decision Making in FinanceVII: Networks and GraphsTable of ContentsIII.A Student Activity Sheet 1: Overview of Purpose, Design, and Studies . 1III.A Student Activity Sheet 2: Treatment of Subjects .11III.A Student Activity Sheet 3: Margin of Error .14III.A Student Activity Sheet 4: Sampling Design and Methods .17III.B Student Activity Sheet 5: Histograms .25III.B Student Activity Sheet 6: Analyzing Graphical Displays .31III.B Student Activity Sheet 7: Using Technology .37III.B Student Activity Sheet 8: Survey Design .45III.C Student Activity Sheet 9: Introduction to Statistical Bias and Variability .47III.C Student Activity Sheet 10: Statistical Bias in Research Studies and Polls .51Charles A. Dana Center at The University of Texas at Austinii
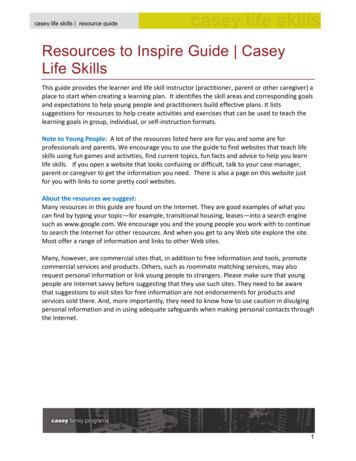
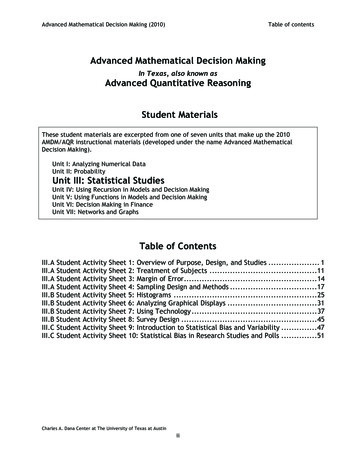
Student:Class:Date:Statistical Studies: Statistical InvestigationsIII.A Student Activity Sheet 1: Overview of Purpose, Design, and StudiesMusic is a large part of many people’s lives.Because of this, it is often the subject of study.For example, Music industry executives want to knowwhat will be popular with different agegroups.Advertisers want to know which radiostations are the most popular.Doctors want to know how much hearingdamage results from loud music.Teachers want to know whether or notlistening to classical music helps studentsperform better on tests.Statistical investigations are used every day for a variety of reasons.1. What are the purposes of statistical investigations? Give some examples of statisticalinvestigations with which you are familiar.This graphic illustrates the process of planning and implementing a statistical investigation.First, a question (or a series of questions) sparks the interest of a researcher. The researchteam then decides on the best design for investigating the question.2. The graph shows no obvious ending point (or starting point). What does this mean?Charles A. Dana Center at The University of Texas at AustinAdvanced Mathematical Decision Making (2010)Activity Sheet 1, 10 pages1
Student:Class:Date:Statistical Studies: Statistical InvestigationsIII.A Student Activity Sheet 1: Overview of Purpose, Design, and StudiesConsider the following examples of two different types of statistical investigations.Example 1Radio rating services sometimes collect data on listenership by asking participants torecord the date, time, and station each time they listen to the radio. Other rating servicesdistribute monitoring devices that automatically record this information anytime theparticipant has the radio turned on. Still others call participants and ask them about theirlistening habits. The data are then compiled so that advertisers know which stations are themost popular at specific times during the day.Each of these approaches is an example of an observational study, which collects dataabout some characteristic(s) of the population. The data can be collected by observation,by a survey or interview, or by other means.3. Describe an observational study in your own words:An observational study is research in whichExample 2A 17-year-old student designed a science fair project with 72 mice randomly assigned tothree groups: hard rock music, Mozart, and no music at all (called a control group). Themice in the first two groups were exposed to music 10 hours a day. Three times a week, allof the groups were timed as they ran through a maze. An analysis of results showed thatthe 24 mice in the no-music group averaged about a 5-minute improvement in their mazecompletion time, while the Mozart mice improved 8.5 minutes. The hard rock mice actuallygot slower—an average of four times slower! Another interesting fact: The student had tostart his experiment over because all the hard-rock mice killed each other. None of theclassical mice did that. (Wertz, M. [1998]. Why classical music is key to education. fromwww.schillerinstitute.org/programs/program symp 2 7 98 tchor .html#Music Mice Mazes)This is an example of an experimental study. In an experimental study, the researcherseparates the participants into one or more groups and applies some sort of treatment. Aftertreatment, the variable of interest is measured and the results are compared.4. What are the treatment and the variable of interest in this case?5. Describe an experimental study in your own words:An experimental study is research in whichCharles A. Dana Center at The University of Texas at AustinAdvanced Mathematical Decision Making (2010)Activity Sheet 1, 10 pages2
Student:Class:Date:Statistical Studies: Statistical InvestigationsIII.A Student Activity Sheet 1: Overview of Purpose, Design, and StudiesObservational and experimental studies have many components that must be planned, suchas sampling and data collection procedures. Then the data must be collected, the resultsanalyzed, and the conclusions reported.6. Referring back to the Research Cycle graphic, why is there an arrow after the Reportbox?And what about the Question box? Consider this situation: “This unopened bag of chips ishalf empty. I wonder if it really contains 28.3 grams as the package says?”This type of informal question or observation is the beginning of many investigations.Informal questions can turn into more formal problem statements or research questions.For example, you may decide to investigate whether there is a scandal in the potato chipindustry by checking the following:“Do Spud Potato Chips contain an average of 28.3 grams of chips per bag?”7. REFLECTION: Now that you have been introduced to the research cycle process, think ofsome research questions that you are interested in studying. List at least three ideas ofresearch questions. Consider the following: What type of study (experimental or observational) might be best to approach each ofyour research questions?If you only have four weeks to actually implement a research study, is it still possibleto study any of your research questions?How can you change one of your questions to make it fit into this timeline?8. Suppose you conduct the investigation into Spud Potato Chips and find that the meanweight of the chips in your sample is 25 grams, rather than 28.3 grams ( x 25 grams).Do you think that a difference of 3.3 grams between the actual and advertised weights islarge enough that it needs to be reported? If so, how do you report this information andto whom?Charles A. Dana Center at The University of Texas at AustinAdvanced Mathematical Decision Making (2010)Activity Sheet 1, 10 pages3
Student:Class:Date:Statistical Studies: Statistical InvestigationsIII.A Student Activity Sheet 1: Overview of Purpose, Design, and StudiesIn some situations, researchers are even more formal and state hypotheses. In a case likethis, the null hypothesis (Ho) generally states that there is no difference between the truevalue and the claimed value. The alternative hypothesis (Ha) states that something isdifferent or incorrect, or that something has changed.9. What are the null and alternative hypotheses for the potato chip example? Ho: The true mean weight Ha: The true mean weightNotice that the hypotheses say “The true mean weight.” This implies that the statementsrefer to the population of all Spud Potato Chip bags, not just a single bag or even a smallsample. When a statistical investigation is conducted, it generally employs a sample thatis then used to make a generalization about the population. Notice that in this case (as inmany cases), population does not refer to people, but to bags of potato chips.To be concise, researchers often use symbols in place of words. Greek letters are usuallyused when referring to populations (the entire group being studied, from which a sampleor samples will be drawn). English letters are used for samples (the particular items orindividuals included in a particular study). For example, when discussing the mean: µ the population mean (Greek letter mu—pronounced mew)x the sample mean (pronounced x-bar)So the hypotheses for a study can be stated in words or symbols. When using symbols, youmust identify what your symbols represent. Ho: µ 28.3 grams, where µ is the true mean weight of a bag of Spud Potato ChipsHa: µ 28.3 gramsStatistical studies are designed with carefully selected measures that ensure (within errormargins) that, if the sample is well selected and the study is well designed and conducted,the mean and other measures of the sample are likely to be similar to the correspondingmeasures of the population being studied. Sometimes, if the population is small (such ashigh school seniors in a small town), it may be possible that the sample studied is the entirepopulation. However, often a sample is a smaller subset of a population (such as a researchquestion that might target the entire population of high school seniors in a state or in thenation).Charles A. Dana Center at The University of Texas at AustinAdvanced Mathematical Decision Making (2010)Activity Sheet 1, 10 pages4
Student:Class:Date:Statistical Studies: Statistical InvestigationsIII.A Student Activity Sheet 1: Overview of Purpose, Design, and StudiesFor Questions 10 and 11, practice writing hypotheses. Write them in words and then convertthem to symbols. Finally, sketch or outline a simple study design that might help study thehypotheses.10. A local pizza shop advertises “an average delivery time of 20 minutes or less,” but itdoes not offer a guarantee such as a free pizza. The national manager, Su Lin, wondersif her employees are fulfilling the claim.11. James believes that his mother’s houseplants would grow taller if she watered withrainwater instead of tap water.Not all studies lend themselves tohypothesis writing. For example, ifGiancarlo is interested in cars, hemight want to collect informationabout the most popular type of caramong teenagers, the most popularcolor, or prices of various models.He would not design a study thattests a hypothesis. He could writeand test hypotheses, however, if hewanted to know whether or not theadvertising for the gas mileage of acertain model is true.12. REFLECTION: Recall the potato chip hypotheses: Ho: µ 28.3 grams, where µ is the true mean weight of a bag of Spud Potato Chips Ha: µ 28.3 gramsWhat would you do next to determine which of these hypotheses is true?Charles A. Dana Center at The University of Texas at AustinAdvanced Mathematical Decision Making (2010)Activity Sheet 1, 10 pages5
Student:Class:Date:Statistical Studies: Statistical InvestigationsIII.A Student Activity Sheet 1: Overview of Purpose, Design, and StudiesThe following cases are examples of observational studies and experimental studies.Consider the type and design of each study.13. Identify the type of study for each case. How do you know? What is the variable of interest in each case? What are some advantages and disadvantages of each teacher’s plan?a. Mrs. Johnson teaches American History and wanted to help her students do theirbest on exams. After failing to find any research on different test formats, shedecided to conduct her own research. She flipped a coin for each student in herclasses. If the coin landed heads up, the student took a multiple-choice test. Ifthe coin landed tails up, the student received a fill-in-the blank exam. Afterward,Mrs. Johnson compared the averages for the two test formats.b. In World History, Mr. McDonald had a similar concern. He decided, however, to askhis students. He put a question at the bottom of an exam: “Which do you prefer,multiple-choice or fill-in-the-blank questions?” Afterward, Mr. McDonald tallied theresults.c. Mr. Mitchell was interested in the effects of music on student performance. At thebottom of his exam, he asked students to circle their favorite type of music: rock,country, or hip-hop. He then computed the averages for the students who liked eachtype of music and compared the results.d. Mrs. Knox’s senior English classes were working on their term themes. During 2ndperiod, she allowed students to listen to their choice of music through earphoneswhile working, but her 4th-period class was required to work quietly without music.Mrs. Knox averaged this major grade for each class and compared 2nd period’saverage to 4th period’s average.e. Mr. Paul, the guitar teacher, sat at the food court in the mall and made a tally sheetthat noted each t-shirt he saw with a musical group illustrated on it. He compiledthe results and posted an entry to his blog about the most popular groups.Charles A. Dana Center at The University of Texas at AustinAdvanced Mathematical Decision Making (2010)Activity Sheet 1, 10 pages6
Student:Class:Date:Statistical Studies: Statistical InvestigationsIII.A Student Activity Sheet 1: Overview of Purpose, Design, and Studies14. In the experimental studies: Describe the treatment(s) Who were the participants? How was the assignment of treatment(s) accomplished?15. A group of participants that the treatment group is being compared to is called thecontrol group. Give an example of a treatment, the treatment group, and the controlgroup.Researchers are often concerned that participants in a study show improvement simplybecause they are in the study and not because they are receiving an effective treatment.This is called the placebo effect.Example 1: Half of the participants in a study for a new headache remedy receive the newpill, while the remaining participants receive a pill containing only inactive ingredients.Participants receiving the inactive pill (the placebo) report that their headaches have beensomewhat relieved. These participants believed they were being treated, and this beliefmay have affected their perception.Example 2: Half of the athletes in a study received a new lotion for strained muscles,while the other half received a lotion with only inactive ingredients. Both groups reportimprovement in their muscle pain.16. The improvement in Example 2 could be psychological, as in Example 1. Can you thinkof any other reason for the improvement?17. REFLECTION: Consider Mrs. Johnson and Mr. McDonald’s exam situations. Suppose Mrs.Johnson’s results overwhelmingly favor fill-in-the-blank exams and Mr. McDonald’sresults strongly favor the multiple-choice format. Are these results in conflict with eachother? What could be the cause(s) of this difference?Suppose Mrs. Johnson takes her results to the school board and asks the board torequire that all teachers in the district give fill-in-the-blank exams. If a school boardmember asks you what should be done, what recommendations would you give?18. REFLECTION: Mrs. Johnson applied two different treatments to the participants in herstudy—some students received a multiple-choice test, and the rest received a fill-inthe-blank exam. Can you think of two treatments that could be used in a medicalexperiment? In a cooking experiment? Would a situation with three or more treatmentsbe possible? Explain your thinking.Charles A. Dana Center at The University of Texas at AustinAdvanced Mathematical Decision Making (2010)Activity Sheet 1, 10 pages7
Student:Class:Date:Statistical Studies: Statistical InvestigationsIII.A Student Activity Sheet 1: Overview of Purpose, Design, and Studies19. EXTENSION: Read the summary of actual studies on the following pages. For one of thestudies, determine the following information. Be prepared to share your findings in ashort presentation.a. Is the study observational or experimental? Explain your answer.b. Who/what are the participants or experimental units?c. If experimental, what was the treatment(s)?d. If there was a treatment, how was it assigned?e. Was there a control group and/or a placebo?f. If observational, what was being observed and why?g. Are there any statements that appear to be opinions?h. Are there any stated or implied limitations to the study?Charles A. Dana Center at The University of Texas at AustinAdvanced Mathematical Decision Making (2010)Activity Sheet 1, 10 pages8
Student:Class:Date:Statistical Studies: Statistical InvestigationsIII.A Student Activity Sheet 1: Overview of Purpose, Design, and StudiesTobacco and middle school and high school studentsThe Centers for Disease Control and Prevention conducted the National Youth TobaccoSurvey (NYTS) in 2004 to measure current use of tobacco products and selected indicatorsrelated to tobacco use, including youth exposure to tobacco-related media and access tocigarettes.The survey was distributed to 267 U.S. public and private schools; 14,034 middle schoolstudents and 13,738 high school students completed the survey. Participation was voluntaryand anonymous, and school parental permission procedures were followed. Some resultsincluded:A. 11.7% of middle school students and 28% of high school students reported current useof a tobacco product.B. 77.9% of middle school students and 86.5% of high school students reported seeingactors using tobacco on television or in movies.C. 70.6% of current cigarette smokers in middle school and 63.9% in high school said theywere not asked to show proof of age when they purchased or attempted to purchasecigarettes from a store.These results indicate very little change from the results of the 2002 survey. The lack ofsubstantial decreases in the use of tobacco products among students indicates the need to increase the retail price of tobacco products,implement smoking-prevention media campaigns, anddecrease minors’ access.The findings in this report are subject to limitations. First, these data apply only to youthswho attended middle school or high school. Among 16- and 17-year-olds in the United States,approximately 5% were not enrolled in a high school program and had not completed highschool in 2000. Second, the questionnaire was offered only in English. Thus, comprehensionmight have been limited for students with English as a second language.(Adapted from Centers for Disease Control. Tobacco Use, Access, and Exposure to Tobacco in Media AmongMiddle and High School Students—United States, 2004. from rles A. Dana Center at The University of Texas at AustinAdvanced Mathematical Decision Making (2010)Activity Sheet 1, 10 pages9
Student:Class:Date:Statistical Studies: Statistical InvestigationsIII.A Student Activity Sheet 1: Overview of Purpose, Design, and StudiesScientists in Turkey undertook a study of people with epilepsy. The research includedanalyzing scalp hair samples from 22 participants with epilepsy and 23 participants withoutepilepsy, checking for differences in levels of copper, iron, zinc, magnesium, and calcium.(The researchers speculate that such differences could indicate metabolic differences thatmay contribute to epilepsy.) Results indicated that the epileptic group had significantlylower levels of copper and iron compared to the nonepileptic group.(Avci, H., Kizilkan, N., & Yaman, M. [2008]. Comparison of Trace Element Concentrations in Scalp Hair ofEpileptic and Normal Subjects. Trace Elements and Electrolytes. Vol. 25, No. 3, pp.147–155)Scientists in Nigeria, in an effort to find an inexpensive method of raising rabbits for food,designed a study to test the effect of replacing some of the rabbits’ soybean diet withGliricidia sepium Leaf Meal (GLM). Twenty-five young rabbits were randomly assigned toreceive either 0%, 5%, 10%, 15%, or 20% GLM. The groups showed no significant differencein the amount of harvestable meat, while decreasing costs of raising the meat.(Amata, I., & Bratte, L. [2008]. The Effect of Partial Replacement of Soybean Meal Asian Journal of Animaland Veterinary Advances. Vol. 3, No. 3, pp. 169–173. from www.scialert.net/qredirect.php?doi ajava.2008.169.173&linkid pdf)Charles A. Dana Center at The University of Texas at AustinAdvanced Mathematical Decision Making (2010)Activity Sheet 1, 10 pages10
Charles A. Dana Center at The University of Texas at Austin Advanced Mathematical Decision Making ( 2010) Activity Sheet 1, 10 pages 1 Music is a large part of many people’s lives. Because of this, it is often the subject of study. For example, Music industry executives wan