Transcription
Graphics HandlesAdvanced PlottingMATLAB File ExchangePublication-Quality GraphicsAnimationLecture 2Advanced MATLAB:GraphicsMatthew J. ZahrCME 292Advanced MATLAB for Scientific ComputingStanford University25th September 2014CME 292: Advanced MATLAB for SCLecture 2
Graphics HandlesAdvanced PlottingMATLAB File ExchangePublication-Quality GraphicsAnimationAnnouncementsOffice hours are set for 5p - 7p in Durand 028 (or bydrop-in/appointment)Homework 1 out today, due next Thursday (10/2)(Optional) ProjectCME 292: Advanced MATLAB for SCLecture 2
Graphics HandlesAdvanced PlottingMATLAB File ExchangePublication-Quality GraphicsAnimationpackpack frees up needed space by reorganizing information so that it only usesthe minimum memory required. All variables from your base and globalworkspaces are preserved. Any persistent variables that are defined at thetime are set to their default value (the empty matrix, []).Useful if you have a large numeric array that you know you have enoughmemory to store, but can’t find enough contiguous memoryNot useful if your array is too large to fit in memoryCME 292: Advanced MATLAB for SCLecture 2
Graphics HandlesAdvanced PlottingMATLAB File ExchangePublication-Quality GraphicsAnimation1Graphics Handles2Advanced Plotting2D PlottingGrid DataScalars over AreasVector FieldsScalars over VolumesVectors over Volumes3MATLAB File Exchange4Publication-Quality Graphics5AnimationCME 292: Advanced MATLAB for SCLecture 2
Graphics HandlesAdvanced PlottingMATLAB File ExchangePublication-Quality GraphicsAnimationOutline1Graphics Handles2Advanced Plotting2D PlottingGrid DataScalars over AreasVector FieldsScalars over VolumesVectors over Volumes3MATLAB File Exchange4Publication-Quality Graphics5AnimationCME 292: Advanced MATLAB for SCLecture 2
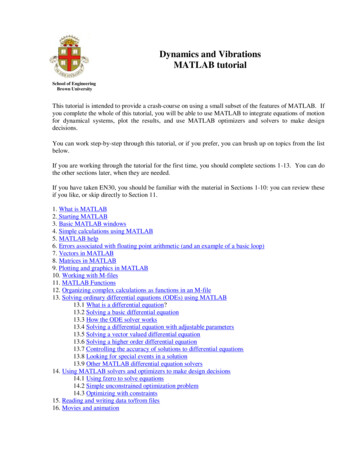
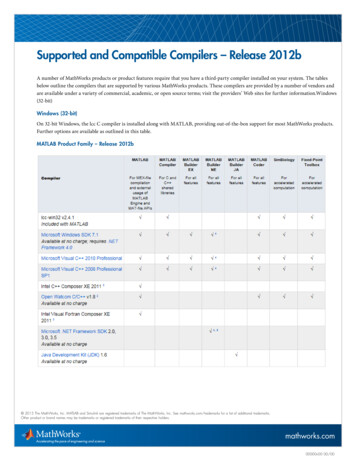
Graphics HandlesAdvanced PlottingMATLAB File ExchangePublication-Quality GraphicsAnimationOverviewGraphics objectsBasic drawing elements used by MATLAB to display dataEach object instance has unique identifier, handleStored as a doubleObjects organized in hierarchyFigure : Organization of Graphics Objects (MathWorks http://www.mathworks.com/help/matlab/creating plots/organization-of-graphics-objects.html)CME 292: Advanced MATLAB for SCLecture 2
Graphics HandlesAdvanced PlottingMATLAB File ExchangePublication-Quality GraphicsAnimationGraphics ObjectsTwo basic types of graphics objectsCore graphics objectaxes, image, light, line, patch, rectangle, surface, patchComposite graphics objectPlot objectsareaseries, barseries, contourgroup, errorbarseries,lineseries, quivergroup, scattergroup, staircase,stemseries, surfaceplotAnnotation objectsarrow, doublearrow, ellipse, line, rectangle, textarrow, textboxGroup objectshggroup, hgtransformUser Interface objectsCME 292: Advanced MATLAB for SCLecture 2
Graphics HandlesAdvanced PlottingMATLAB File ExchangePublication-Quality GraphicsAnimationGraphics HandleSimilar to pointers in that they contain a reference to a particulargraphics objecth1 figure(2); h2 h1;Both h1, h2 point to figure 2Best way to obtain graphics handle is from the call that creates thegraphics object, i.e.figH figure('pos',[141,258,869,523]);axH axes();ax1H subplot(2,2,3);sinH plot(sin(linspace(0,2*pi,100)))[c,contH] contour(peaks);Alternatively, obtain graphics handle manuallySelect figure/axes/object of interest with mouseUse gcf, gca, gcoGraphics handles stored as doubleCME 292: Advanced MATLAB for SCLecture 2
Graphics HandlesAdvanced PlottingMATLAB File ExchangePublication-Quality GraphicsAnimationHandle stored asdoubleThe value of the double really is the only identifier of the graphics object ansformat longax1 gca % Copy/paste output to ax2ax2 1.197609619140625e 03ishandle(ax2) 1CME 292: Advanced MATLAB for SCLecture 2
Graphics HandlesAdvanced PlottingMATLAB File ExchangePublication-Quality GraphicsAnimationSpecifying Figure or Axes to UseHandles can be used to specify which figure or axes is used when newgraphics objects generatedSpecify figure in which to create new axes objectfor i 1:10, fHan(i) figure(); endax axes('Parent',fHan(4))Specify axes in which to create new graphics objectMost, if not all, plotting commands accept an axes handle as the firstargumentGraphics object generated in axes object corresponding to handle passedIf axes handle not specified, gca used[C,objHan] contourf(ax,peaks)By default, MATLAB uses gcf (handle of current figure) or gca (handleof current axes)CME 292: Advanced MATLAB for SCLecture 2
Graphics HandlesAdvanced PlottingMATLAB File ExchangePublication-Quality GraphicsAnimationExerciseYou are provided a fairly useless piece of code below (which plot ex.m)Your task is to alter the code below such thatsin(k*x) is plotted vs x for k even in a single figuresin(k*x) is plotted vs x for k odd in a single figure (different figurefrom the one above)figure;axes(); hold on;figure;axes(); hold on;x linspace(0,2*pi,1000);for k 1:10plot(x,sin(k*x));endCME 292: Advanced MATLAB for SCLecture 2
Graphics HandlesAdvanced PlottingMATLAB File ExchangePublication-Quality GraphicsAnimationWorking with Graphics turn handle of current axesReturn handle of current figureReturn handle of current objectQuery values of object’s propertiesTrue if value is valid object handleSet values of an object’s propertiesCME 292: Advanced MATLAB for SCLecture 2
Graphics HandlesAdvanced PlottingMATLAB File ExchangePublication-Quality GraphicsAnimationWorking with Graphics findobjDescriptionReturn all children of objectsReturn ancestor of objectCopy graphics objectDelete an objectReturn all graphics objectsReturn handles of objects withspecified propertyCME 292: Advanced MATLAB for SCLecture 2
Graphics HandlesAdvanced PlottingMATLAB File ExchangePublication-Quality GraphicsAnimationQuery/Modify Graphics Object Propertiesget to query properties and values for any graphics handleget(han)Display all properties and values to screenget(han,'Property')Display Property value to screenV get(han)Store all properties-value pairs in structure VV get(han,'Property')Store Property value in Vset to set properties for any graphics handleset(han,'Prop 1',Val 1,'Prop 2',Val 2.)Set Prop j’s value to Val jset(han,s)%s structureSet property-value pairs from sset(han,pn,pv)%pn, pv cell arraysSet value of property pn{i} to pv{i}CME 292: Advanced MATLAB for SCLecture 2
Graphics HandlesAdvanced PlottingMATLAB File ExchangePublication-Quality GraphicsAnimationProperties Common to All hildrenClippingCreateFcnDeleteFcnDescriptionon when object’s DeleteFcn calledControl callback routine interruptionCallback routine that executes whenbutton pressedHandles of all object’s child objectsEnables/disables clippingCallback routine that executes whenobject createdCallback routine that executes whenobject deletedCME 292: Advanced MATLAB for SCLecture 2
Graphics HandlesAdvanced PlottingMATLAB File ExchangePublication-Quality GraphicsAnimationProperties Common to All ParentSelectedDescriptionAllows control over object handle’svisibility (command line andcallbacks)Determines if object selectable viamouse clickDetermines whether callback can beinterrupted by subsequently calledcallbackThe object’s parentIndicates whether object is selectedCME 292: Advanced MATLAB for SCLecture 2
Graphics HandlesAdvanced PlottingMATLAB File ExchangePublication-Quality GraphicsAnimationProperties Common to All ibleDescriptionSpecifies whether object visuallyindicates selection stateUser-specified object labelThe type of objectAny data user associates with objectDetermines whether object is visibleCME 292: Advanced MATLAB for SCLecture 2
Graphics HandlesAdvanced PlottingMATLAB File ExchangePublication-Quality GraphicsAnimationFigure, Axes, and Plot ObjectsFigure windowget(gcf) to see all properties of Figure object and defaultsColormap, Position, PaperPositionModeAxes ObjectAxes objects contain the lines, surfaces, and other objects that representthe data visualized in a graphget(gca) to see all properties of Figure object and defaultsXLim, YLim, ZLim, CLim, XGrid, YGrid, ZGrid, XTick, XTickLabel,YTick, YTickLabel, ZTick, ZTickLabel, XScale, YScale, ZScalePlot ObjectsPlot objects are composite graphics objects composed of one or more coreobjects in a groupXData, YData, ZData, Color, LineStyle, LineWidthCME 292: Advanced MATLAB for SCLecture 2
Graphics HandlesAdvanced PlottingMATLAB File ExchangePublication-Quality GraphicsAnimationThe Figure Windowget(gcf) to see all properties of Figure object and defaultsColormapDefines colors used for plotsMust be m 3 array of m RGB valuesPaperOrientation, PaperPosition, PaperPositionMode,PaperSizeRelevant for printingPositionPosition and size figure: [x, y, w, h]x, y - (x, y) coordinates of lower left corner of figurew, h - width, height of figureNextPlotBehavior when multiple axes object added to figureCME 292: Advanced MATLAB for SCLecture 2
Graphics HandlesAdvanced PlottingMATLAB File ExchangePublication-Quality GraphicsAnimationThe Axes ObjectAxes objects contain the lines, surfaces, and other objects that represent thedata visualized in a graphget(gca) to see all properties of Axes object and defaultsXLim, YLim, ZLim, CLimSet plot limits in each dimension (including color)More information on CLim hereXGrid, XMinorGrid, YGrid, YMinorGrid, ZGrid, ZMinorGridToggle major and minor grid lines in each dimensionXTick, XTickLabel, YTick, YTickLabel, ZTick, ZTickLabelControl tick locations and labels in each dimensionXScale, YScale, ZScaleToggle between linear and log scale in each dimensionCamera, Fonts, Line style optionsCME 292: Advanced MATLAB for SCLecture 2
Graphics HandlesAdvanced PlottingMATLAB File ExchangePublication-Quality GraphicsAnimationColormapColormaps enable control over how MATLAB maps data values to colors insurfaces, patches, images, and plotting functionsC colormap(jet(128));Sets colormap of current figure to jet with 128 colorsautumn, bone, colorcube, cool, copper, flag, gray, hot, hsv,jet, lines, pink, prism, spring, summer, white, winterAlternatively fig figure();ax axes('Parent',fig);load spine; image(X);colormap(ax,bone);This is a bit strange as Colormap is a property of the figure (not axes),but the axes handle is passed to colormapAccess to figure handle (get(ax,'Parent'))CME 292: Advanced MATLAB for SCLecture 2
Graphics HandlesAdvanced PlottingMATLAB File ExchangePublication-Quality GraphicsAnimationPlot ObjectsPlot objects are composite graphics objects composed of one or morecore objects in a groupMost common plot objects: lineseries, contourgroupLineseriesXData, YData, ZDataControl x, y, z data used to plot lineColor, LineStyle, LineWidthControl appearance of lineMarker, MarkerSize, MarkerEdgeColor, MarkerFaceColorControl appearance of markers on lineContourgroupXData, YData, ZDataControl x, y, z data used to plot lineLineStyle, LineWidth, LineColorFill, LevelStepCME 292: Advanced MATLAB for SCLecture 2
Graphics HandlesAdvanced PlottingMATLAB File ExchangePublication-Quality GraphicsAnimationLegendProbably familiar with basic legend syntaxlegend('First plotted','Second .plotted','Location','Northwest')What if legend based on order of objects plotted is not sufficient?Use handles for fine grained controllegend(h,'h(1)label','h(2)label')Legend handleGet handle by leg legend( )Use handle to control size/location (more control that 'Location')Font size/style, interpreter, line style, etcCME 292: Advanced MATLAB for SCLecture 2
Graphics HandlesAdvanced PlottingMATLAB File ExchangePublication-Quality GraphicsAnimationCallback RoutinesFunction associated with graphics handle that gets called in response toa specific action applied to the associated graphics objectObject creation, deletionMouse motion, mouse press, mouse release, scroll wheelKey press, key releaseMore hereAll callback routines automatically passed two inputsHandle of component whose callback is being executedEvent dataCallback routines specified in many possible formsStringExpression evaluated in base workspaceFunction handleCell arrays to pass additional arguments to callback routineCME 292: Advanced MATLAB for SCLecture 2
Graphics HandlesAdvanced PlottingMATLAB File ExchangePublication-Quality GraphicsAnimationDemo & In-Class Assignmentgraphics obj han ex.mCME 292: Advanced MATLAB for SCLecture 2
Graphics HandlesAdvanced PlottingMATLAB File ExchangePublication-Quality GraphicsAnimation2D PlottingGrid DataScalars over AreasVector FieldsScalars over VolumesVectors over VolumesOutline1Graphics Handles2Advanced Plotting2D PlottingGrid DataScalars over AreasVector FieldsScalars over VolumesVectors over Volumes3MATLAB File Exchange4Publication-Quality Graphics5AnimationCME 292: Advanced MATLAB for SCLecture 2
Graphics HandlesAdvanced PlottingMATLAB File ExchangePublication-Quality GraphicsAnimation2D PlottingGrid DataScalars over AreasVector FieldsScalars over VolumesVectors over VolumesLine rrorbarfplotezplotezplot3Description2D line plot2D line plot, y-axes both sides3D line plot2D line plot: x- and y-axis log scale2D line plot, x-axis log, y-axis linear2D line plot, x-axis linear, y-axis logError bars along 2D line plotPlot function between specified limitsFunction plotter2D parametric curve plotterCME 292: Advanced MATLAB for SCLecture 2
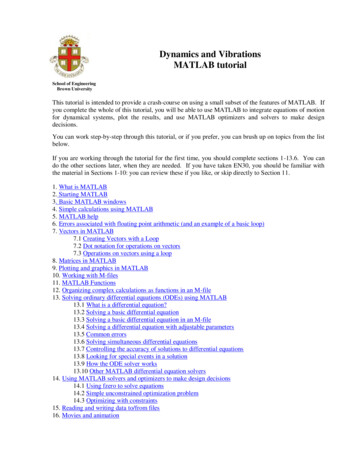
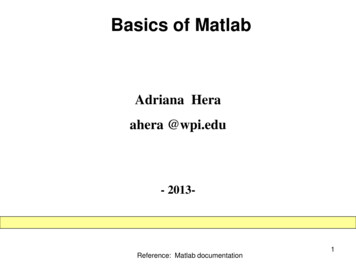
Graphics HandlesAdvanced PlottingMATLAB File ExchangePublication-Quality GraphicsAnimationExamples:2D PlottingGrid DataScalars over AreasVector FieldsScalars over VolumesVectors over Volumesplotyy, errorbarFigure : errorbar PlotFigure : plotyy Plot2000.81500.61000.4500.21.510.500 50 0.2 100 0.4 150 0.60 0.5 1 2000123456789 0.810 1.5 0.50Code: advanced plotting ex.mCME 292: Advanced MATLAB for SCLecture 20.511.522.533.5
Graphics HandlesAdvanced PlottingMATLAB File ExchangePublication-Quality GraphicsAnimation2D PlottingGrid DataScalars over AreasVector FieldsScalars over VolumesVectors over VolumesLine plots: ExamplesMultiple y-axes[ax,h1,h2] plotyy(X1,Y1,X2,Y2)Plot X1, Y1 using left axis and X2, Y2 using right axis[ax,h1,h2] plotyy(X1,Y1,X2,Y2,'function')Plot X1, Y1 using left axis and X2, Y2 using right axis with plottingfunction defined by string 'function'[ax,h1,h2] plotyy(X1,Y1,X2,Y2,'f1','f2')Plot X1, Y1 using left axis with plotting function 'f1' and X2, Y2 usingright axis with plotting function 'f2'Error plotsh errorbar(X,Y,E)Create 2D line plot from data X, Y with symmetric error bars defined by Eh errorbar(X,Y,L,U)Create 2D line plot from data X, Y with upper error bar defined by U andlower error bar defined by LCME 292: Advanced MATLAB for SCLecture 2
Graphics HandlesAdvanced PlottingMATLAB File ExchangePublication-Quality GraphicsAnimation2D PlottingGrid DataScalars over AreasVector FieldsScalars over VolumesVectors over VolumesPie Charts, Bar Plots, and HistogramsCommandbar, barhbar3, bar3hhisthistcroseparetoareapie, pie3DescriptionVertical, horizontal bar graphVertical, horizontal 3D bar graphHistogramHistogram bin count (no plot)Angle histogramPareto chartFilled area 2D plot2D, 3D pie chartCME 292: Advanced MATLAB for SCLecture 2
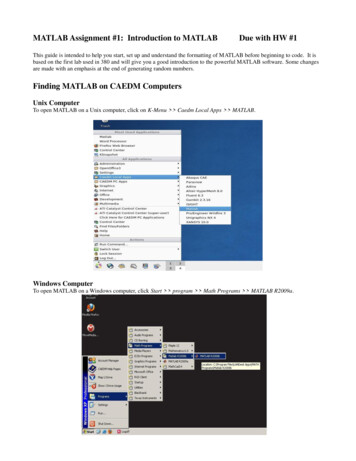
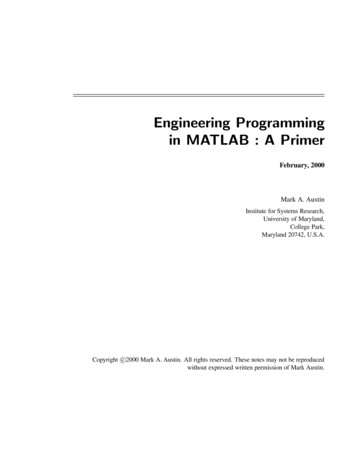
Graphics HandlesAdvanced PlottingMATLAB File ExchangePublication-Quality GraphicsAnimationExamples:2D PlottingGrid DataScalars over AreasVector FieldsScalars over VolumesVectors over Volumeshist, bar, barh, pie3Figure : pie3 PlotFigure : hist/bar/barh PlotLife of a Graduate Studenthist300250Fun (CME292)Sleep200150100500 4 3 2 e: advanced plotting ex.mCME 292: Advanced MATLAB for SCLecture 2
Graphics HandlesAdvanced PlottingMATLAB File ExchangePublication-Quality GraphicsAnimation2D PlottingGrid DataScalars over AreasVector FieldsScalars over VolumesVectors over VolumesDiscrete Data PlotsCommandstem, stem3stairscatter, scatter3DescriptionPlot 2D, 3D discrete sequence dataStairstep graph2D, 3D scatter plotCME 292: Advanced MATLAB for SCLecture 2
Graphics HandlesAdvanced PlottingMATLAB File ExchangePublication-Quality GraphicsAnimation2D PlottingGrid DataScalars over AreasVector FieldsScalars over VolumesVectors over VolumesPolar r coordinates plotAngle histogram plotPlot arrows emanating from originPolar coordinate plotterCME 292: Advanced MATLAB for SCLecture 2
Graphics HandlesAdvanced PlottingMATLAB File ExchangePublication-Quality GraphicsAnimation2D PlottingGrid DataScalars over AreasVector FieldsScalars over VolumesVectors over VolumesGenerating Grid DataMATLAB graphics commands work primarily in terms of N -D gridsUse meshgrid to define grid compatible with 2D, 3D MATLAB plottingcommands from discretization in each dimension[X,Y] meshgrid(x,y)[X,Y,Z] meshgrid(x,y,z)CME 292: Advanced MATLAB for SCLecture 2
Graphics HandlesAdvanced PlottingMATLAB File ExchangePublication-Quality GraphicsAnimation2D PlottingGrid DataScalars over AreasVector FieldsScalars over VolumesVectors over VolumesmeshgridGenerate 2D grid: [X,Y] meshgrid(x,y)RelationshipsX(i,:) Y(:,j) X(:,i) Y(j,:) x for all iy for all jx(i) for all iy(j) for all jGenerate 3D grid: [X,Y,Z] meshgrid(x,y,z)RelationshipsX(i,:,k) Y(:,j,k) Z(i,j,:) X(:,i,:) Y(j,:,:) Z(:,:,k) x for all i, ky for all j, kz for all i, jx(i) for all i,y(j) for all jz(k) for all kCME 292: Advanced MATLAB for SCLecture 2
Graphics HandlesAdvanced PlottingMATLAB File ExchangePublication-Quality GraphicsAnimationImplication ofmeshgrid2D PlottingGrid DataScalars over AreasVector FieldsScalars over VolumesVectors over VolumesorderingConsider the implication of meshgrid in the context of the functionF(x, y) sin(x) cos(y)s linspace(0,2*pi,100)[X,Y] meshgrid(s,s)F sin(X).*cos(Y)F(i,j) sin(X(i,j))*cos(Y(i,j)) sin(s(?))*cos(s(?)) sin(s(j))*cos(s(i))CME 292: Advanced MATLAB for SCLecture 2
Graphics HandlesAdvanced PlottingMATLAB File ExchangePublication-Quality GraphicsAnimationmeshgrid2D PlottingGrid DataScalars over AreasVector FieldsScalars over VolumesVectors over Volumesand Plotting FunctionsIn MATLAB Help documentation, grid or domain data inputs/outputsusually refer to output of meshgrid or meshgrid or ndgridCME 292: Advanced MATLAB for SCLecture 2
Graphics HandlesAdvanced PlottingMATLAB File ExchangePublication-Quality GraphicsAnimation2D PlottingGrid DataScalars over AreasVector FieldsScalars over VolumesVectors over VolumesContour PlotsPlot scalar-valued function of two variables as lines of constant value.Visualize f (x, y) R by displaying lines where f (x, y) c for variousvalues of eezcontourezcontourfDescriptionContour plotFilled contour plotContour plot computation (no plot)3D contour plotDraw contours in volume slice planesContour plotterFilled contour plotterCME 292: Advanced MATLAB for SCLecture 2
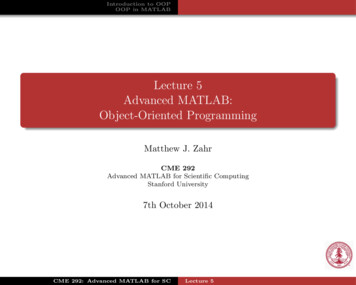
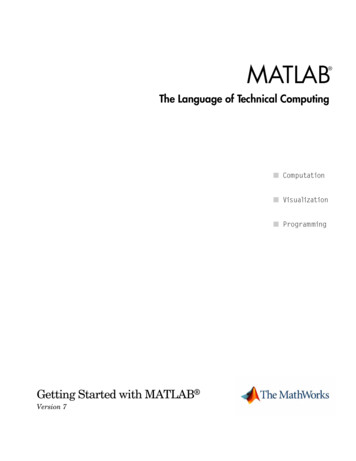
2D PlottingGrid DataScalars over AreasVector FieldsScalars over VolumesVectors over VolumesGraphics HandlesAdvanced PlottingMATLAB File ExchangePublication-Quality GraphicsAnimationContour Plots454540403535303025258642200 220 41515101055 6404030302020105101520253035(a) contour4045510152025303540(b) contourfCode for plots generated in the remainder of the section:advanced plotting ex.m or lec figs.mCME 292: Advanced MATLAB for SCLecture 21045(c) contour3
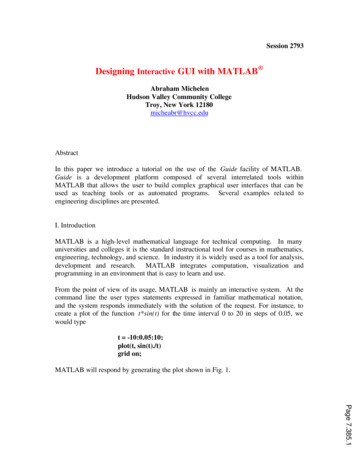
Graphics HandlesAdvanced PlottingMATLAB File ExchangePublication-Quality GraphicsAnimation2D PlottingGrid DataScalars over AreasVector FieldsScalars over VolumesVectors over VolumesSurface and Mesh PlotsPlot scalar-valued function of two variables f (x, y) bbonezsurf, ezsurfcezmesh,ezmeshcDescription3D shaded surface plotContour plot under surf plotSurface plot with colormap lightingCompute/plot 3D surface normalsMesh plotContour plot under mesh plotWaterfall plotRibbon plotColored surface plottersMesh plottersCME 292: Advanced MATLAB for SCLecture 2
2D PlottingGrid DataScalars over AreasVector FieldsScalars over VolumesVectors over VolumesGraphics HandlesAdvanced PlottingMATLAB File ExchangePublication-Quality GraphicsAnimationSuface/Mesh Plots101010886654422000 2 2 5 4 4 6 6 1050 85040 30200000(b) surfc(a) surf10100(c) waterfall108654200 2 5 4 6 1050 850405030403020201040503040302020101010000(d) meshCME 292: Advanced MATLAB for SC0(e) meshcLecture 2
Graphics HandlesAdvanced PlottingMATLAB File ExchangePublication-Quality GraphicsAnimation2D PlottingGrid DataScalars over AreasVector FieldsScalars over VolumesVectors over VolumesContour/Surface/Mesh Plots[C,h] contour func(Z)Contour plot of matrix Z[C,h] contour func(Z,n)Contour plot of matrix Z with n contour levels[C,h] contour func(Z,v)Contour plot of matrix Z with contour lines corresponding to the values inv[C,h] contour func(X,Y,Z)Contour plot of matrix Z over domain X, Y[C,h] contour func(X,Y,Z,n)Contour plot of matrix Z over domain X, Y with n levels[C,h] contour func(X,Y,Z,v)Contour plot of matrix Z over domain X, Y with contour linescorresponding to the values in vSimilar for surface/mesh plotsCME 292: Advanced MATLAB for SCLecture 2
Graphics HandlesAdvanced PlottingMATLAB File ExchangePublication-Quality GraphicsAnimation2D PlottingGrid DataScalars over AreasVector FieldsScalars over VolumesVectors over VolumesVector FieldsVisualize vector-valued function of two or three variables F(x, y) R2 orF(x, y, z) R3Commandfeatherquiver, quiver3compassstreamslicestreamlineDescriptionPlot velocity vectors along horizontalPlot 2D, 3D velocity vectors fromspecified pointsPlot arrows emanating from originPlot streamlines in slice planesPlot streamlines of 2D, 3D vector dataCME 292: Advanced MATLAB for SCLecture 2
Graphics HandlesAdvanced PlottingMATLAB File ExchangePublication-Quality GraphicsAnimation2D PlottingGrid DataScalars over AreasVector FieldsScalars over VolumesVectors over VolumesVector Fields10.80.60.40.20 0.2 0.4 0.6 0.8 1 2 1.5 1 0.500.51Figure : contour, quiver, streamlineCME 292: Advanced MATLAB for SCLecture 21.52
Graphics HandlesAdvanced PlottingMATLAB File ExchangePublication-Quality GraphicsAnimationVector fields:2D PlottingGrid DataScalars over AreasVector FieldsScalars over VolumesVectors over Volumesquiver, feather, compassQuiver plotsh quiver(X,Y,U,V)Displays velocity vectors as arrows with components (u,v) at the point(x,y)X,Y generated with meshgridAdditional call syntaxes to control displayh quiver3(X,Y,Z,U,V,W)Displays velocity vectors as arrows with components (u,v,w) at thepoint (x,y,z)X,Y,Z generated with meshgridAdditional call syntaxes to control displayQuivergroup Propertiesfeather, compass similar, but simpler (don’t require X, Y)CME 292: Advanced MATLAB for SCLecture 2
Graphics HandlesAdvanced PlottingMATLAB File ExchangePublication-Quality GraphicsAnimation2D PlottingGrid DataScalars over AreasVector FieldsScalars over VolumesVectors over VolumesStreamline-type plotsFlow field0.60.40.20 0.2 0.4 2 1.5 1 0.50Figure : quiver, streamline, fill plotsCME 292: Advanced MATLAB for SCLecture 20.51
Graphics HandlesAdvanced PlottingMATLAB File ExchangePublication-Quality GraphicsAnimation2D PlottingGrid DataScalars over AreasVector FieldsScalars over VolumesVectors over VolumesStreamline-type plotsstreamline, stream2, stream3Relevant for vector-valued functions of 2 or 3 variables (F(x, y) orF(x, y, z))Requires points to initialize streamlinesPlot the trajectory of a particle through a vector field that was placedat a given positionhan streamline(X,Y,Z,F1,F2,F3,StX,StY,StZ)X, Y, Z - grid generated with meshgridF1,F2,F3 - vector components of F over gridStX, StY, StZ - vectors (of the same size) specifying the startinglocation of the particles to traceCME 292: Advanced MATLAB for SCLecture 2
Graphics HandlesAdvanced PlottingMATLAB File ExchangePublication-Quality GraphicsAnimation2D PlottingGrid DataScalars over AreasVector FieldsScalars over VolumesVectors over VolumesAssignmentDefine s linspace(0,2*pi,100)Plot f (x, y) sin(xy) for x, y [0, 2π] using any contour functionMake sure there are contour lines at[ 1.0, 0.75, 0.5, 0.25, 0, 0.25, 0.5, 0.75, 1.0]Use any colormap except jet (the default)autumn, bone, colorcube, cool, copper, flag, gray, hot,hsv, jet, lines, pink, prism, spring, summer, white, winterUse a colorbarNumerically compute f (x, y) as [Fx,Fy] gradient(F)Make a quiver plot of f (x, y)Plot streamline of f (x, y) vector field, beginning at the point (2, 2)CME 292: Advanced MATLAB for SCLecture 2
Graphics HandlesAdvanced PlottingMATLAB File ExchangePublication-Quality GraphicsAnimation2D PlottingGrid DataScalars over AreasVector FieldsScalars over VolumesVectors over VolumesVolume Visualization - Scalar DataVisualize scalar-valued function of two or three variables f (x, y, z) isosurfacesliceDescriptionDraw contours in volume slice planesSimple function of three variablesCompute isosurface end-cap geometryCompute isosurface and patch colorsCompute normals of isosurfaceverticesExtract isosurface data from volumedataVolumetric slice plotCME 292: Advanced MATLAB for SCLecture 2
2D PlottingGrid DataScalars over AreasVector FieldsScalars over VolumesVectors over VolumesGraphics HandlesAdvanced PlottingMATLAB File ExchangePublication-Quality GraphicsAnimationVolume Visualization - Scalar DataVisualize scalar data defined over a volume.33221100 1 1 2 2 3 3 3 3 2 2 1 1002146200214628310(a) contourslice8310(b) sliceCME 292: Advanced MATLAB for SCLecture 2(c) isosurface
2D PlottingGrid DataScalars over AreasVector FieldsScalars over VolumesVectors over VolumesGraphics HandlesAdvanced PlottingMATLAB File ExchangePublication-Quality GraphicsAnimationSlice-type plots3210 1 2 3 3 2 100214628310Figure : sliceCME 292: Advanced MATLAB for SCLecture 2
Graphics HandlesAdvanced PlottingMATLAB File ExchangePublication-Quality GraphicsAnimation2D PlottingGrid DataScalars over AreasVector FieldsScalars over VolumesVectors over VolumesSlice-type plotsslice, contourslice, streamsliceRelevant for scalar- or vector-valued volume functions (f (x, y, z) orF(x, y, z))Plot information in planar slices of the volumetric domainhan slice(X,Y,Z,F,Sx,Sy,Sz)X, Y, Z - grid generated by meshgridF F(X,Y,Z)Sx, Sy, Sz vectors specifying location of slice planes in the y z, x z,and x y planeshan slice(X,Y,Z,F,XI,YI,ZI)XI, YI, ZI define surface (i.e. that could be plotted with surf) on whichto plot FCME 292: Advanced MATLAB for SCLecture 2
Graphics HandlesAdvanced PlottingMATLAB File ExchangePublication-Quality GraphicsAnimation2D PlottingGrid DataScalars over AreasVector FieldsScalars over VolumesVectors over VolumesVolume Visualization - Vector DataVisualize vector-valued function of three variables F(x, y, z) R3Commandconeplotinterpstreamspeedstream2, slicestreamtubeDescriptionPlot velocity vectors as coneInterpolate stream-line vertices fromflow speedCompute 2D, 3D streamline dataPlot streamlines of 2D, 3D vector dataPlot stream particles3D stream ribbon plotPlot streamlines in slice planesCreate 3D stream tube plotCME 292: Advanced MATLAB for SCLecture 2
Graphics HandlesAdvanced PlottingMATLAB File ExchangePublication-Quality GraphicsAnimation2D PlottingGrid DataScalars over AreasVector FieldsScalars over VolumesVectors over VolumesVolume Visualization - Vector DataVisualize vector data defined over a volume.504540 5353052510201520152530103554045(b) streamtube(a) coneplotCME 292: Advanced MATLAB for SCLecture 2(c) streamslice
Graphics HandlesAdvanced PlottingMATLAB File ExchangePublication-Quality GraphicsAnimation2D PlottingGrid DataScalars over AreasVector FieldsScalars over VolumesVectors over VolumesPolygonsCommandfill, fill3patchsurf2patchDescriptionFill 2D, 3D polygonCreate filled polygonsConvert surface data to patch dataPatch graphics objectCore graphics objectPatch PropertiesCME 292: Advanced MATLAB for SCLecture 2
Graphics HandlesAdvanced PlottingMATLAB File ExchangePublication-Quality GraphicsAnimation2D PlottingGrid DataScalars over AreasVector FieldsScalars over VolumesVectors over VolumesPolygonsh fill(X,Y,C)h fill3(X,Y,Z,C)h patch(X,Y,Z,C)For m n matrices X, Y, Z draws n polygons with vertices defined by eachcolumnColor of each patch determined by CIf C is a string ('r','w','y','b','k',.), all polygons filled withspecified colorIf C is a 1 n vector, each polygon face is flat colored by C(j)If C is a 1 n 3 matrix, each polygon face colored by RGB valueIf C is a m n 3 matrix, each vertex colored by RGB value and facecolor determined by interpolationCME 292: Advanced MATLAB for SCLecture 2
Graphics HandlesAdvanced PlottingMATLAB File ExchangePublication-Quality GraphicsAnimationOutline1Graphics Handles2Advanced Plotting2D PlottingGrid DataScalars over AreasVector FieldsScalars over VolumesVectors over Volumes3MATLAB File Exchange4Publication-Quality Graphics5AnimationCME 292: Advanced MATLAB for SCLecture 2
Graphics HandlesAdvanced PlottingMATLAB File ExchangePublication-Quality GraphicsAnimationMATLAB File ExchangeThe MATLAB File Exchange is a very useful forum for find solutions tomany MATLAB-related problems3D VisualizationData AnalysisData Import/ExportDesktop Tools and Develepment EnvironmentExternal InterfacesGUI DevelopmentGraphicsMathematicsObject-Oriented ProgrammingProgramming and Data TypesCME 292: Advanced MATLAB for SCLecture 2
Graphics HandlesAdvanced PlottingMATLAB File ExchangePublication-Quality GraphicsA
Advanced Plotting MATLAB File Exchange Publication-Quality Graphics Animation pack packfrees up needed space by reorganizing information so that it only uses the minimum memory required. All variables from your base and global workspaces are preserved. Any persistent variables that are d