Transcription
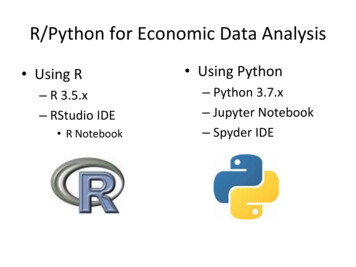
R/Python for Economic Data Analysis Using R– R 3.5.x– RStudio IDE R Notebook Using Python– Python 3.7.x– Jupyter Notebook– Spyder IDE
Introduction to Python Installation– Anaconda– Miniconda (Python only) Jupyter Notebook Spyder IDE– Essential Libraries Numpy, Matplotlib, PyLib, , Pandas, Statsmodels, Scikit-LearnTime Series Data Analysis Using R2
Introduction to Python Reference– William McKinney, Python for Data Analysis– Kevin Sheppard, Python for Econometrics, 2017.– Thomas J. Sargent and John Stachurski, Lectures inQuantitative Economics, 2017.Time Series Data Analysis Using R3
Introduction to R Installation– R-Projects (CRAN)– Rstudio– Useful Packages– AER, MASS, lmtest, maxLik, gmm, systemfit– plm, glmnet, caret, Time Series Data Analysis Using R4
Economic Data Analysis Using R Introduction to R– Getting Started– Using RStudio IDE– R Basics ceR eBook Project: R/Python for Econometric Analysis by Example(WIP, 2019) Economic Data– Cross Sections– Time Series– Panel DataEconomic Data Analysis Using R6
Economic Data Data Generating Process (DGP)– Economic Theory– Probability DistributionEconomic Data Analysis Using R7
Economic Data Data Structure Data Size– Cross Sections– Time Series– Panel Data Random Experiments– High FrequencyFinancial Data– Massive Datasets(Big Data)Economic Data Analysis Using R Government andCompany Data Internet Search andScan Data High DimensionalData8
Economic Data High Frequency Financial Data– Stock Market Daily Time Series– S&P 500, VIX (Fear Index), China SSEC– Exchange Rates– Ticker Data Apple Co. (AAPL) Tesla Motors, Inc. (TSLA) Economic Data Analysis Using R9
Economic Data Useful On Line Data Resources– Quandl– quantmod– Kaggle Datasets– Google Public Data– Amazon AWS Public Data– Intraday Stock Quotes– Economic Data Analysis Using R10
Economic Data Analysis Data Preparation– Getting Data– Tidying Data Data Visualization– Using Graphs Data Analysis– Regression– ClassificationEconomic Data Analysis Using R11
Data Preparation Using R Getting Data– Using R: read.table(), read.csv(), read.dta(), read excel() Tidying Data– Structuring datasets to facilitate visualization and analysis: Each variable forms a column; Each observation forms arow; Each type of observational unit forms a table.– Variable Transformation– Using R: reshape(), subset(), order(), transform(),aggregate() Using package tidyverseEconomic Data Analysis Using R12
Data Visualization Using R Simple Graphs– Scatter, Line, Bar, and Box Plots– Histogram and Distribution Using ggplot2 Package– Grammar of Graphics (Part1, Part2) References– Data Visualization with ggplot2Economic Data Analysis Using R13
R Package ggplot2: qplot qplot(data, x, y, , geom( )) – Data Frame– Aesthetics: x, y, alpha, color, size, shape, fill, – Geometry: point, line, bar, jitter, boxplot,histogram, density, smooth, Adding facets– facet gridEconomic Data Analysis Using R14
R Package ggplot2: ggplot ggplot(data, aes(x,y, ), geom .) – Data– Aesthetics– Geometry– Stats, Facets– Scales, Colors, Coordinates– Labels, Legends– ThemesEconomic Data Analysis Using R15
Data Analysis Descriptive StatisticsCorrelation and CovarianceAnalysis of Variances (AOV, ANOVA)Hypothesis Testing– DGP Non IID– One-Variable Testing (t-test)– Two-Variable Testing (paired t-test)Economic Data Analysis Using R16
Data Analysis Cross Sections Data– Hypothesis Testing Normality Independence Homoscedasticity– Linear Regression Least Squares Regression Maximum Likelihood– Regression DiagonsticsEconomic Data Analysis Using R17
Data Analysis Time Series Data– Hypothesis Testing Durbin-Watson Box-Pierce / Ljung-Box ACF/PACF– Transformation: Lag, Difference– Model Estimation– ForecastingEconomic Data Analysis Using R18
Data Analysis Panel Data– Hypothesis Testing Unobserved Hetrogeneity Time Series Correlation Spatial Correlation– Model Estimation Fixed Effects Random Effects– Multilevel AnalysisEconomic Data Analysis Using R19
Example: Big Mac Price Index The Big Mac price index was invented by TheEconomist in 1986 as a lighthearted guide towhether currencies are at their “correct” level.It is based on the theory of purchasing-powerparity (PPP), the notion that in the long runexchange rates should move towards the ratethat would equalize the prices of an identicalbasket of goods and services (in this case, aburger) in any two countries. Data Source: The Economist-GitHubEconomic Data Analysis Using R20
Big Mac Price Index Cross Sectional Data– Find the latest data (January 2019) over 57countries– Read the data (from Excel spreadsheet)– Summarize the dataEconomic Data Analysis Using R21
Big Mac Price Index Time Series Data– Find the data for US, from 1986 to the latest year,irregularly unequal-spaced time series– Find the data for China, from 1996 to the latestyear.– Read the data (from multiple Excel spreadsheets)– Summarize and compare– Time series analysisEconomic Data Analysis Using R22
Big Mac Price Index Panel Data– Find the data for all available countries, from allavailable years until the latest year, unequalspaced time series and unbalanced panels– Read the data (from multiple Excel spreadsheets)– Summarize the data– Panel data analysisEconomic Data Analysis Using R23
Introduction to Python Reference –William McKinney, Python for Data Analysis –Kevin Sheppard, Python for Econometrics,