Transcription
Introduction to Algorithmic Trading StrategiesLecture 1Overview of Algorithmic TradingHaksun .com
OutlineDefinitionsIT requirementsBack testingScientific trading models 2
Lecturer ProfileDr. Haksun LiCEO, Numerical Method Inc.(Ex-) Adjunct Professors, Advisor with the NationalUniversity of Singapore, Nanyang TechnologicalUniversity, Fudan University, etc.Quantitative Trader/Analyst, BNPP, UBSPhD, Computer Sci, University of Michigan Ann ArborM.S., Financial Mathematics, University of ChicagoB.S., Mathematics, University of Chicago 3
Numerical Method Incorporated LimitedA consulting firm in mathematical modeling, esp.quantitative trading or wealth managementProducts: SuanShuAlgoQuantCustomers: 4brokerage houses and funds all over the worldmultinational corporationsvery high net worth individualsgambling groupsacademic institutions
OverviewQuantitative trading is the systematic execution oftrading orders decided by quantitative market models.It is an arms race to build 5more reliable and faster execution platforms (computersciences)more comprehensive and accurate prediction models(mathematics)
Market MakingQuote to the market. Ensure that the portfolios respect certainrisk limits, e.g., delta, position. Money comes mainly from client flow, e.g.,bid-ask spread. Risk: market moves against your positionholding. 6
Statistical ArbitrageBet on the market direction, e.g., whether the pricewill go up or down.Look for repeatable patterns.Money comes from winning trades. Risk: market moves against your positionholding (guesses). 7
PrerequisiteBuild or buy a trading infrastructure. many vendors for Gateways, APIsReuters TibcoCollect data, e.g., timestamps, order book history,numbers, events. Reuters, EBS, TAQ, Option Metrics (implied vol),Clean and store the data. 8flat file, HDF5, Vhayu, KDB, One Tick (from GS)
Trading InfrastructureGateways to the exchanges and ECNs. ION, ECN specific APIAggregated pricesCommunication network for broadcasting andreceiving information about, e.g., order book, eventsand order status.API: the interfaces between various components, e.g.,strategy and database, strategy and broker, strategyand exchange, etc. 9
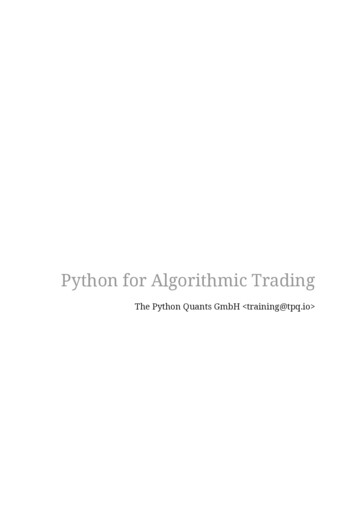
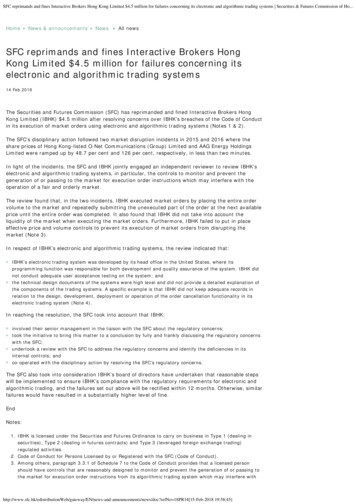
STP Trading Architecture Exampleexisting systeExchanges/ECNsxchanges,., emClearancAdapter ProtocolAlgoTradingSystemUnified Trade FeedAdapter,CSTPTrading SystemAdapterBooking SystemAdapterClearanceAdapterFIXMain Communication BusMarketDataRMB YieldCurvesTrade DataDatabase10 Centralized Database FarmRiskManagementCredit Limit
The Ideal 4-Step Research ProcessHypothesis Start with a market insightModeling Translate the insight in English into mathematics in GreekModel validation BacktestingAnalysis 11Understand why the model is working or not
The Realistic Research Process Clean dataAlign time stampsRead Gigabytes of data Extract relevant information PE, BMHandle missing dataIncorporate events, news and announcementsCode up the quant. strategyCode up the simulation Retuers’ EURUSD, tick-by-tick, is 1G/dayBid-ask spreadSlippageExecution assumptionsWait a very long time for the simulation tocompleteRecalibrate parameters and simulate againWait a very long time for the simulation tocompleteRecalibrate parameters and simulate againWait a very long time for the simulation tocomplete12 DebugDebug againDebug moreDebug even moreDebug patientlyDebug impatientlyDebug frustratinglyDebug furiouslyGive upStart to trade
Research Tools – Very Primitive ExcelMatlab/R/other scripting languages MetaTrader/Trade StationRTS/other automated trading systems 13
Matlab/R They are very slow. These scripting languages areinterpreted line-by-line. They are not built for parallelcomputing.They do not handle a lot of data well. How do youhandle two year worth of EUR/USD tick by tick data inMatlab/R?There is no modern software engineering tools builtfor Matlab/R. How do you know your code is correct?The code cannot be debugged easily. Ok. Matlabcomes with a toy debugger somewhat better than gdb.It does not compare to NetBeans, Eclipse or IntelliJIDEA.
R/scripting languages Advantages Most people already know it. There are more people who know Java/C#/C /C thanMatlab, R, etc., combined.It has a huge collection of math functions for mathmodeling and analysis. 15Math libraries are also available in SuanShu (Java), Nmath(C#), Boost (C ), and Netlib (C).
R Disadvantages TOO MANY!16
Some R Disadvantages Way too slow Limited memory No usage, rename, auto import, auto-completionPrimitive debugging tools Cannot calibrate/simulate a strategy in many scenarios in parallelInconvenient editing How to read and process gigabytes of tick-by-tick dataLimited parallelization Must interpret the code line-by-lineNo conditional breakpoint, disable, thread switch and resumeObsolete C-like language 17No interface, inheritance; how to define 𝑓 𝑥 ?
R’s Biggest Disadvantage You cannot be sure your code is right!18
Productivity19
Free the Trader!debuggingprogrammingcalibratingdata extractingdata cleaningwaitingbacktesting20
Industrial-Academic Collaboration Where do the building blocks of ideas come from? 21Portfolio optimization from Prof. LaiPairs trading model from Prof. ElliottOptimal trend following from Prof. DaiMoving average crossover from Prof. SatchellMany more
Backtesting Backtesting simulates a strategy (model) usinghistorical or fake (controlled) data.It gives an idea of how a strategy would work in thepast. It gives an objective way to measure strategyperformance.It generates data and statistics that allow furtheranalysis, investigation and refinement. It does not tell whether it will work in the future.e.g., winning and losing trades, returns distributionIt helps choose take-profit and stoploss.22
A Good Backtester (1) allow easy strategy programmingallow plug-and-play multiple strategiessimulate using historical datasimulate using fake, artificial dataallow controlled experiments 23e.g., bid/ask, execution assumptions, news
A Good Backtester (2) generate standard and user customized statisticshave information other than prices e.g., macro data, news and announcementsAuto calibrationSensitivity analysisQuick24
Iterative Refinement Backtesting generates a large amount of statistics anddata for model analysis.We may improve the model by 25regress the winning/losing trades with factorsidentify, delete/add (in)significant factorscheck serial correlation among returnscheck model correlationsthe list goes on and on
Some Performance Statistics pnlmean, stdev, corrSharpe ratioconfidence intervalsmax drawdownbreakeven ratiobiggest winner/loserbreakeven bid/askslippage26
Omega𝑏𝐿1 𝐹 𝑥 𝑑𝑥Ω 𝐿 The higher the ratio; the better.This is the ratio of the probability of having a gain tothe probability of having a loss.Do not assume normality.Use the whole returns distribution. 27𝑏𝐿𝐹 𝑥 𝑑𝑥 𝐶 𝐿𝑃 𝐿
Bootstrapping We observe only one history.What if the world had evolve different?Simulate “similar” histories to get confidence interval.White's reality check (White, H. 2000).28
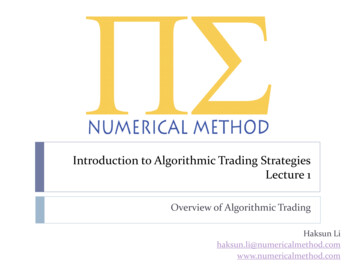
Calibration Most strategies require calibration to updateparameters for the current trading regime.Occam’s razor: the fewer parameters the better.For strategies that take parameters from the Real line:Nelder-Mead, BFGSFor strategies that take integers: Mixed-integer nonlinear programming (branch-and-bound, outerapproximation)29
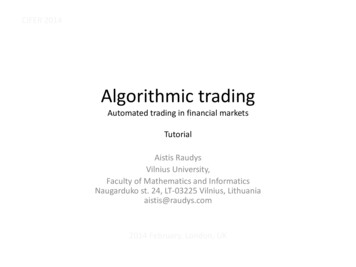
Global Optimization Methodsf
Sensitivity How much does the performance change for a smallchange in parameters?Avoid the optimized parameters merely beingstatistical artifacts.A plot of measure vs. d(parameter) is a good visual aidto determine robustness.We look for plateaus.31
Summary Algo trading is a rare field in quantitative financewhere computer sciences is at least as important asmathematics, if not more.Algo trading is a very competitive field in whichtechnology is a decisive factor.32
Scientific Trading Models Scientific trading models are supported by logicalarguments. 33can list out assumptionscan quantify models from assumptionscan deduce properties from modelscan test propertiescan do iterative improvements
Superstition Many “quantitative” models are just superstitionssupported by fallacies and wishful-thinking.34
Let’s Play a Game
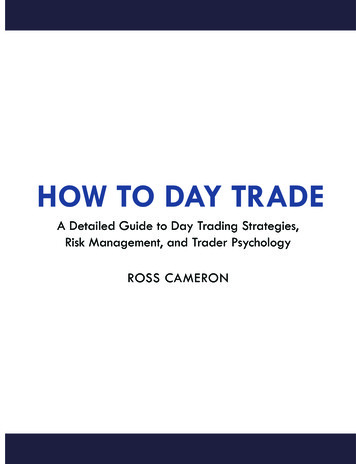
Impostor Quant. Trader Decide that this is a bull marketby drawing a line by (spurious) linear regression Conclude thatthe slope is positive the t-stat is significant LongTake profit at 2 upper sigmasStop-loss at 2 lower sigmas
Reality r rnorm(100)px cumsum(r)plot(px, type 'l')
Mistakes Data snoopingInappropriate use of mathematics assumptions of linear regression Ad-hoc take profit and stop-loss linearityhomoscedasticityindependencenormalitywhy 2?How do you know when the model is invalidated?
Extensions of a Wrong Model Some traders elaborate on this idea by using a moving calibration window (e.g., Bands)using various sorts of moving averages (e.g., MA, WMA,EWMA)
Fake Quantitative Models Data snoopingMisuse of mathematicsAssumptions cannot be quantifiedNo model validation against the current regimeAd-hoc take profit and stop-loss why 2?How do you know when the model is invalidated?Cannot explain winning and losing tradesCannot be analyzed (systematically)40
A Scientific Approach Start with a market insight (hypothesis) Translate English into mathematics hopefully without peeking at the datawrite down the idea in math formulaeIn-sample calibration; out-sample backtestingUnderstand why the model is working or not 41in terms of model parameterse.g., unstable parameters, small p-values
MANY Mathematical Tools Available Markov modelco-integrationstationarityhypothesis testingbootstrappingsignal processing, e.g., Kalman filterreturns distribution after news/shockstime series modelingThe list goes on and on 42
A Sample Trading Idea When the price trends up, we buy.When the price trends down, we sell.
What is a Trend?
An Upward Trend More positive returns than negative ones.Positive returns are persistent.
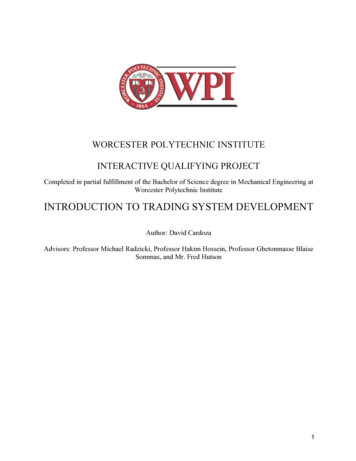
Knight-Satchell-Tran 𝑍𝑡1-qqZt 0DOWNTRENDZt 1UP TREND1-pp
Knight-Satchell-Tran Process 𝑅𝑡 𝜇𝑙 𝑍𝑡 𝜀𝑡 1 𝑍𝑡 𝛿𝑡 𝜇𝑙 : long term mean of returns, e.g., 0𝜀𝑡 , 𝛿𝑡 : positive and negative shocks, non-negative, i.i.d𝑓𝜀 𝑥 𝑓𝛿 𝑥 𝜆1 𝛼1 𝑥 𝛼1 1 𝜆 𝑥𝑒 1Γ 𝛼1𝜆2 𝛼2 𝑥 𝛼2 1 𝜆 𝑥𝑒 2Γ 𝛼2
What Signal Do We Use? Let’s try Moving Average Crossover.
Moving Average Crossover Two moving averages: slow (𝑛) and fast (𝑚).Monitor the crossovers.1𝑚𝑚 1𝑗 0 𝑃𝑡 𝑗 𝐵𝑡 Long when 𝐵𝑡 0.Short when 𝐵𝑡 0. 1𝑛𝑛 1𝑗 0 𝑃𝑡 𝑗,𝑛 𝑚
How to choose 𝑛 and 𝑚? For most traders, it is an art (guess), not a science.Let’s make our life easier by fixing 𝑚 1. Why?
What is 𝑛? 𝑛 2𝑛
Expected P&L GMA(2,1) E 𝑅𝑅𝑇 11 𝑝Π𝑝𝜇𝜀 1 𝑝 𝜇𝛿GMA( ) E 𝑅𝑅𝑇 1 𝑝 1 Π𝜇𝜀 𝜇𝛿
Model Benefits (1) It makes “predictions” about which regime we are nowin.We quantify how useful the model is by 53the parameter sensitivitythe duration we stay in each regimethe state differentiation power
Model Benefits (2) We can explain winning and losing trades. We can deduce the model properties. Is it because of calibration?Is it because of state prediction?Are 3 states sufficient?prediction variance?We can justify take profit and stoploss based on traderutility function.54
Limitations Assumptions are not realistic. Classical example: Markowitz portfolio j2eewar/faces/webdemo/markowitz.xhtmlRegime change.IT problems.Bad luck! 55Variance
Markowitz’s Portfolio Selection For a portfolio of m assets: expected returns of asset i μ𝑖weight of asset i 𝑤𝑖 such that𝑚𝑖 𝑤𝑖 1Given a target return of the portfolio μ , the optimalweighting 𝑤𝑒𝑓𝑓 is given by𝑤𝑒𝑓𝑓 arg min 𝑤 𝑇 Σ𝑤 subject to 𝑤 𝑇 𝜇 𝜇 , 𝑤 𝑇 1 1, 𝑤 0𝑤56
Stochastic Optimization Approach Consider the more fundamental problem: Given the past returns 𝑟1 , , 𝑟𝑛max{𝐸 𝑤 𝑇 𝑟𝑛 1 𝜆𝑉𝑎𝑟 𝑤 𝑇 𝑟𝑛 1 }λ is regarded as a risk-aversion index (user input)Instead, solve an equivalent stochastic optimizationproblemmax{𝐸[𝑤 𝑇 𝜂 𝑟𝑛 1 𝜆𝑉𝑎𝑟 𝑤 𝑇 𝜂 𝑟𝑛 1 }𝑛where𝑤 𝜂 arg min{𝜆𝐸 𝑤 𝑇 𝑟𝑛 1𝑤2 𝜂𝐸(𝑤 𝑇 𝑟𝑛 1 )}and𝜂 1 2𝜆𝐸(𝑊𝐵 )57
Mean-Variance Portfolio Optimization when Meansand Covariances are Unknown
Summary Market understanding gives you an intuition to atrading strategy.Mathematics is the tool that makes your intuitionconcrete and precise.Programming is the skill that turns ideas andequations into reality.59
AlgoQuant Demo60
Most strategies require calibration to update parameters for the current trading regime. Occam’s razor: the fewer parameters the better. For strategies that take parameters from the Real line: Nelder-Mead, BFGS For strategies that take integers: Mixed-integer non-line