Transcription
Monica F. HarnotoLCA Compostable and Reusable ClamshellsSpring 2013A Comparative Life Cycle Assessment of Compostable and Reusable TakeoutClamshells at the University of California, BerkeleyMonica F. HarnotoABSTRACTCompostable and reusable products create environmental footprints in different impactcategories. While both products theoretically reduce waste, their disparate life cycles incurdifferent trade-offs. Consequently, it is often difficult to directly evaluate these products andselect the most sustainable option. One example of this situation is compostable and reusabletakeout clamshells. My research question attempts to discover which type of container,compostable bagasse or reusable polypropylene, is more sustainable for Cal Dining at theUniversity of California, Berkeley. To evaluate sustainability, I looked at four impact categories:greenhouse gas contribution, energy consumption, material waste, and water consumption. Myresults showed that reusable containers require 15 uses to equal the greenhouse gas contribution,energy consumption, and material waste impact of the equivalent number of compostableclamshells. However, the water consumption for reusable clamshells remained greater than thecompostable clamshells in all situations. I concluded that Cal Dining should use reusableclamshells over compostable clamshells.KEYWORDSCal Dining, sustainability, bagasse containers, polypropylene containers, to-go1
Monica F. HarnotoLCA Compostable and Reusable ClamshellsSpring 2013INTRODUCTIONThe United States generates more garbage than any other nation in the world (Hoornwegand Bhada-Tata 2012). In 2010, the U.S. produced 230 million Mg of municipal solid waste(MSW), amounting to a national waste production average of 2.01 kg/person/day (EPA 2011).This daily per capita rate is nearly 70% more than the international average of 1.2 kg/person/day(Hoornweg and Bhada-Tata 2012). Moreover, trends suggest that the U.S. will produce moregarbage in the future given a growing population (U.S. Census Bureau 2012) and increasing percapita waste generation (Hoornweg and Bhada-Tata 2012). Without creative solutions to reducegarbage production, the issues already present in America’s waste disposal system willundoubtedly worsen.Effective solutions will have to cope with the heterogeneous nature of waste. With acumulative mass of 28 million Mg, plastic accounts for 12.4% of MSW (EPA 2011). The“plastic” category encompasses different types and sources of plastic (EPA 2011). Items such aspolyethylene grocery bags find themselves classified along with polyethylene terephthalate waterbottles. Because these plastics originate from a variety of sources, it seems impractical to expecta single solution for global plastic waste production. Instead, effective waste reduction initiativesmust begin on a more local level.The University of California, Berkeley is one of the many institutions committed toimproving the environmental impact of its waste stream at the local level. In 2009, the Office ofthe President set a campus-wide goal to achieve zero waste by 2020 (Birgeneau 2009). Sincethen, U.C. Berkeley faculty, staff, and students have collaborated on countless initiatives to reachthis milestone. One of the most recent efforts involved a reassessment of takeout options at CalDining, the campus’s main foodservice provider.Cal Dining began exploring alternatives to conventional takeout clamshells in response togrowing consumer demand (Cal Dining 2012a). In 2005, Cal Dining replaced their Styrofoam(polystyrene) containers with clamshells made from bagasse, the fibrous plant material leftoverfrom sugarcane production (Cal Dining 2012a). Currently, Cal Dining uses 3-compartmentcompostable clamshells from IFN Green (Chacko 2012, Table 1). Compostable clamshellsmaintain the convenience of single-use packaging, while also allowing for responsible disposal.All clamshells, regardless of composition, follow a similar life cycle: procurement of raw2
Monica F. HarnotoLCA Compostable and Reusable ClamshellsSpring 2013materials, refining of media and production of containers, distribution, consumption, anddisposal (Madival et. al 2009). The main difference between compostable and Styrofoamclamshell life cycles occurs at the disposal phase. Compostable containers have the ability todegrade into fertilizer that can grow additional plants. In contrast, Styrofoam clamshells have nosignificant means for repurposing and most end their lives in a landfill. The lack of a closed-loopcycle for single-use Styrofoam clamshells makes this process inherently unsustainable.In Fall 2012, I proposed a reusable takeout clamshell pilot program as an alternative tothe single-use compostable clamshell program for Cal Dining. “Chews to Reuse” ran from 20August 2012 to 14 December 2012 in Foothill dining commons. The pilot program used G.E.T.Enterprises’ 100% polypropylene clamshells (Table 2). Customers paid 3 meal points ( 3),received a clamshell, and took their meal to-go. Once they decided to take their next to-go meal,they brought their containers back, deposited it in the designated bin, and received a sanitizedcontainer in return. Cal Dining staff periodically wheeled soiled clamshells into the dish room torun through the dishwasher and air dry on a rack. Once they dried, they were restocked by thecash register and the cycle continued.Table 1. Compostable clamshell profile.Characteristics of IFN Green’s compostabletakeout clamshell listed below. Full volumerefers to the approximate volume when itreaches the consumer, and flattened volumerefers to the approximate volume once theclamshell has been s0.229 m x 0.229 m x 0.0762 mFull volume0.00398 m3Flattened volume0.000664 m3Mass0.0434 kgParameterMaterialDimensionpolypropyleneTable 2. Reusable clamshell profile.Characteristics of G.E.T. Enterprisesreusable takeout clamshell listed below.3
Monica F. HarnotoLCA Compostable and Reusable ClamshellsSpring 2013Dimensions0.229 m x 0.229 m x 0.0889 mFull volume0.00465 m3Mass0.263 kgReusable clamshells have the potential to minimizethe environmental impact of clamshell manufacturing, sinceCal Dining would need a smaller number of clamshells for thesameutility as a single-use option. While it is possible to recycle plastics,the type and quality of plastic changes each time it is recycled (Wansbrough 2008).Consequently, recycled plastic cannot be used to create another reusable container (Wansbrough2008). Despite these trade-offs, both reusable and compostable containers appear to be moresustainable than single-use Styrofoam containers. But, when compared to each other, thedecision is not obvious. Compostable and reusable clamshells both have ecological advantagesand disadvantages in different impact categories, and with different magnitudes. Currently, therehave been no studies looking at the comparative environmental impacts of compostable andreusable takeout clamshells. Without this information, both suppliers and consumers may find itdifficult to ensure the sustainability of their food packaging.GOAL AND SCOPE DEFINITIONGoal of analysisGiven the multifaceted nature of the environmental impacts of compostable and reusableclamshells, the goal of my research is to answer the question: Is a reusable takeout clamshellprogram more sustainable than a compostable takeout clamshell program for Cal Dining? I willassess environmental impacts through four categories: (1) greenhouse gas contribution, (2)energy consumption, (3) solid waste, and (4) water consumption.Scope of analysisThe steps that define the compostable takeout clamshell life cycle include: (1) thesugarcane growth process, (2) transportation to processing mill, (3) fiberboard manufacturing,4
Monica F. HarnotoLCA Compostable and Reusable ClamshellsSpring 2013(4) fiberboard molding, (5) transportation to Cal Dining, (6) transportation to landfill or compost,and (7) landfill or compost process. The steps that define the reusable takeout clamshell lifecycle include: (1) polypropylene production, (2) plastic injection molding, (3) transportation toCal Dining, (4) dishwashing at Cal Dining, (5) transportation to landfill or recycling, and (6)landfill or recycling process.METHODSI used Life Cycle Assessment (LCA) methodology to quantitatively compare theenvironmental impact of compostable and reusable takeout clamshells. LCA is a “cradle tograve” approach for assessing the ecological impacts of a product (Scientific ApplicationsInternational Corporation 2006). The LCA methodology consists of the following four parts:1. Goal Definition and Scoping: Define and describe the product and the context inwhich the assessment is to be made. Identify boundaries and environmental effectsunder review.2. Inventory Analysis: Quantify energy, water and materials usage, and environmentalreleases.3. Impact Assessment: Evaluate the potential human and ecological effects of thepreviously quantified factors.4. Interpretation: Use these results to select the preferred product with a clearunderstanding of the limitations of this methodology (Scientific ApplicationsInternational Corporation 2006).Life cycle assessment softwareI used GaBi 6 software, produced by PE International. GaBi is a LCA software thatallows its users to connect environmental impacts to a product across its lifespan. GaBi includesits own database containing life cycle inventories of processes such as polypropylenemanufacturing, transportation, and landfill disposal. The software also allows manual input ofcoefficients in order to customize outputs to reflect case-specific measurements.5
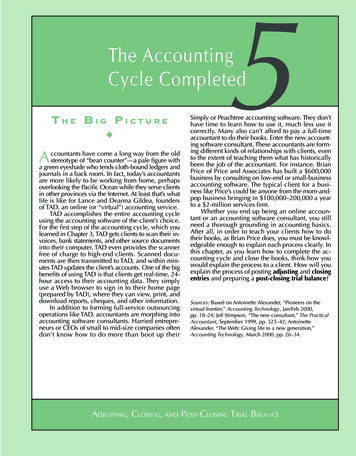
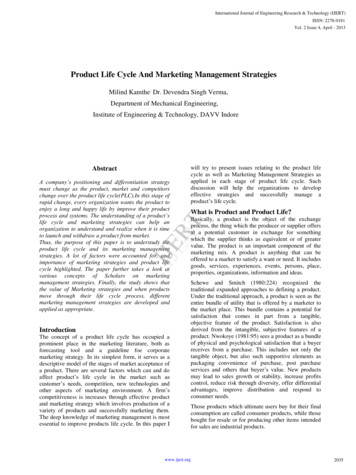
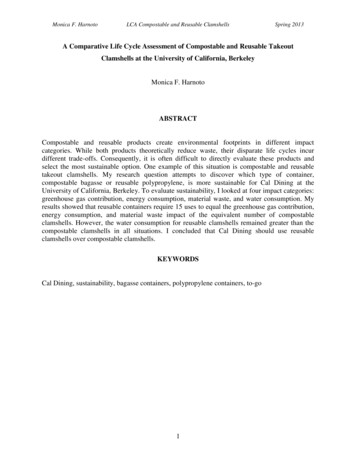
Monica F. HarnotoLCA Compostable and Reusable ClamshellsSpring 2013Life cycle definitionIn order to evaluate the environmental impact of reusable and compostable takeoutclamshells, I divided the life cycle of each container into four phases and defined parameters foreach phase. The phases include: raw materials acquisition, manufacturing, consumption, andend-of-life management. Transportation is included in the process that precedes it. For example,“raw materials extraction” includes the environmental impact of ocean freight transportationfrom the sugarcane plantation in Thailand to the processing mill in China. Through eachsubsection below, I outline the trajectory of both clamshells. Figure 1 and 2 give a conciseoverview of the life cycle, inputs, and locations of both containers, and Appendix A provides asummary of the GaBi 6 parameter adjustments made in the two models. I did not includepackaging in this life cycle assessment. Finally, I described the functional unit of my study anddiscussed the scenarios I used to analyze my data.Compostable takeout clamshellsRaw materials acquisition. The compostable takeout clamshells began their lives as sugarcaneplants in Thailand. Sugarcane is a perennial grass that can grow in varying climates (Marsolek2003) and has a rotation length of 12-18 months in tropical and sub-tropical regions (Liu andBull 2001). The crop yield of sugarcane plants is approximately 66,000 kg cane/hectare·year(Beeharry 2001). Bagasse accounts for roughly 30% of the sugarcane plant (Marsolek 2003).Raw bagasse consists of 49% moisture, 49% cellulose, pentosan, and lignin fibers, and 2%soluble solids (Chiparus 2004). After harvesting, the sugarcane underwent mechanicalprocessing to extract the sugar and molasses fractions, and then the remaining bagasse wasshipped 3,500 km via ocean freight to a processing mill in China (Jost 2013).Manufacturing. Once the bagasse reached China, the processing mill extracted the remainingmoisture and pressed the dried bagasse into fiberboard sheets (Marsolek 2003). I operated underthe assumption that the loss of material from raw bagasse to fiberboard sheets was immaterial(Marsolek 2003). After packaging, the manufacturer loaded the compostable clamshells onto a6
Monica F. HarnotoLCA Compostable and Reusable ClamshellsSpring 2013truck and drove them 499 km to the Yantian port where they were then shipped 11,100 km in anocean freight to the Port of Oakland (Jost 2013). From the Port of Oakland, the compostableclamshells were driven an additional 11.3 km to San Leandro, CA and then 24.1 km to ClarkKerr Campus dining commons in Berkeley, CA (Jost 2013).Consumption. I used Clark Kerr Campus (CKC) dining commons as my study site to analyzeinformation on the consumption phase of compostable takeout clamshells. CKC dining commonsserved as the main eatery for the 922 students living in CKC residential halls. Its relativelyisolated location near Piedmont Avenue and Dwight Way allowed me to assume that themajority of diners at CKC dining commons were also residents of CKC residential halls. In orderto approximate composting rates for the compostable takeout clamshells, I surveyed 1,340 L ofcompost and 2,038 L of trash over the course of four days to find a compostable clamshell perliter of compost or landfill ratio. For each bin I sorted through, I recorded the date, volume, andnumber of containers I found. I used this compostable clamshell/volume ratio to determine theoverall percentages of compostable clamshells ending in the compost and landfill. Onceconsumers disposed of their compostable clamshells, they traveled by truck to one of twoRecology Inc. composting facilities: 86 km to Jepson Prairie Organics or 119 km to GroverEnvironmental Products (King 2012). Since the compost went to both facilities, I used anaverage of 103 km as my travel distance.End-of-life management. Compostable clamshells that end in the compost underwent processesthat accelerated decomposition. These processes used energy expending machinery and water(Lundie and Peters 2005). I bounded my study with the formation of the fertilizer that resultedfrom the compost process. Compostable clamshells that ended in the landfill degraded at asignificantly slower rate without the moisture and heat. I calculated material waste based on thevolume of clamshells reaching the landfill. Because the compostable clamshells were pliable, Iused an average of the flattened clamshell and fully intact clamshell to calculate total materialwaste volume.7
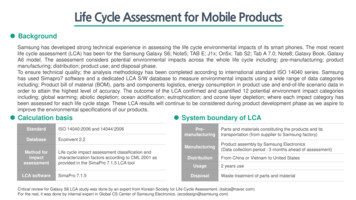
Figure 2. Reusable clamshell life cycle definition. The center progression charts the flow of polypropylene from initial production to end-of-lifemanagement. The boxes above show all inputs accounted for in this study. The dashed arrows below chart the changes in location throughout the clamshell’slife cycle. The larger blue boxes group processes within each of the four broader categories.Figure 1. Compostable clamshell life cycle definition. The center progression charts the flow of bagasse from initial cultivation to end-of-life management.The boxes above show all inputs accounted for in this study. The dashed arrows below chart the changes in location throughout the clamshell’s life cycle.The larger green boxes group processes within each of the four broader categories.Monica F. HarnotoLCA Compostable and Reusable Clamshells8Spring 2013
Monica F. HarnotoLCA Compostable and Reusable ClamshellsSpring 2013Reusable takeout clamshellsRaw materials acquisition. Reusable takeout clamshells began their lives with the formation ofpolypropylene (#5) plastic in China (Copeland 2009).Manufacturing. The polypropylene was injected into a mold to form the reusable clamshell(Copeland 2009). The manufacturers then packaged the reusable clamshells and shipped them10,100 km on an ocean freight to Long Beach, CA (Copeland 2009). From Long Beach, CA thereusable clamshells boarded a truck and traveled to the G.E.T. Enterprises central distributioncenter in Houston, TX (Copeland 2009). The reusable clamshells then switched trucks and droveto Foothill dining commons in Berkeley, CA.Consumption. I used Foothill dining commons as my study site to analyze information on theconsumption phase of compostable takeout clamshells. Foothill dining commons served as themain eatery for the 1283 students living in Foothill residential halls. Its relatively isolatedlocation near Hearst Avenue and Gayley Road allowed me to assume that the majority of dinersat Foothill dining commons were also residents of Foothill residential halls. Cashiers recordeddata on reusable clamshell purchases and returns on their registers. I also recorded the number ofbroken or cosmetically damaged reusable clamshells that patrons returned to Cal Dining. I usedboth sets of data to approximate the breakage rate for clamshells in circulation and a recyclingrate of broken and damaged reusable clamshells for the pilot program. For the breakage rate:# 𝑟𝑒𝑢𝑠𝑎𝑏𝑙𝑒 𝑐𝑙𝑎𝑚𝑠ℎ𝑒𝑙𝑙 𝑝𝑢𝑟𝑐ℎ𝑎𝑠𝑒𝑠 # 𝑐𝑙𝑎𝑚𝑠ℎ𝑒𝑙𝑙 𝑟𝑒𝑡𝑢𝑟𝑛𝑠 𝑓𝑜𝑟 𝑠𝑎𝑛𝑖𝑡𝑎𝑡𝑖𝑜𝑛# 𝑏𝑟𝑜𝑘𝑒𝑛 𝑐𝑙𝑎𝑚𝑠ℎ𝑒𝑙𝑙𝑠For the recycling rate:# 𝑟𝑒𝑢𝑠𝑎𝑏𝑙𝑒 𝑐𝑙𝑎𝑚𝑠ℎ𝑒𝑙𝑙𝑠 𝑠𝑒𝑛𝑡 𝑡𝑜 𝑊ℎ𝑜𝑙𝑒 𝐹𝑜𝑜𝑑𝑠# 𝑟𝑒𝑢𝑠𝑎𝑏𝑙𝑒 𝑐𝑙𝑎𝑚𝑠ℎ𝑒𝑙𝑙𝑠 𝑛𝑜𝑡 𝑟𝑒𝑡𝑢𝑟𝑛𝑒𝑑 𝑎𝑡 𝑡ℎ𝑒 𝑒𝑛𝑑 𝑜𝑓 𝑡ℎ𝑒 𝑠𝑒𝑚𝑒𝑠𝑡𝑒𝑟 # 𝑟𝑒𝑢𝑠𝑎𝑏𝑙𝑒 𝑐𝑙𝑎𝑚𝑠ℎ𝑒𝑙𝑙𝑠 𝑠𝑒𝑛𝑡 𝑡𝑜 𝑊ℎ𝑜𝑙𝑒 𝐹𝑜𝑜𝑑𝑠At the end of the program, I drove all damaged reusable clamshells 3.06 km to Whole Foods’Gimme 5, a polypropylene recycling partnership between Whole Foods and Preserve. Number9
Monica F. HarnotoLCA Compostable and Reusable ClamshellsSpring 2013five plastics from this program traveled on a truck 7,260 km to Cortland, NY for recycling at thePreserve facility (Preserve 2012).End-of-life management. Reusable clamshells that reached the recycling facility sustainedenergy and water intensive processes. Because polypropylene is manufactured to resistdegradation from consumer use, reusable clamshells take a significantly longer time to degradein landfills than in recycling facilities. I calculated material waste based on the volume ofreusable clamshells reaching the landfill.Functional unitComparing environmental impacts of compostable and reusable clamshells is difficultbecause of the nature of their consumption. For compostable clamshells, the variable is numberof clamshells used, whereas for reusable clamshells, the variable is number of uses. In order tocompare impact categories between containers, I chose the number of uses before breakage of 1reusable clamshell as my baseline unit, and selected the equivalent number of compostableclamshells for comparison. I analyzed my data using two scenarios, one that showcases themanufacturer’s intended use of both clamshells and one that examines parameters I discovered inthe reusable clamshell pilot and existing compostable clamshell program at Cal Dining. Theparameters for each case are as follows:Use by design 360 compostable clamshell vs. 1 reusable clamshell 1 use per compostable clamshell vs. 360 uses per reusable clamshell 100% composting rate vs. 100% recycling ratePilot 43 compostable clamshells vs. 1 reusable clamshell 1 use per compostable clamshell vs. 43 uses per reusable clamshell 25% composting rate, 75% landfill rate vs. 21% recycling rate, 79% landfill rate10
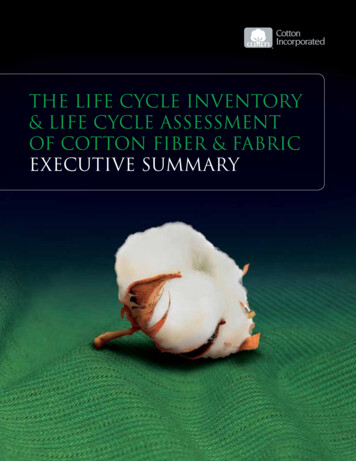
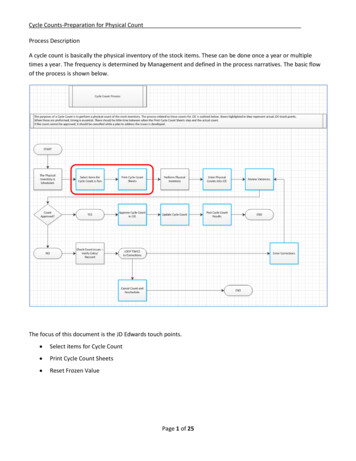
Monica F. HarnotoLCA Compostable and Reusable ClamshellsSpring 2013RESULTSThe relative environmental impacts of reusable and compostable takeout clamshellsdepended heavily on the number of uses each reusable takeout clamshell sustained beforereaching its end life. The impacts of both clamshells also varied greatly depending on recyclingand composting rates. I found that a reusable clamshell required 14 reuses before one clamshellgenerated the GHG emissions, energy, and material waste of an equivalent amount ofcompostable takeout clamshells. Consequently, a consumer that used 15 compostable takeoutclamshells would have a greater overall environmental impact in these three categories than aconsumer that uses a reusable clamshell 15 times. However, the water footprint for reusableclamshells remained greater than compostable clamshells under both scenarios.Greenhouse gas contributionI discovered that 5.5 compostable clamshells had the equivalent GHG emissions as a reusableclamshell that had been used 5.5 times. In the “use by design” scenario, 360 compostableclamshells used once embodied 85.5 kg CO2 and one reusable clamshell used 360 timesembodied 1.27 kg CO2 (Figure 2). In the pilot scenario, 43 compostable clamshells used onceembodied 10.2 kg CO2 and one reusable clamshell used 43 times embodied 1.49 kg CO2 (Figure2). The largest contributors to the GHG impact category for the compostable takeout clamshellincluded the raw materials acquisition and manufacturing which, combined, accounted for 73%of GHG emissions (Table 3). Despite the carbon dioxide sequestration from plant growth in theraw materials acquisition phase, the data shows a net GHG emission. The largest contributors forthe reusable clamshell also included raw materials acquisition and manufacturing, accounting for64% of GHG emissions (Table 3).11
Monica F. HarnotoLCA Compostable and Reusable ClamshellsSpring 2013Table 3. Summary of life cycle phase contribution to each impact category. According to the data I collected, Ifound the percent contribution of each life cycle phase to each impact category within each clamshell’s life cycle.Clamshell TypeImpact categoryLife cycle tion0%End-of-life management26%Raw materials ife management2%Raw materials fe management100%Raw materials life managementRaw End-of-life managementRaw nd-of-life managementRaw End-of-life managementRaw 9%End-of-life management1%GHGRaw materials acquisitionEnergyCompostableMaterial wasteWaterGHGEnergyReusableMaterial wasteWater1264%86%0%0%
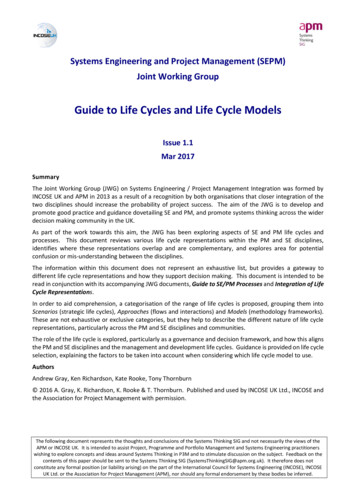
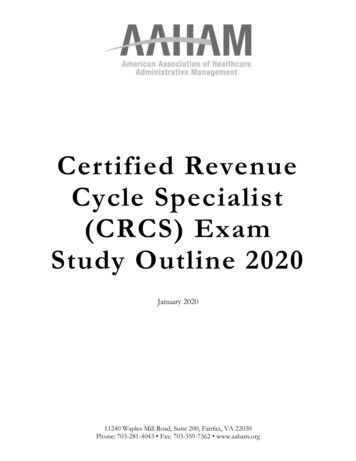
Monica F. Harnoto90LCA Compostable and Reusable ClamshellsSpring 201385.5Compostable Clamshells80Greenhouse Gas Contribution (kg CO2)Reusable Clamshells70605040302010.2101.491.270Use by DesignPilotFig. 2. Greenhouse gas contribution of reusable and compostable takeout clamshells. Bar chart compares theGHG contribution of compostable (light grey) and reusable (dark grey) takeout clamshells. Use by design scenariorefers to the GHG impact of 360 compostable clamshells and 1 reusable clamshell used 360 times before disposal.Pilot scenario refers to the GHG impact of 43 compostable clamshells and 1 reusable clamshell used 43 times.Energy consumptionIn order for the equivalent in compostable clamshells to exceed the embodied energy ofthe reusable clamshells, a patron must reuse the plastic container at least 14 times. 360compostable clamshells expended 846 MJ while 1 reusable clamshell used 360 times expended33.1 MJ (Fig.4). Additionally, 43 compostable clamshells expended 102 MJ while 1 reusableclamshell used 43 times expended 30.5 MJ (Fig. 4). Ninety six percent of energy expenditureoccurred during the manufacturing phase of the compostable clamshells, and 86% occurredduring raw material acquisition/manufacturing for reusable clamshells (Table 3).13
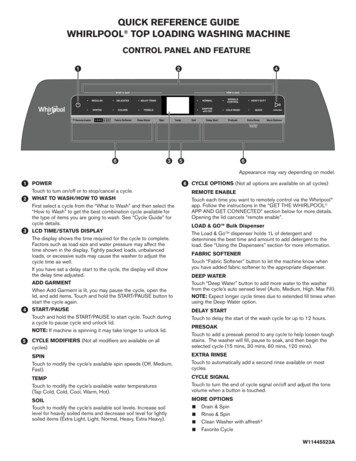
Monica F. Harnoto900LCA Compostable and Reusable ClamshellsSpring 2013846Compostable Clamshells800Reusable ClamshellsEnergy Consumption (MJ)70060050040030020010210033.130.50Use by DesignPilotFig. 4. Energy consumption of reusable and compostable takeout clamshells. Bar chart compares the energyconsumption of compostable (yellow) and reusable (brown) takeout clamshells. Use by design scenario refers to theenergy consumption of 360 compostable clamshells and 1 reusable clamshell used 360 times before disposal. Pilotscenario refers to the energy consumption of 43 compostable clamshells and 1 reusable clamshell used 43 times.Material wasteThe number of reuses necessary to create equal amounts of material waste between bothcontainer types varies with recycling and composting rates, as well as the total number ofcontainers used. Under use by design circumstances, all materials should have either beencomposted or recycled, leaving behind no material waste. However, under the pilot conditions,43 compostable clamshells create 0.1 m3 of waste and 1 reusable clamshell creates 0.00367 m3waste. The study assumed all material waste resulted from end-of-life management (Table 3).14
Monica F. HarnotoLCA Compostable and Reusable Clamshells0.080.07480.07Compostable ClamshellsReusable Clamshells0.06Material Waste (m3)Spring 20130.050.040.030.020.010.00367000Use by DesignPilotFig. 5. Material Waste of reusable and compostable takeout clamshells. Bar chart compares the material wasteof compostable (light brown) and reusable (dark brown) takeout clamshells. Use by design scenario refers to thematerial waste of 360 compostable clamshells and 1 reusable clamshell used 360 times before disposal. Pilotscenario refers to the material waste of 43 compostable clamshells and 1 reusable clamshell used 43 times.Water consumptionReusable clamshells always used more water than compostable clamshells. The higherthe usage rate, the higher the water foorprint of the reusable clamshells. 360 compostableclamshells needed 3,510 L of water throughout their life cycle, and 360 uses of 1 reusableclamshell needed 12,300 L of water. In the pilot scenario, 43 compostable clamshells consumed436 L of water and 1 reusable clamshell used 43 times consumed 1,460 L. Ninety six percent ofwater use in the life cycle of a compostable clamshell occured in raw material acquisition andmanufacturing phases. In contrast, 99% of water use in the life cycle of a reusable clamshelloccured in the consumption phase.15
Monica F. HarnotoLCA Compostable and Reusable ClamshellsSpring 201314000Compostable Clamshells1230012000Reusable ClamshellsWater Consumption (L)100008000600040003510200014604360Use by DesignPilotFig. 6. Water consumption of reusable and compostable takeout clamshells. Bar chart compares the waterconsumption of compostable (light blue) and reusable (dark blue) takeout clamshells. Use by design scenario refersto the water consumption of 360 compostable clamshells and 1 reusable clamshell used 360 times before disposal.Pilot scenario refers to the water consumption of 43 compostable clamshells and 1 reusable clamshell used 43 times.DISCUSSIONConventional environmental practices emphasize “reuse” over “recycle” (Broca 2008,Lewis et.al 2010). My research demonstrated similar patterns, but also exhibited a trade-offbetween the sustainability of reusable and compostable products. While the reusable clamshellsdemonstrated a lower environmental impact for both “use by design” and “pilot” scenarios, theyshowed a larger water footprint than compostable clamshells for both scenarios.Water trade-offBecause increased use of reusable clamshells further aggravates water expenditure, it isnot possible for reusable clamshells to use less water than compostable clamshells. However16
Monica F. HarnotoLCA Compostable and Reusable ClamshellsSpring 2013from an operational standpoint, this trade-off seems to occur within an easily adaptable impactcategory. Unlike GHG emissions or energy consumption whose impacts occur largely within theraw materials acquisition and manufacturing phases, the largest water footprint occurs within theconsumption phase. Therefore, Cal Dining can significantly improve the water footprint of thereusable containers through alterations in their water conservation practices. Discounting thewater category, practical application of a reusable clamshell system will produce an overallsmaller environmental impact than compostable clamshells, as long as the reusable clamshellsaverage at least 15 uses.Comparison to existing literatureMy LCA demonstrated similar GHG emissions, energy consumption, and solid wastepatterns to previous LCAs of reusable and compostable products. In a 2008 LCA comparingreusable and compostable plates, Mita Broca found that reusable plates created five times theenvironmental impact of compostable plates (Broca 2008). She also found that after 50 uses,reusable plates had an equal or smaller environmental impact than compostable plates. However,her study addressed water consumption in terms of acidification and eutrophication potential.Her findings, therefore, do not directly account for the water needed to wash the reusable plates.Similar patterns appear in a study published by Packaging Technology and Science concerningreusable and compostable grocery bags (Lewis et. al 2010). Again, after 50 uses, the reusablegrocery bags became environmentally preferable to compostable bags in all evaluated impactcategories. Bags do not require the same caliber of sanitation that food clamshells do. Therefore,the variance between water footprints of a reusable and compostable bags will not be as great asreusable and compostable clamshells.The results of my study relied heavily on the parameters provided in the consumptionphase. For example, the use by design scenario saw almost no material waste production whilethe pilot scenario modeled 0.0748 m3 in compostable waste and 0.00367 m3 in recyclable waste.This pattern of variable environmental impact according to user-specific behavior appearedprominently in another LCA on reusable and compostable coffee cups (Ligthart and Ansems2007). In their main conclusions, the authors asserted that the individual user had a directinfluence on the environmental impact of each type of cup. Therefore, more conscientious17
Monica F. HarnotoLCA Compostable and Reusable ClamshellsSpring 2013practices in relation to water use and conservation could translate to a lower environmental costin that impact category. This reduction in water use could build an even stronger case forreusable clamshells over compostable clamshells.LimitationsDue to the nature of my study, I relied heavily on information provided by themanufacturers of both reusable and compostable clamshells. Neither company had datacataloguing the environmental impacts produced during manufacture of the clamshells. My studyconsequently depended hea
Enterprises’ 100% polypropylene clamshells (Table 2). Customers paid 3 meal points ( 3), received a clamshell, and took their meal to-go. Once they decided to take their next to-go meal, they brought their containers back, deposited it in the desi