Transcription
Life Cycle Analysis of Electric VehiclesQuantifying the ImpactPrepared by: Balpreet Kukreja, UBC Sustainability Scholar, 2018Prepared for: Adrian Cheng, Equipment Services, City of VancouverAugust 2018
AcknowledgementsThe author would like to thank the following individuals for their contribution, feedback, andsupport throughout this project. Adrian Cheng, Equipment Services, City of Vancouver Evan Dacey, Equipment Services, City of Vancouverii
Table of ContentsExecutive Summary 1Introduction 2Why Life Cycle Analysis? 2Goal 3Scope 3Methodology 4Data Sourcing 4Life Cycle Inventory 5Raw Material Production 6Manufacturing 7Transportation 8Operation 9Decommissioning 9Summary 10Comparison of Results with Similar Analysis 11Sensitivity Analysis 12Future Use of Lithium-Ion Batteries 15Conclusion 16References 17iii
Life Cycle Analysis of Electric Vehicles Balpreet KukrejaExecutive SummaryThe City of Vancouver has an extensive fleet of vehicles. Due to the significant impact oftransportation on total greenhouse gas emissions from a region, the City wants to reduce thisimpact by replacing more internal combustion engine vehicles (ICEVs) in its fleet with electricvehicles (EVs). This study uses life cycle analysis (LCA) to comparatively analyze two vehiclemodels of similar size of each type (ICEV and EV) currently used in the City’s fleet. Ford Focus ischosen for the ICEV and Mitsubishi i-MiEV for the EV, both with a vehicle life of 150,000km.Carbon emissions and energy consumption are analyzed for each phase from cradle-to-grave forboth vehicles: raw material production, vehicle manufacture, transportation, operation, anddecommissioning. The analysis shows that the electric vehicle has notably lower carbonemissions and lower energy consumption per kilometer. After considering all phases, the FordFocus emits 392.4gCO2-eq/km and Mitsubishi i-MiEV emits 203.0gCO2-eq/km over the vehiclelife. Corresponding energy consumption is 4.2MJ/km for Ford Focus and 2.0MJ/km for Mitsubishii-MiEV. Sensitivity analysis with a vehicle life of 100,000km and 250,000km is also conducted,with the longer vehicle life further shifting the efficiency balance toward the electric vehicle.1
Life Cycle Analysis of Electric Vehicles Balpreet KukrejaIntroductionElectric powertrains are a promising technology for the propulsion of vehicles with potential toimprove air quality and reduce greenhouse gas emissions associated with road transport. Electricpowertrains are more efficient than internal combustion engine vehicles (ICEVs) and have zerotailpipe emissions (Sadek, 2012). In addition, the technology can help to mitigate the transportsector’s heavy reliance on fossil fuels.On the flipside, large scale adoption of electric vehicles (EVs) may require additional electricitygeneration. Electric powertrains also require advanced components with a more diverse resourcerequirement that may have different environmental impacts to those of a conventional vehicle(Nordelöf & Messagie, 2014).This study employs the cradle-to-grave approach of life cycle analysis to assess environmentalimpacts for similar sized gasoline and electric vehicles in the City of Vancouver fleet that havebeen in service for at least 5 years.Why Life Cycle Analysis?Life cycle analysis (LCA) can be utilized to analyze the advantages and disadvantages of atechnology (ISO, 2006). In this study, this is done by assessing the environmental impacts,specifically energy use and CO2-equivalent emissions, during each stage of the vehicle’s life.When a new vehicle is acquired, there are already significant inflows and outflows associatedwith it. The inflows to a system can include water use, natural resources and energy input, whilethe outflows can include emissions and waste products. While average mileage or tailpipeemissions allow us to compare the efficiency of different vehicles, it provides an incompletepicture as this is only comparing flows associated with operation of the vehicle; none of the flowsassociated with stages prior to vehicle operation have been considered.This data is relevant to decision makers within the City of Vancouver and could be used forstrategic planning within the Equipment Services division of the City for potential futureelectrification of vehicle fleets.2
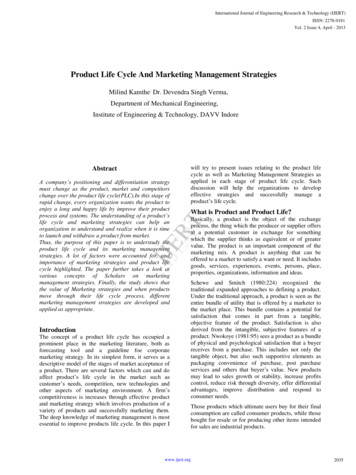
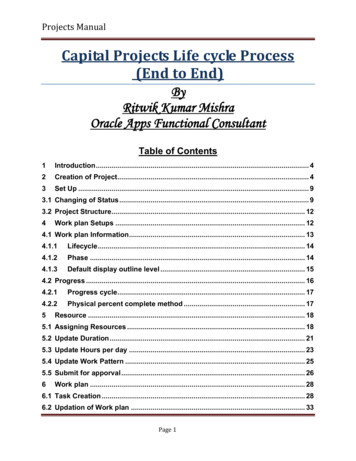
Life Cycle Analysis of Electric Vehicles Balpreet KukrejaGoalThe goal of this study is to analyze environmental impacts, specifically energy use and CO2equivalent emissions, and quantify data based on a functional unit for two vehicle types ofsimilar size: Ford Focus and Mitsubishi i-MiEV. This data is collected for the resource extraction,manufacturing, transportation, operation, and decommissioning stages of the vehicle. Optionsare also presented for future use of retired vehicle components such as the lithium-ion battery.ScopeThe scope of this study is to analyze 13 Ford Focus internal combustion engine vehicles put inservice in 2006 or later and 27 Mitsubishi i-MiEV electric vehicles put in service in 2012 or later inthe City of Vancouver fleet. These vehicles are comparatively analyzed due to their similar size.This analysis encompasses the equipment life cycle of the vehicles and is focused on scope 1emissions, as shown in Figure 1. The well-to-wheels lifecycle of energy production (scopes 2 and3) falls outside of the scope of this study and is considered under the BC Low Carbon FuelStandard.Figure 1 – System boundaries for a complete life cycle analysis of vehicles. This study focuses on the equipment lifecycle and does not analyze the well-to-wheels life cycle. (Nordelöf & Messagie, 2014)3
Life Cycle Analysis of Electric Vehicles Balpreet KukrejaMethodologyA functional unit of one kilometer (1 km) travelled by a vehicle is used throughout the study. Thisfunctional unit is then adapted for the different analyses – energy consumption is presented asMJ/km and emissions as gCO2-eq/km, assuming an average vehicle life of 150,000km for bothvehicles. Data is gathered for inflows and outflows at each stage. The processes are linked fromcradle-to-grave and an inventory is taken for the flows to show how they connect and affect eachother. Finally, sensitivity analysis is completed for cases where vehicle lifetime is 100,000km and250,000km.Data SourcingData for raw materials used in both electric and gasoline vehicles was obtained from Weiss et al.(2000), a study that breaks down total materials by element for both vehicle types. While thedataset is based on predictions made in the early 2000’s, it is a robust study that is still relevanttoday. (Weiss & Heywood, 2000)Data for vehicle manufacture was estimated as a linear function of material mass due to thehighly complex supply chain in the automobile industry. The Ford Focus is assumed to beassembled in Wayne, Michigan and is transported by a combination of rail and truck with a grossvehicle weight of 1355kg (Ford Motor Company, 2018). The Mitsubishi i-MiEV is assumed to beassembled in Kurashiki, Japan and is transported by sea with a gross vehicle weight of 1450kg(Mitsubishi Motors, 2018).Operational data for fuel consumption and maintenance is sourced from the City of Vancouverdatabases for gasoline vehicles. Electric vehicle charging stations are manufactured byChargePoint and access to their online dashboard provides data on electricity consumed for EVsoperated by the City.Finally, the end of life procedures assume that a vehicle is dismantled and all parts except for thelithium-ion batteries are shredded. Options for future use of the lithium-ion batteries arepresented later in the report.4
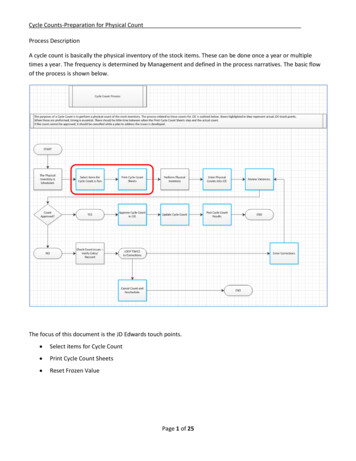
Life Cycle Analysis of Electric Vehicles Balpreet KukrejaLife Cycle InventoryEnergy requirements and emissions from vehicle material production are presented in thefollowing sections. Figures 2 and 3 show the mass distribution by material for both ICEV and EV.Ferrous metals (mainly high-strength steel) are a large percentage of material used in ICEVs whileboth steel and aluminum are significant components of an EV.Internal combustion engine vehicle massdistribution by material (kilograms)Ferrous 4Wood, Felt, etc.Rubber85Glass98861075MagnesiumCopperPaint, coatingsZincLeadFluidsFigure 2 – Mass distribution of an internal combustion engine vehicle. Various alloys of steel account for two thirds(67%) of vehicle mass, with aluminum and plastics having the largest mass for non-steel materials (Weiss &Heywood, 2000).5
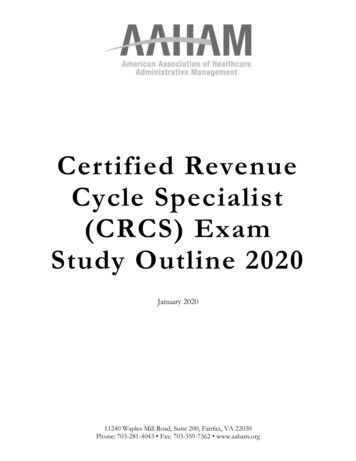
Life Cycle Analysis of Electric Vehicles Balpreet KukrejaElectric vehicle mass distribution bymaterial (kilograms)Ferrous MetalsAluminumNickel9384Others796435304Wood, Felt, perPaint, coatingsZincLeadFluidsFigure 3 – The predicted mass distribution of an electric vehicle in 2020 shows a different picture, with aluminumand nickel having a much more significant role. Ferrous metals (mainly high-strength steel) are still the dominantmaterial. (Weiss & Heywood, 2000)Raw Material ProductionThe production to convert raw material to a virgin input for manufacturing is analyzed based ondata from Sullivan et al. (2010) and is summarized in Figure 4. This energy intensity data was thenapplied to the data shown in Figure 2 and Figure 3. This gave total energy consumed in materialproduction as 73.2GJ for the Ford Focus and 139.2GJ for the Mitsubishi i-MiEV, or 0.49MJ/km and0.93MJ/km respectively.1Carbon intensity of this stage was calculated from emission factors at the respectivemanufacturing locations. The emission factor for the electricity grid in the United States is1These values, and all other values in this section that are given per km, are calculated assuming an average vehiclelife of 150,000km.6
Life Cycle Analysis of Electric Vehicles Balpreet Kukreja744gCO2-eq /kWh (EPAa, 2016) and that of Japan is 635gCO2-eq/kWh (IEA, 2017). 73.2GJ ofenergy equates to 20.3MWh; thus, the Ford Focus emits 15.1tonsCO2-eq due to materialproduction, which translates to 101gCO2-eq /km from this segment. A similar calculation forMitshubishi i-MiEV using Japanese grid intensity yields emissions of 164gCO2-eq/km due tomaterial production.2Energy Intensity aterialFigure 4 – Graph showing energy required per unit mass to convert various raw materials to usable virgin feedstockfor a manufacturing process (Sullivan & Burnham, 2010).ManufacturingThe typical range of energy consumption for compact car manufacture is 17-22MJ/kg (Weiss &Heywood, 2000). Taking an average value of 20MJ/kg, the manufacturing process requires 27.1GJfor the Ford Focus and 29GJ for the Mitsubishi i-MiEV, or 0.18MJ/km and 0.19MJ/km respectively.2While these calculations assume only electricity use at the production sites, actual energy use will likely be a mix ofboth electricity and oil-based products. However, to simplify the analysis and still yield meaningful data, the abovecalculation is an appropriate approximation.7
Life Cycle Analysis of Electric Vehicles Balpreet KukrejaAgain, using emissions factors of 744gCO2-eq /kWh for US and 635gCO2-eq /kWh for Japan, thistranslates to 37gCO2-eq/km for the Ford Focus and 34gCO2-eq/km for Mitsubishi i-MiEV due tothe manufacturing process.3TransportationTransportation of the vehicles was analyzed from the vehicle assembly plant to the point of use.The Ford Focus is assumed to be assembled in Wayne, Michigan, 3953km from Vancouver, BC.This route is serviced by a combination of rail and truck, and a 50-50 split is assumed forcalculation purposes.The energy intensity of rail transport is estimated at 0.5MJ/ton-km (Railway Association ofCanada, 2014) while that for trucking is approximately 1.5MJ/ton-km (NRCAN, 2016). As such, anaverage energy intensity of 1MJ/ton-km is used, giving energy consumed as 5.3GJ to transportthe Ford Focus the required distance. Amortizing this value over a 150,000km vehicle life gives0.04MJ/km. Using the same datasets from (Railway Association of Canada, 2014) and (NaturalResources Canada, 2016), the emission factors for transportation were calculated as 15.2gCO2eq/ton-km for rail and 63.8gCO2-eq/ton-km for truck, which translates to an average value of39.5gCO2-eq/ton-km with a 50-50 split. Given the distance travelled and weight of the vehicle,this translates to 1.4gCO2-eq/km for the Ford Focus.The Mitsubishi i-MiEV is assumed to be assembled in Kurashiki, Japan, 8005km from Vancouver,BC. This route is assumed to be covered entirely by sea, with negligible amounts of trucking.Energy intensity of sea transportation is approximately 0.8MJ/ton-km (European Energy Agency,2016), giving energy consumed as 9.3GJ to transport the Mitsubishi i-MiEV the required distance.Amortizing this value over a 150,000km vehicle life gives 0.06MJ/km. Using the same datasetfrom European Energy Agency, 2016, an emission factor of 34gCO2-eq/ton-km was developed formarine freight transportation. Given the distance travelled and weight of the vehicle, thistranslates to 2.6gCO2-eq/km for the Mitsubishi i-MiEV.3See footnote 2 about energy use mix and oil-based products, which applies to these calculations as well.8
Life Cycle Analysis of Electric Vehicles Balpreet KukrejaOperationCity of Vancouver databases were used to determine an average fuel efficiency of10.9litres/100km for the ICEV in service. Given an energy density of 44.4MJ/kg and a productdensity of 0.71kg/litre for gasoline (USDOE, 2000), this gives an energy consumption of3.44MJ/km for the Ford Focus. The fuel efficiency translates to 253gCO2-eq/km (EPAb, 2017).Data from ChargePoint’s infrastructure was used to determine an average energy efficiency of0.21kWh/km for the Mitsubishi i-MiEV vehicles in service, equivalent to 0.76MJ/km. Given anemission factor of 10.7tonCO2-eq/GWh (BCHydro, 2015) for electricity generated in BC, theaverage energy efficiency translates to 2.2gCO2-eq/km in carbon emissions.DecommissioningTo decommission the vehicles, the ICEV and EV use similar processes of dismantling andshredding. All components of both vehicles are assumed to be disposed, except for the EVlithium-ion battery pack which is assumed to be recycled in this analysis. It is assumed thevehicles are transported by heavy truck to a shredding facility, many of which exist in the LowerMainland with an average round-trip distance of 40km. As such, the energy required to transportthe vehicle to the shredder is 1.5MJ/ton-km * 40km 0.06MJ/kg. Average energy to operate theshredder is 0.37MJ/kg (Bakker, 2010), and as such the total energy to shred the vehicles is0.43MJ/kg. Ford Focus shredding: 1355kg * 0.43MJ/kg 583MJ, or 0.004MJ/km. Using electricityin BC, this translates to 0.012gCO2-eq/km in carbon emissions.Data from Ishihara et al. shows lithium-ion batteries require 469MJ/kWh to recycle (Ishihara &Kihira, 2002). Given a 16kWh battery (Mitsubishi Motors, 2018), this translates to 7.5GJ. The nonbattery components of the Mitsubishi i-MiEV will require 1150kg * 0.43MJ/kg 495MJ to beshredded. This gives a total energy consumption of 8.0GJ, or 0.053MJ/km. Again, assuming theshredding and recycling takes place in BC, this translates to 0.2gCO2-eq/km in carbon emissions.9
Life Cycle Analysis of Electric Vehicles Balpreet KukrejaSummary450.0400.00.012Emissions 22.634.1200.0150.0TransportationManufacturingRaw Material rd FocusMitsubishi i-MiEVFigure 5 – Graph comparing CO2-equivalent emissions with a vehicle life of 150,000km.Total effective emissions shown in Figure 5 for the Ford Focus were 392.4gCO2-eq/km, whilethose for the Mitsubishi i-MiEV were 48% lower and nearly half this value, at 203.0gCO2-eq/km.Emissions due to operation represented 65% of the total for the Focus, and just 1.3% for the iMiEV, highlighting the significant advantage EVs have in operational efficiency over ICEVs,especially in regions with predominantly clean power sources, such as British Columbia.Also notable is the 62% higher emissions due to raw material production in an EV, which can beattributed to the complex supply chain of components and significant use of uncommon metalssuch as nickel and other metals in the lithium-ion battery. The remaining stages ofmanufacturing, vehicle transportation and decommissioning did not represent a significant partof total emissions.10
Life Cycle Analysis of Electric Vehicles Balpreet Kukreja4.50Energy Consumption 8ManufacturingRaw Material Production0.930.49Ford FocusTransportationMitsubishi i-MiEVFigure 6 – Graph comparing energy consumption with a vehicle life of 150,000km.The total values for energy consumption in Figure 6 followed a similar pattern to carbonemissions, with total energy consumption per kilometer for the Ford Focus being 4.2MJ/km,more than double that for the Mitsubishi i-MiEV, which came in at 2MJ/km, 52% lower.The most significant energy consumption for the Ford Focus was in the operation stage, whilethat for Mitsubishi i-MiEV having a much smaller amount. Again, the raw material productionenergy use had a higher value for the i-MiEV than the Focus, possibly explained by similarreasons as discussed in the carbon emissions section. Other phases of the life cycle did notcontribute significantly in either of the two categories.Comparison of Results with Similar AnalysisPoovanna et al. (2018) performed a similar analysis of an ICEV vs. EV in British Columbia with aproduct life of 150,000km. Lifetime emissions calculated were 38.4tonsCO2-eq for the ICEV and12.2tonsCO2-eq for the EV. Energy consumed was 480.8GJ for the ICEV and 228.8GJ for the EV.11
Life Cycle Analysis of Electric Vehicles Balpreet KukrejaIn this analysis, the corresponding lifetime emissions are 58.9tonsCO2-eq for the ICEV and30.5tonsCO2-eq for the EV. Lifetime energy consumed was 630GJ for the ICEV and 300GJ for theEV.These discrepancies for carbon emissions and energy consumed could be attributed to themethodology of both reports. The most significant difference was noted in the productionsegments of the LCA, where (Poovanna & Davis, 2018) consider manufacturing while this analysisaccounts for both raw material production and manufacturing.Sensitivity AnalysisThe calculations were repeated using a vehicle life of 100,00km and 250,000km for both cases toillustrate the effect of a vehicle life on the final numbers.400.0Emissions ationManufacturingRaw Material Production0.822.460.598.20.0Ford FocusMitsubishi i-MiEVFigure 7 – Graph comparing CO2-equivalent emissions with a vehicle life of 250,000km.With vehicle life of 250,000km, the Ford Focus now has emissions of 336.7gCO2-eq/km and theMitsubishi i-MiEV at 122.6gCO2-eq/km, meaning the EV had 64% lower carbon emissions. Asexpected, the numbers for the operation stage were unchanged compared to the previousanalysis. This is because the operational emissions do not depend on the vehicle lifetime and are12
Life Cycle Analysis of Electric Vehicles Balpreet Kukrejaa function of the powertrain efficiency. The other stages all have lower emissions per km due tohaving a fixed amount of emissions that are now amortized over a longer vehicle life.4.50Energy Consumption 0.760.500.000.040.120.020.110.29Ford FocusRaw Material Production0.56Mitsubishi i-MiEVFigure 8 – Graph comparing energy consumption with a vehicle life of 250,000km.Similar results were obtained for energy consumption – 3.86MJ/km for Ford Focus and1.50MJ/km for the Mitsubishi i-MiEV, 61% lower. The operational numbers were unchangedwhile the other four stages had lower numbers.Figures 9 and 10 show similar data with a vehicle life of 100,000km. Ford Focus is at 462.3gCO2eq/km and 4.5MJ/km; Mitsubishi i-MiEV is at 303.2gCO2-eq/km and 2.6MJ/km.13
Life Cycle Analysis of Electric Vehicles Balpreet Kukreja500.0450.00.017Emissions nufacturingRaw Material Production150.0245.6100.0151.350.00.0Ford FocusMitsubishi i-MiEVFigure 9 – Graph comparing CO2-equivalent emissions with a vehicle life of 100,000km.5.00Energy Consumption nTransportationManufacturingRaw Material Production1.390.730.00Ford FocusMitsubishi i-MiEVFigure 10 – Graph comparing energy consumption with a vehicle life of 100,000km.14
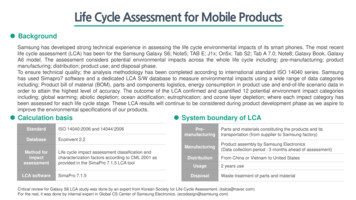
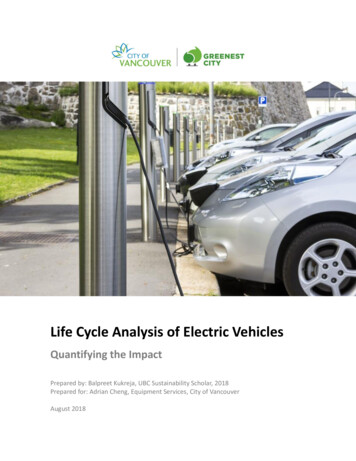
Life Cycle Analysis of Electric Vehicles Balpreet KukrejaFuture Use of Lithium-Ion BatteriesOnce an electric vehicle reaches end-of-life, the battery can still have further uses. Old EVbatteries can undergo a recycling process where metals in the battery are recovered andreprocessed to make new batteries. Currently, two processes are most common for EV batteryrecycling – hydrometallurgical and pyrometallurgical recycling (Hendrickson & Kavvada, 2015).These processes are economically feasible due to the relatively high value of metals like nickel,cobalt, lithium, manganese, and aluminum, all of which can be recovered from the batteries.Companies such as American Manganese Inc., based in Surrey, BC, have developed a process thatcan extract 92% of lithium from the battery with costs as low as 0.25 to 0.30 per pound (JWNEnergy, 2017). However, due to electric vehicles becoming more common only recently, asubstantial amount of old lithium-ion batteries is not yet readily available. This will obviouslychange in the future as electric vehicle adoption increases and a critical mass of used batteriesbecomes available to recycle.Other methods of using old EV batteries are for energy storage, where old EV battery cells stillprovide adequate capacity for terrestrial electricity storage. The lithium-ion cells are tested andassembled into scalable energy storage packs (Box of Energy, 2017). The intermittent nature ofrenewable power generation like wind and solar means that if the energy produced is not usedimmediately or stored, it is wasted. Currently, the vast majority of energy storage globally is donewith pumped hydroelectric energy storage. Lithium-ion batteries offer energy storage wherewater supplies may not be readily available. The battery packs are also especially useful in gridstabilization due to their near-instantaneous operation (Electrek, 2018).In other regions, car companies like Nissan are realizing the economic opportunity of creating asecond revenue stream from end-of-life Leaf batteries (Nissan, 2018). The company has workingprototypes of solar-powered lighting systems with integrated batteries that operateindependently of the electrical grid. This is especially important in seismically active regions likeJapan and the west-coast of North America.15
Life Cycle Analysis of Electric Vehicles Balpreet KukrejaFigure 11 – Nissan project “The Reborn Light”, which creates solar-powered streetlights that operate independent ofthe grid with integrated Nissan Leaf batteries and have reached end-of-life in the vehicle.ConclusionThe life cycle of electric vehicles and internal combustion engine vehicles was comparativelyanalyzed by dividing into five categories: raw material production, vehicle manufacture,transportation, operation, and decommissioning. The analysis of environmental impacts onenergy use and carbon emissions revealed that electric vehicles have a markedly lower impact inboth categories, especially in regions with clean power sources like British Columbia. Thisconclusion is reached after consideration of the higher environmental burdens of raw materialproduction and decommissioning inherent to electric vehicles. The significantly lower impactsfrom the operation stage had the strongest effect on the results. Sensitivity analysis showed thata longer lifespan shifted the efficiency balance further toward the electric vehicle.16
Life Cycle Analysis of Electric Vehicles Balpreet KukrejaReferencesBakker, D. (2010). Battery Electric Vehicles: Performance, CO2 emissions, lifecycle costs andadvanced battery technology development. Copernicus Institute at University of Utrecht.BCHydro. (2015). Greenhouse Gases. Retrieved limate action/greenhouse gases.htmlBox of Energy. (2017). Box of Energy Product Information. Retrieved 2018.pdfElectrek. (2018). Tesla’s giant battery in Australia made around 1 million in just a few days.Retrieved from -australia-1-million/EPAa. (2016). Greenhouse Gases Equivalencies Calculator - Calculations and References. Retrievedfrom United States Environmental Protection esEPAb. (2017). Highlights of CO2 and Fuel Economy Trends. United States EnvironmentalProtection Agency.Ford Motor Company. (2018). 2018 Ford Focus SE Hatchback. Retrieved from s-se-hatchback/Hendrickson, T. P., & Kavvada, O. (2015). Life-cycle implications and supply chain logistics ofelectric vehicle battery recycling in California. Environmental Research Letters.IEA. (2017). CO2 emissions from fuel combustion. International Energy Agency.Ishihara, K., & Kihira, N. (2002). Environmental Burdens of Large Lithium-Ion Batteries Developedin a Japanese National Project.ISO. (2006). Environmental management — life cycle assessment — principles and framework.International Organization for Standardization.17
Life Cycle Analysis of Electric Vehicles Balpreet KukrejaJWN Energy. (2017). Tiny BC company sees big future in battery recycling. Retrieved from Carbon& Sustainability: ompany-sees-bigfuture-battery-recycling/Mitsubishi Motors. (2018). Specifications i-MiEV. Retrieved from v/specifications/Natural Resources Canada. (2016). Fuel Efficiency Benchmarking in Canada's Trucking Industry.Nissan. (2018). The Reborn Light. Retrieved from f, A., & Messagie, M. (2014). Environmental impacts of hybrid, plug-in hybrid, and batteryelectric vehicles—what can we learn from life cycle assessment? The International Journalof Life Cycle Assessment.Poovanna, P., & Davis, R. (2018). Environmental Life Cycle Assessment of Electric Vehicles inCanada. PluginBC.Railway Association of Canada. (2014). Locomotive Emissions Monitoring Program.Sadek, N. (2012). Urban electric vehicles: a contemporary business case. Eur Transp Res Rev.Sullivan, J., & Burnham, A. (2010). Energy-Consumption and Carbon-Emission Analysis of Vehicleand Component Manufacturing. Energy Systems Division, Argonne National Laboratory.USDOE. (2000). Overview of Storage Development. US Department of Energy - Sandia NationalLaboratories.Weiss, M. A., & Heywood, J. B. (2000). ON THE ROAD IN 2020 - A life-cycle analysis of newautomobile technologies. Massachusetts Institute of Technology Energy Laboratory.18
The well-to-wheels lifecycle of energy production (scopes 2 and 3) falls outside of the scope of this study and is considered under the Low arbon Fuel Standard. Figure 1 – System boundaries for a complete life cycle analysis of vehicles. This study focuses on the equipment life cycle and does no