Transcription
PALOMAR COLLEGEFACT BOOK2017-18Industrial Technology Center
This Page Has Deliberately Been Left Blank.
Michelle Barton, M.S., Director, Institutional Research, Planning and Grantsmbarton@palomar.eduMichael D. Large, Ph.D., Senior Institutional Research Analystmlarge@palomar.eduGrace Robertson, Senior Institutional Research Analystgrobertson@palomar.eduRachel M. Miller, Ph.D., Research Analystrmiller1@palomar.eduDavid Vazquez, M.A., Research Analystdvazquez@palomar.eduRoberta Johnson, Senior Administrative Secretaryrjohnson3@palomar.eduPALOMAR COLLEGEFACT BOOK2017-18Joi Lin Blake, Ed.D.Superintendent/President
Welcome to the 2018 Palomar College Fact BookThis Fact Book contains resources we think you will find useful foractivities such as: institutional review & planning; grant development; marketing; program review & planning; student learning outcomes; site assessment.Please enjoy as you take a tour of data reflecting the growth andevolution of our community college over the past sixty-five years. Wewelcome any comments or suggestions for improvements you maywish to provide. We intend to update annually the contents where itcan be accessed online.For the most up-to-date Fact Book data, please visit: http://www.palomar.edu/irpMichelle Barton,Sr. Director, Planning, Research, Institutional Effectiveness, and Grants
Table of ContentsSectionPage11. General InformationHistory of The College. 2Service Area Map. 3Adult Population Served By Age. 4Population Participation Rate By Age. 5Adult Population Served By Ethnicity. 6Population Participation Rate By Ethnicity. 7-82. Organizational Structure and GovernanceGoverning Board. 9Senior Management Team. 10Organizational Chart. 11-123. Student Enrollment and DemographicsHistorical Fall Semester Enrollment. 13Credit & Non-Credit Enrollment.14Full-Time & Part-Time Enrollment.15Enrollment by Age. 16Enrollment by Gender. 17Enrollment by Ethnicity. 18Enrollment by Citizenship Status.19Enrollment by Admission Status. 20Initial Versus Informed Student Goals.21Student Educational Status.22Last Type of High School Attended.23Last San Diego High School Attended. 24-25Enrollment by Residence Location (ZIP). 26New Student Educational Status.27New Student Last High School Type.28New Student Last San Diego High School. 29-30New Students from Local Public High Schools. 31Assessment Testing Results.32Financial Aid Applicants & Recipients. 334. Faculty, Staff and AdministrationEmployees By Job Classification. 34Employees By Occupational Activity. 35Employee Demographics By Job Classification. 36-405. Institutional Effectiveness and Student OutcomesRetention & Success in Transfer Courses. 41Retention & Success in Basic Skills Courses.42-43Retention & Success in Vocational Courses. 44Fall to Spring Persistence. 453-Year Term to Term Persistence.46Transfers to UC & CSU. 47Discipline Level Outcomes & Productivity. 48-103PALOMAR COLLEGE-1-FACTBOOK 2018
Section 1GeneralInformation
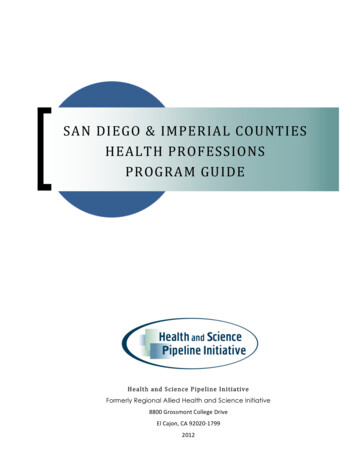
History of Palomar CollegeGENERAL INFORMATIONPalomar College has a history rich in tradition and educational achievements. On January 15, 1946,registered voters in the Vista Unified School District, the Fallbrook Union School District, and theEscondido Union High School District voted 714 to 417 in favor of establishing a “junior college”in the North San Diego County area. Under state law, the San Diego County Superintendent ofSchools appointed five persons as members of the first Governing Board for the new college.The Governing Board hired the first college president in 1946, Dr. Daniel C. McNaughton, who wassupported by a director, a dean of students, and nine faculty members. Located on the Vista HighSchool campus, Palomar College opened its classroom doors on September 23, 1946, with exactly100 students enrolled in classes in science, mathematics, music, art, social sciences, commerce,English, physical education, and foreign languages.Today, Palomar College is a public, two-year comprehensive community college serving a largestudent body of diverse ages, ethnicities, and lifestyles. The District's 200-acre main campus islocated at 1140 West Mission Road in San Marcos. The San Marcos campus, EducationCenter in Escondido, and four additional sites serve a District covering 2,555-square-milesranging from urban to agricultural areas of North San Diego County.The four education sites are located in Camp Pendleton, Fallbrook, Mt. Carmel, and Pauma Valley.The Escondido Education Center is located on eight acres owned by the District, and the proposedNorth Education Center will be located on an 82-acre property in Fallbrook. In June 2010, the Districtpurchased approximately 27 acres of land in Rancho Bernardo that includes a large building andassociated parking structure. This property is the future site of a center to serve the southernportion of the District.Palomar College constitutes a single-college district, and it is the largest single community collegedistrict in San Diego County. Palomar College borders seven other community college districts:South Orange County, Mt. San Jacinto, Desert, Imperial Valley, Grossmont-Cuyamaca, SanDiego, and MiraCosta.Palomar College has five academic divisions: (1) Arts, Media, Business, and ComputerScience; (2) Career, Technical, and Extended Education; (3) Languages and Literature; (4)Mathematics and the Natural and Health Sciences; and (5) Social and Behavioral Sciences. TheCollege offers more than 250 credit degree and certificate programs within those five divisionsand noncredit courses. At Palomar, students have the opportunity to participate in a vibrantcollege life that includes free art and cinema series, 34 academic and social campusorganizations, 22 competitive intercollegiate sports teams for men and women, and dozens ofmusic, theater, and dance performances.In the November 2006 General Election, voters approved an educational facilities improvementmeasure (Proposition M), which provides the majority of the funding for the College’s 1 billionconstruction and remodel plan. The first major step in the implementation of this plan wasrealized with the completion of the Natural Sciences Building, which opened for the Fall 2007semester. This is an exciting time for students, faculty, staff, and administration at PalomarCollege. The vision in the Master Plan 2022 has moved to reality as the planning, design, andconstruction of several instructional and support facilities take shape. Master Plan 2022 istransitioning Palomar College into its next generation as an outstanding institution of highereducation committed to the learning success of its students and responsive to the changingneeds of its diverse community.Source: Palomar College 2017-18 Catalog , page 11.PALOMAR COLLEGE-2-FACTBOOK 2018
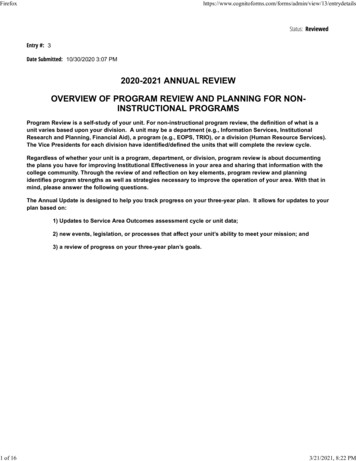
Palomar Community College District Service AreaGENERAL INFORMATIONPALOMAR COLLEGE-3-FACTBOOK 2018
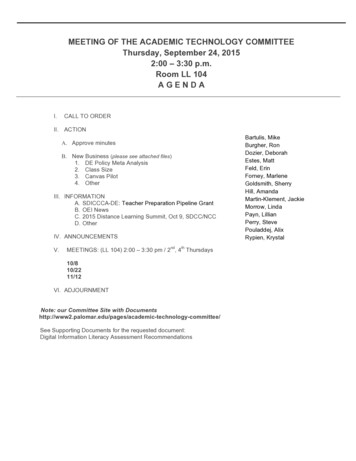
Adult Population Served By AgeSERVICE AREA 93.091.389.688.086.384.883.218 to 6481.765 and older80.2300400500600700800ThousandsSource: San Diego Association of Governments (SANDAG) Data SurferGeographic Unit Palomar Community College DistrictProfile Types 2000 Census, Current 2014 Estimates, 2030 Forecast (2010, 2020, 2030)Metric Population By AgeInterpolation: Compound Average Annual Growth Rate (CAAGR) Between Bracketing SANDAG YearsPALOMAR COLLEGE-4-FACTBOOK 2018
Credit/NonCredit Adult Population Participation Rate By AgeSERVICE AREA 233313030Credit454547444343Ages 18-64NonCredit333333Ages 18-64NonCredit655555Total363637343333Fall Participation RatesAges 65 Credit NonCredit Total212212102102112112Total Adults 18 Credit NonCredit 48Annual Participation RatesAges 65 Credit NonCredit Total213213213213213213Total Adults 18 Credit NonCredit Total375423744239443364403543935439Notes: Participation Rate is defined to be the number of students of a given age enrolled at thedistrict per 1,000 adults of that age in the local population.Population Source: San Diego Association of Governments (SANDAG) Profile WarehouseGeographic Unit Palomar Community College DistrictProfile Types 2000 Census, Current 2014 EstimatesMetric Population By AgeInterpolation: Compound Average Annual Growth Rate (CAAGR) Between Bracketing SANDAG YearsEnrollments Source: MIS Submissions to the CCCCOMIS SB :: MIS SX :: MIS CB Where SX05 Pos Hours 0 & CB04 Cred Stat N for NonCreditEnrollsMIS SB :: MIS SX :: MIS CB Where SX05 Pos Hours 0 & CB04 Cred Stat N for Credit EnrollsPALOMAR COLLEGE-5-FACTBOOK 2018
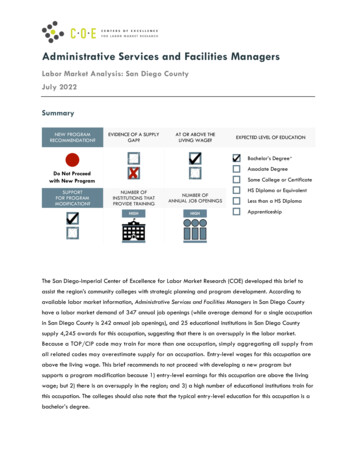
Adult Population Served By Age & EthnicitySERVICE AREA PROFILEAges 65 ThousandsThousandsAges 18-645005004004003003002002001001000African er11,69312,04912,41613,014Native 631,1671,348Source: San Diego Association of Governments (SANDAG) Profile WarehouseGeographic Unit Palomar Community College DistrictProfile Types 2000 Census, Current 2014 EstimatesMetric Population By Race, Ethnicity And AgeInterpolation: Compound Average Annual Growth Rate (CAAGR) Between Bracketing SANDAG YearsPALOMAR COLLEGE-6-FACTBOOK 2018
Credit/NonCredit Adult Population Participation Rate By Age & EthnicitySERVICE AREA PROFILEFall Participation RatesAges 65 Credit NonCredit TotalCreditAges 2121222111Total Adults 18 Credit NonCredit TotalAsian/Pacific-Islander (Includes an American000111Hispanic323322Native American000000White000000Continues on Next PageNotes: Participation Rate is defined to be the number of students of a given age & ethnicity enrolledat the district per 1,000 adults of that age & ethnicity in the local population.PALOMAR COLLEGE-7-FACTBOOK 2018
Credit/NonCredit Adult Population Participation Rate By Age & EthnicitySERVICE AREA PROFILEContinued from Previous PageAges 18-64Credit NonCreditTotalAnnual Participation RatesAges 65 Credit NonCredit TotalTotal Adults 18 Credit NonCredit TotalAsian/Pacific-Islander (Includes ican American100111Hispanic433433Native American000000White110001Notes: Participation Rate is defined to be the number of students of a given age & ethnicity enrolledat the district per 1,000 adults of that age & ethnicity in the local population.Population Source: San Diego Association of Governments (SANDAG) Profile WarehouseGeographic Unit Palomar Community College DistrictProfile Types 2000 Census, Current 2014 EstimatesMetric Population By AgeInterpolation: Compound Average Annual Growth Rate (CAAGR) Between Bracketing SANDAG YearsEnrollments Source: MIS Submissions to the CCCCOMIS SB :: MIS SX :: MIS CB Where SX05 Pos Hours 0 & CB04 Cred Stat N for NonCredit EnrollsMIS SB :: MIS SX :: MIS CB Where SX05 Pos Hours 0 & CB04 Cred Stat N for Credit EnrollsPALOMAR COLLEGE-8-FACTBOOK 2018
This Page Has Deliberately Been Left Blank.
Section 2OrganizationalStructureandGovernance
Palomar Community College District Governing BoardORGANIZATIONAL STRUCTURE & GOVERNANCEThe Palomar Community College District is governed by a five-member Governing Board electedto four-year terms by voters in the district which serves 2,555 square miles of northern San DiegoCounty. A student elected by the students as the Associated Student Government Presidentalso serves as student trustee for a one-year term. The public may contact membersof the Governing Board in writing c/o Palomar College, 1140 West Mission Road,San Marcos, CA 92069, or by calling the district office at (760) 744-1150 x2104.Paul P. McNamara, B.A.PresidentJohn J. Halcón, Ph.D.Vice PresidentMark R. Evilsizer, M.A.SecretaryNancy Ann Hensch, B.A.TrusteeNina DeerfieldTrusteeChris HoopStudent TrusteeSource: http://www.palomar.edu/GB/PALOMAR COLLEGE-9-FACTBOOK 2018
Palomar Community College Senior ManagementORGANIZATIONAL STRUCTURE & GOVERNANCESENIOR COLLEGE MANAGEMENTJoi Lin BlakeJack KahnRon E. BallesterosPerezAdrian GonzalesLisa NormanJustin SmileyMargie FritchBrian StockertShayla SivertKathy KailikolePearl LySuperintendent/PresidentAssistant Superintendent/President, Vice President, InstructionAssistant Superintendent/President, Vice President, Business &FinanceAssistant Superintendent/President, Vice President, Student ServicesAssistant Superintendent/President, Vice President, Human ResourcesDean Arts, Media, Business and Computer ScienceDean Career, Technical and Extended EducationDean Counseling ServicesDean Languages and LiteratureDean Mathematics and the Natural and Health Sciences (Interim)Dean Social and Behavioral SciencesFACULTY, STAFF, AND STUDENT LEADERSHIPTravis RittChris HoopConnie SterlingJenny AkinsAnel GonzalezPresident, Faculty SenatePresident, Associated StudentsPresident, Administrative AssociationPresident, Confidential and Supervisory Team CASTPresident, Council of Classified Employees/American Federation of Teachers CCE-AFTPALOMAR COLLEGE- 10 -FACTBOOK 2018
PALOMAR COLLEGE ORGANIZATIONAL CHARTGoverning Boardx2104Superintendent/PresidentJoi Lin Blake760-744-1150 x2105Asst. Superintendent/Asst. Superintendent/Instructional ServicesVice PresidentVice PresidentAccreditation, Part-timeHuman ResourcesInstructionPart-time Faculty CenterLisa NormanJack KahnProfessional Developmentx2246Tenure & Evaluationsx2531Human ResourceDeanDeanDeanDeanDeanServices ManagerArts, Media,Career TechnicalSocial &LanguagesMathematics &Vacant x2201Business, && ExtendedBehavioralandthe Natural &Computer ScienceEducationSciencesLiteratureHealth SciencesEEO & ComplianceJ SmileyM FritchP LyS SivertK Kailikole (interim)Managerx2154x2276x2759x2251x2253S Cohen x2608ArtCooperative EdAca Tech ResEnglishChemistryx2302x2356Ctr x2341x2392x2505Development/BoehmConsumer Ed &American IndianGallery x2304Design x2349Studies x2425English as a 2ndLanguage x2261Dental AssistingExec DirectorNon CreditMatric x2262Earth, Space &AviationSci x2512Directorx2571FoundationS Rungaitis x2733BusinessEd Ctrs/XtendedBehavioral SciAdmin x2488Ed x8103x2329DirectorCommunicationsEmergency MedChild DevReadingLife SciencesInstitutionalx2440Ed x8153x2206Services x2568x2275& PlanningKKSM RadioOccup&NonCrdEcon, Hist &Speech Comm/MathematicsM Barton x2360x5576Pgms x2286Poli Sci x2412ASL x2405x2535PCTVPerkins/TechKinesiologyx2431Prep x2276x2459WorldLanguage x2390Math LearningCenter ublic SafetyLibrary/MediaNursing EdL GropenNewspaperProgrms x1705Center x2614x2580Regional OccupMulticulturalProgrms x2292Studies x2206Physics &Engineerng x2505X2450Comp Sci & InfoSystems x2387Graphic CommTrade &Tutorial SvcsPlanetariumIndustry x2545x2448x2833 / x2516Workforce &Child Dev CtrsCom Dev x2632SnMarc x2575x2452Performing Artsx2316Escond x8155H BrubeckWellness FitTheater x2453Center x2448PALOMAR COLLEGE- 11 -FACTBOOK 2018
Asst. Superintendent/Asst. Superintendent/Vice President Fiscal &Vice PresidentAdministrative ServicesInternal AuditorStudent ServicesRon E. Ballesteros-PerezR Threatt x3764Adrian DeanDirectorFiscal SvcsFacilitiesInformation SvcsAthleticsCounseling SvcsHealth SvcsC ConiglioC MillerC MoiseS CathcartB StockertJ Harris uilding SvcsHelp DeskDirectorArticulationChief of Policex3660x2629x2140Enrollment Svcsx2190Police DepartmentAccts PayableConstructionNetwork & Techx2116Svcs x2629Svcs x2140BudgetCustodial Svcsx2880x2629Systems &Programng x2140CashieringEnvironmentalHlth & Sfty x2772K Magnusonx2171C MooreAssessmentx3971x2182AdmissionsCareer CenterDirectorx2164x2194Student AffairsFinancial Aid &Scholrshp x2366CounselingS TitusSvcs x2114x2595SnMarc x2179Escond x8157Payroll SvcsFacilitiesInternational Edx2217Planning x2629x2167PurchasingGround Svcsx2121x2629Records/Evals/Trnscrpts x2165AssociatedDRCStudents x3765x2375ManagerVeterans SvcsBusiness &x2173StudentEOP&S/CARE/Activities OfficeCalWorks x2237x7509Grant FundedContract SvcsStdnt ProgramsB tract Svcsx2682x2697Business Suppt.Food SvcsSvcs x2754x2233x2197Transfer Centerx2552Mail Svcs x2811Print Svcs x2558Warehouse x2130PALOMAR COLLEGE- 12 -FACTBOOK 2018
Section 3StudentEnrollmentandDemographics
Unduplicated Fall Enrollment HistorySTUDENT ENROLLMENT & Source: MIS Submissions to the CCCCOMIS SB :: MIS SX Where SX05 Pos Hours 0PALOMAR COLLEGE20,00025,00030,00035,000Notes: Includes both Credit & NonCredit CoursesExcludes Apprenticeship & R.O.P. Courses- 13 -FACTBOOK 2018
Credit/NonCredit Student Counts (Fall Terms Only)STUDENT ENROLLMENT & nCredit Head CountCredit Head CountTotal Head 6.52%93.48%100%75%50%25%0%NonCredit Student PctCredit Student 156.55%93.45%Notes: Credit Students are defined to be those who enrolled in at least one credit course.NonCredit Students are defined to be those who enrolled exclusively in non-credit courses.Source: MIS Submissions to the CCCCOMIS SB :: MIS SX :: MIS CB Where SX05 Pos Hours 0 & CB04 Cred Stat N for NonCredit EnrollsMIS SB :: MIS SX :: MIS CB Where SX05 Pos Hours 0 & CB04 Cred Stat N for Credit EnrollsPALOMAR COLLEGE- 14 -FACTBOOK 2018
Credit/NonCredit Full and Part-Time Students (Fall Terms Only)STUDENT ENROLLMENT & DEMOGRAPHICSCredit StudentsNonCredit Students100%100%80%80%60%60%40%40%20%20%0%0%2012 2013 2014 2015 2016 2017Full Time 31.9% 34.0% 33.2% 33.3% 31.4% 30.8%Full TimePart Time 68.1% 66.0% 66.8% 66.7% 68.6% 69.2%Part Time 100% 100% 100% 100% 100% 100%TotalTotal23,568 23,802 24,192 22,866 23,131 23,389Notes: 20160%1,73920170%1,632Students are defined to be those who enrolled in at least one credit course.NonCredit Students are defined to be those who enrolled exclusively in non-credit courses.Full-Time Students are defined to be those taking 12 or more credit units.Part-Time Students are defined to be those taking fewer than 12 credit units.Since NonCredit Students are (by definition) taking zero units for credit, they are all Part-Time .Source: MIS Submissions to the CCCCOMIS SB :: MIS SX :: MIS XB :: MIS CB Where SX05 Pos Hours 0 & CB04 Cred Stat N for NonCreditEnrollsMIS SB :: MIS SX :: MIS XB :: MIS CB Where SX05 Pos Hours 0 & CB04 Cred Stat N for Credit EnrollsCredit units toward the Full-Time threshold SX03 Units Earned when non-zero,otherwise ((XB05 Units Max XB06 Units Min) / 2)PALOMAR COLLEGE- 15 -FACTBOOK 2018
Credit/NonCredit Student Age (Fall Terms Only)STUDENT ENROLLMENT & DEMOGRAPHICSCredit Students18to 20NonCredit Students18to 20100%100%80%80%60%60%40%40%20%20%65& Over0%17 & '174.0%65& Over0%'1217 & Under 0.7%'131.0%'141.5%'151.6%'161.7%'172.4%37.7% 36.5% 34.8% 35.6% 34.9% 34.9%18-205.9%6.3%5.9%6.4%6.4%5.8%25.6% 26.6% 27.3% 27.6% 27.7% 27.2%21-2415.0% 13.6% 13.2% 10.7% 11.7% 10.8%25-2912.4% 13.3% 13.8% 13.9% 13.7% 14.1%25-2916.5% 16.7% 15.4% 13.4% 12.4% 12.4%30-346.1%6.3%6.6%6.2%6.6%6.6%30-3415.4% 14.6% 14.1% 12.8% 11.0% 10.9%35-393.7%3.7%3.7%3.7%3.9%4.1%35-3911.0% 12.5% 11.7% 12.3% 12.2% 10.5%40-443.1%2.9%2.8%2.6%2.6%2.5%40-4410.7% 9.9% 10.8% 13.7% 12.7% 11.2%45-545.1%4.7%4.4%4.2%3.9%3.8%45-5414.7% 14.8% 17.4% 18.8% 18.8% %7.4%8.6% 10.3%65 & Over1.1%1.1%1.0%1.0%0.9%0.8%65 & 71,7491,6041,7391,632Total23,568 23,802 24,192 22,866 23,131 23,3896.6%Notes: Credit Students are defined to be those who enrolled in at least one credit course.NonCredit Students are defined to be those who enrolled exclusively in non-credit courses.Source: MIS Submissions to the CCCCOMIS SB :: MIS SX :: MIS CB Where SX05 Pos Hours 0 & CB04 Cred Stat N for NonCredit EnrollsMIS SB :: MIS SX :: MIS CB Where SX05 Pos Hours 0 & CB04 Cred Stat N for Credit EnrollsPALOMAR COLLEGE- 16 -FACTBOOK 2018
Credit/NonCredit Student Gender (Fall Terms Only)STUDENT ENROLLMENT & DEMOGRAPHICSCredit StudentsNonCredit 2012 2013 2014 2015 2016 201747.1% 45.7% 46.3% 47.1% 46.7% 46.9%Female2012 2013 2014 2015 2016 201751.2% 52.4% 51.3% 55.4% 55.9% 56.2%Male52.4% 53.9% 53.3% 52.5% 52.8% 52.7%Male46.2% 44.9% 45.7% 41.6% 39.4% .4%0.3%23,568 23,802 24,192 22,866 23,131 23,389Notes: CreditStudents are defined to be those who enrolled in at least one credit course.NonCredit Students are defined to be those who enrolled exclusively in non-credit courses.Source: MIS Submissions to the CCCCOMIS SB :: MIS SX :: MIS CB Where SX05 Pos Hours 0 & CB04 Cred Stat N for NonCredit EnrollsMIS SB :: MIS SX :: MIS CB Where SX05 Pos Hours 0 & CB04 Cred Stat N for Credit EnrollsPALOMAR COLLEGE- 17 -FACTBOOK 2018
Credit/NonCredit Student Ethnicity (Fall Terms Only)STUDENT ENROLLMENT & DEMOGRAPHICSCredit StudentsNonCredit n an /Pac.Isl.5.3%5.4%5.2%5.0%5.2%5.0%Asian/Pac.Isl. % 36.3% 38.3% 40.6% 41.6% 43.2%Hispanic81.2% 79.9% 78.4% 80.7% 71.9% %0.3%0.4%0.4%Native Am.0.8%0.8%0.9%0.6%0.7%0.7%Native Am.0.0%0.2%0.1%0.0%0.0%0.1%White45.6% 44.3% 42.0% 40.2% 38.9% nown5.1%5.1%8.8%7.6% 15.0% 8.3%Total1,885 1,837 1,749 1,604 1,739 1,632Total2.9%3.0%2.8%3.1%2.6%23,568 23,802 24,192 22,866 23,131 23,389Notes: Credit Students are defined to be those who enrolled in at least one credit course.NonCredit Students are defined to be those who enrolled exclusively in non-credit courses.* Unknown students comprise the Decline to Say and the Unknown categories.Source: MIS Submissions to the CCCCOMIS SB :: MIS SX :: MIS CB Where SX05 Pos Hours 0 & CB04 Cred Stat N for NonCredit EnrollsMIS SB :: MIS SX :: MIS CB Where SX05 Pos Hours 0 & CB04 Cred Stat N for Credit EnrollsPALOMAR COLLEGE- 18 -FACTBOOK 2018
Credit/NonCredit Student Citizenship (Fall Terms Only)STUDENT ENROLLMENT & DEMOGRAPHICSCredit StudentsNonCredit Students100%100%80%80%60%60%40%40%20%20%0%0%Other her e/Asylee 0.9%0.6%0.9%0.6%0.4%0.5%Student Visa0.9%1.0%1.1%1.1%1.3%1.1%Student Visa0.1%0.0%0.0%0.0%0.1%0.1%Temp. Resident2.9%2.4%1.3%1.0%0.8%0.5%Temp. Resident 1.6%1.5%0.2%0.2%0.2%0.1%Perm. Resident1.4%2.2%3.4%3.8%3.6%3.5%Perm. Resident5.9%7.2%6.3%7.7%7.6% 12.5%U.S. Citizen90.3% 90.4% 90.2% 90.3% 90.2% 91.2%U.S. Citizen15.8% 17.3% 14.7% 9.4% 10.2% 14.6%Unknown1.2%Unknown11.6% 7.6%Total1,885 1,837 1,749 1,604 1,739 1,632Total1.0%0.9%0.7%1.0%0.6%23,568 23,802 24,192 22,866 23,131 23,389'12'13'14'15'16'1764.1% 65.8% 70.9% 76.5% 76.2% 67.3%6.9%5.6%5.3%5.0%Notes: Credit Students are defined to be those who enrolled in at least one credit course.NonCredit Students are defined to be those who enrolled exclusively in non-credit courses.Source: MIS Submissions to the CCCCOMIS SB :: MIS SX :: MIS CB Where SX05 Pos Hours 0 & CB04 Cred Stat N for NonCredit EnrollsMIS SB :: MIS SX :: MIS CB Where SX05 Pos Hours 0 & CB04 Cred Stat N for Credit EnrollsPALOMAR COLLEGE- 19 -FACTBOOK 2018
Credit/NonCredit Student Enrollment Status (Fall Terms Only)STUDENT ENROLLMENT & DEMOGRAPHICSCredit StudentsNonCredit '14'15'16'171st Time Student 19.6% 19.2% 19.2% 20.6% 20.2% 20.4%1st Time st Time Transfer 6.8%1st Time Transfer 0.0%0.0%0.0%0.0%0.0%0.0%Continuing57.5% 57.0% 55.8% 56.0% 55.9% .5% 14.3% 14.4% 13.3% 12.8% 12.5%Returning0.1%0.0%0.0%0.0%0.0%0.1%Concurrent K-122.7%2.7%3.4%3.1%4.0%4.4%Concurrent %0.0%0.0%0.0%Uncollected99.4% 100.0 99.8% 99.9% 99.9% 99.8%Total1,885 1,837 1,749 1,604 1,739 1,632Total6.7%7.3%7.0%7.2%7.5%23,568 23,802 24,192 22,866 23,131 23,389Notes: Credit Students are defined to be those who enrolled in at least one credit course.NonCredit Students are defined to be those who enrolled exclusively in non-credit courses.Source: MIS Submissions to
Palomar College constitutes a single-college district, and it is the largest single community college . Palomar College borders seven other community college districts: South Orange County, Mt. San Jacinto, Desert, Imperial Valley, Grossmont-Cuyamaca, San. . College offers more than 250 credit degree and certificate programs within those .