Transcription
The Economic Impact ofRock Climbing in the NewRiver Gorge RegionJames N. Maples, PhDMichael J. Bradley, PhDSadie Giles, PhD StudentRhiannon Leebrick, PhDBrian Clark, EdDSubmitted to Access Fund andNew River Alliance of Climberson January 15, 2019.
Findings SummaryThis study examines the economic impact of rock climbing in WestVirginia’s New River Gorge region. Major findings include:1. Non-local residents visiting the New River Gorge region to rock climbspent an estimated 12.1 million in 2018 in Fayette, Nicholas, andRaleigh counties.2. Non-local resident climber expenditures supported an estimated 168jobs and 6.3 million in wages in the study area.3. Over 70% of climbers in the sample had a bachelor degree or higher,with one in five possessing graduate degrees.4. Altogether, 45% of climbers in the sample made 50K or higher inannual personal income, with one in ten reporting six figure annualpersonal incomes.ContentsFindings Summary . 2Meet Your Research Team . 3Methodological Summary . 4Study Area Summary . 7Visitation Estimates . 10Mean Expenditures and IMPLAN Categories . 12Economic Impact Terminology . 14Economic Impact Estimates . 14Expenditures beyond Study Area . 16Sample Demographics . 16Omissions and Considerations . 19Contact Information for Future Studies . 20Special Thanks . 20Cover photo courtesy of Jenny WaltersMap courtesy of Shawn McCauley2
Meet Your Research TeamDr. James N. Maples is an associate professor of sociology atEastern Kentucky University, where he examines the politicaleconomy of renewable tourism. His research interests includethe economic impact of outdoor recreation and social change inrural areas. In his free time, he is conducting an oral history ofrock climbing in Kentucky’s Red River Gorge. He is also an EagleScout, Girl Scout dad, hiker, and metal detectorist.Dr. Michael J. Bradley is an associate professor and directorof graduate studies in the Department of Recreation and ParkAdministration at Eastern Kentucky University. His professionaland academic interests include human dimensions of naturalresource and wildlife management as well as sustainablerecreation practices as it relates to outdoor recreation.Sadie Giles is a PhD student in the department of Sociology atVirginia Tech, and enjoys spending all of her free time (such thatgraduate students have) climbing at the New River Gorge. Inaddition to rock climbing, Sadie’s interests include the sociologies ofaging and health and medicine.Dr. Rhiannon Leebrick is an assistant professor of sociology atWofford College. Her research areas are environmental sociologyand political economy, with a particular interest in ecologicalgentrification and social change in south central Appalachia. Shespends as much time hiking as possible.Dr. Brian G. Clark is an assistant professor in recreation and parkadministration at Eastern Kentucky University. His professional andacademic interests include outdoor recreation behavior and managementas well as visitor use management of parks and protected areas with aspecial focus on experiential education and Leave No Trace practices.3
Methodological SummaryPurposeThe purpose of this study is to examine the annual economic impact of rock climbing inthe New River Gorge Region, which consists of three West Virginia counties: Raleigh,Fayette, and Nicholas. A map of this area is included in the study area summary.Similar WorkRecent work by Outdoor Industry Association indicates that outdoor recreation usersspent an estimated 887 billion in the United States in 2017. Likewise, outdoorrecreation users spent 9 billion in West Virginia alone that year. Recent economicanalysis of tourism to Southern West Virginia national parks indicated that visitation toa four-county (Fayette, Nicholas, Raleigh, and Summers) study region brought 64million in expenditures. A previous 2017 study estimated that visitation to the NewRiver National River alone contributed just shy of 50 million in expenditures.The New River Gorge represents an important climbing destination in CentralAppalachia and contains over 3,000 climbing and bouldering routes spread across over60 miles of cliff line. About half the climbing in this region is on National Park Service,Bureau of Land Management, and/or Army Corps of Engineers public lands. No studyhas exclusively focused on the economic impact of rock climbing in the state at this time.However, recent economic impact studies in Appalachia (Eastern Kentucky WesternNorth Carolina) have found climbing offers important economic benefits intransitioning rural economies. Multiple studies (including Eastern Kentucky, WesternNorth Carolina, East Tennessee, Colorado, and Montana) find that climbers are welleducated and well-paid visitors to the region with economic interests that often overlapor match local residents’ interests.Data CollectionData for this study were collected on-site from May to November 2018. Surveys wereadministered at non-public land climbing areas throughout the day three to four daysper week from May until August and then one to two days per week September throughOctober. These areas included Meadow River, Upper and Lower Meadow, SouthsideCrags, and Cotton Top.Surveys were not collected on National Park Service, Army Corps of Engineers, orBureau of Land Management land due to grant time constraints. Instead, surveys wereadministered beyond their borders at trailheads, which allowed access to climbers atthese locations without disturbing or impacting public lands. These areas includeKaymoor, Bubba City, Beauty Mountain, and Summersville Lake. Surveys wereadministered throughout the day two to three days per week May through Octoberdepending on weather conditions.Additional survey collection sites were located at American Alpine Club Campground,Chestnut Creek Campground, Waterstone Outdoors, and local guide service New River4
Mountain Guides from May to November. Surveys were also administered at two publicclimbing events: the Craggin’ Classic in October and the New River Gorge boulderingcompetition in November.In all, 607 persons completed the survey with nine declining to take the survey due totime constraints, weather, or travel plans. Based on comparisons to studies in otherclimbing areas, observation counts, and familiarity with the region, the New RiverAlliance of Climbers and Access Fund estimate there are approximately 6,000 uniqueclimbers visiting the New River Gorge. Using 95% confidence levels, and a 4%confidence interval, 546 surveys were needed for a statistical sample.Data CleaningPrior to the analysis, specific changes were made to the data to provide conservativeeconomic impact estimates while reducing the effect of points of influence that couldinflate estimates. Seven surveys were dropped due providing no economic expenditures.Eight cases were dropped due to providing no zip codes, which prevented identifyingthem as local or non-local residents, and nine cases were excluded as they were localresidents (see methods summary for further detail). One case who reported a trip lengthexceeding or equal to 183 days (half a year) was removed as they met the definition ofliving in the study area. Eleven cases were dropped as their length of visit was outsidethe normal distribution (greater than 31 days) for the sample. Respondents indicatingthey paid for groups of 10 or larger (four cases) were also dropped to reduce the chanceof inflated means. Eleven cases were dropped as they did not identify their group size.This left a total of 556 cases to be used in the analysis.Mean Expenditure CreationThe study follows established outdoor recreation analysis guidelines utilized by theNational Forest Service, who is a respected expert in economic impact analysis. First,attendees were sorted into locals (local residents living in study area zip codes) and nonlocals (non-local residents living outside study area zip codes). Note that non-localexpenditures are used to estimate the economic impact described later in this report.Local expenditures, while important, are not indicative of economic impact as theirfunds are already located within the local economy and are redirected as a result of theactivity being studied. Local expenditures are not reported in this analysis and areexcluded from the economic impact estimates. In all, nine respondents had describedthemselves as local residents.Second, mean expenditures were established for both non-local and local residentsbased on their self-reported expenditures on the following categories: camping,hotel/motels, rental cabins/AIRBnB, gasoline, fast food, dine-in restaurants, groceries,non-food retail purchases, climbing gear retail purchases, taxi/transports, and rentalcars. Separate expenditures were tracked for those inside the study area and thoseoutside the study are but still within West Virginia. As part of preparing these means,individual respondent expenditures were adjusted for group size by dividing therespondent’s reported expenditures by their reported group size plus one to include the5
respondent based on question wording in the survey. Prior to estimating means, anyexpenditures above 500 were recoded as missing as a precaution againstoverestimation. Inside the study area, this included three cases in rental cabins, one casein gas expenditures, one case in full-service dining, and one case in gas station food.Outside the study area, this included one case in gasoline purchases and one case ingroceries. Then, individual respondent expenditures reported higher than the thirdstandard deviation were marked as missing data. This technique again addressesoverestimating economic impact and provides reliable, conservative means.Visitation EstimationFor this study, a visit is defined as departing from a home residence outside the studyarea, visiting the study area with the primary interest of rock climbing, and then endingthe visit by returning home. Visits in this study can be made by the same climber morethan once per year, as it is very common for climbers to make repeated visits to the sameclimbing areas in a single year. Climbers may also visit more than one climbing area pertrip due to crowding or weather, or they may remain in a single climbing area.Previous research (Maples and associates, manuscript in progress) is the only knownformal climbing visitation estimate for the study area. This study estimated there werejust shy of 200,000 visits (based on a population of 6,000 climbers multiplied by meanvisits to a list of major climbing areas detailed later in the report). However, thisestimate does not make any account for a single multi-climbing area visits to the studyarea and allowed for the option of visiting more than one climbing area on a single trip.To reduce risk of overestimating economic activity, the study utilizes a conservativeestimate of 140,000 visits per year. In conversations with New River Alliance ofClimbers and Access Fund, they confirmed this was a reasonable and conservativeestimate to use for the study. New River Alliance of Climbers estimated that 5% ofclimbers in the population live in the study region (around 300 climbers), and theresearch team attributed 20,000 visits (or twice the mean of visiting climbers to theregion) to persons living in the study region.IMPLAN AnalysisMean expenditures (having now accounted for group sizes and points of influence) andconservative visitation estimates are built within IMPLAN, an industry-leadingeconomic impact calculation system, to explore how non-local expenditures shape thelocal economy. IMPLAN uses input-output modeling to establish economic impactacross three measures: output, value added, and job income. These are defined andexplained later in the report. IMPLAN also bases its outcomes on how specific industriesbehave within the study area. These common categories are explored in detail later inthe report and are supported by prior research.As part of the analysis, local purchasing percentages are set at 100% which isappropriate for this kind of study. Where possible, retail purchases are modeled back totheir source (e.g. gasoline is modeled back to refineries). Where less is known about theretail purchases (e.g. general retail), retail purchases are margined to give a more6
nuance perspective on their impact while leaking the economic activity created bytransportation, manufacturing, and the like. The researchers make the assumption thatclimbing gear purchases are expressly made to pursue climbing in the New River Gorgewhich supports including them in the analysis, and these retail purchases are alsoappropriately margined.Visitation estimates are modeled in IMPLAN to examine economic impact. In IMPLAN,means are treated as a typical single visit, and the number of estimated visits areincluded when setting up the activity being modeled. For this study, 120,000 visitsattributed to persons living outside the study area are used in modeling.Study Area SummaryEconomic impact study areas are built around the location where the activity beingstudied occurs and the cities and towns where visitors are most apt to spend funds aspart of their trip. For this analysis, three West Virginia counties (Fayette, Nicholas, andRaleigh) are being used as the study area. This study area was constructed as a result oflocating and examining economic activities and services are available in the region,major roadways, and climbing destinations, as well as open and informal interviewswith climbers who are familiar with the area. Conversations with New River Alliance ofClimbers also helped inform selecting this study area.Table One lists descriptive economic indicators for the study area. This study area’seconomy includes 4.6 billion in gross regional product, over 4.8 billion in personalincome, over 63,136 workers in nearly 218 industries. The county covers approximately1,920 square miles and holds an estimated 146,235 residents and 59,991 households.Table One. Economic Indicator Summary of Study AreaIndicatorStudy Area EstimatesGross Regional Product (in 1,000s) 4,665,322,455Total Personal Income (in 1,000s) 4,867,642,000Total Employment63,136Number of Industries218Land Area (Square Miles)1,920Population146,235Total Households59,9917
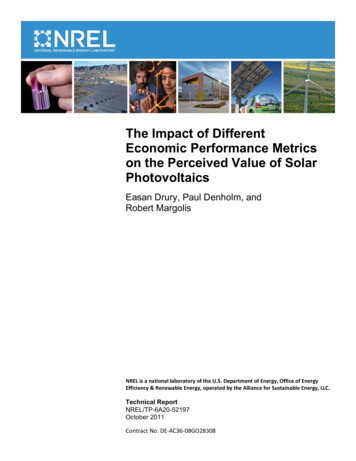
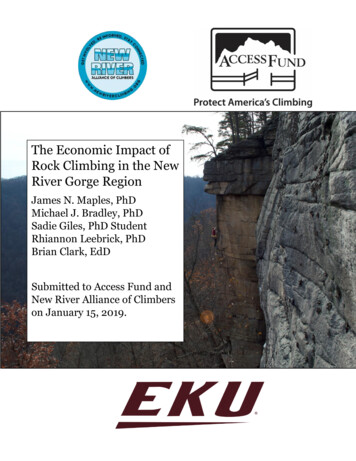
Table Two describes the major employment sectors (based on number of employees)within in the study area. The table includes government-funded jobs at the local, state,and Federal levels, which are occasionally excluded in tables on employment structure.In this study area, the largest employment sectors are in public education (2,860 jobsand 160 million in labor income), followed by fast food (limited-services, 2,553 jobsand over 51 million in labor income), and general retail (2,140 jobs, 45 million inlabor income). Other important employers are dine-in (full service) restaurants,physician offices, wholesale trade, hospitals, and local, state, and Federal positions.Table Two. Major Employment Summary of Study AreaEmployment TypeJobs RepresentedLabor IncomeLocal government, education2,860 160,572,000Limited-service restaurants2,553 51,472,160Retail, general merchandise2,140 62,048,160Full-service restaurants2,077 45,004,200Offices of physicians2,014 147,837,800Wholesale trade1,987 120,377,400Hospitals1,942 115,235,300Federal government, non-military1,792 186,736,400Local government, non-education1,605 69,596,980State government, non-education1,596 85,952,300Figure One is a map of the study area and its greater region. Major climbing areas arenoted in red. The New River Gorge National River is noted in green. Note that climbingis located in both Fayette and Nicholas counties, which include city destinations ofFayetteville and Summersville. Raleigh (which includes the City of Beckley) does notcontain climbing, but represents a common destination for economic activity.This map helps indicate the rationale behind one important difference in recentNational Park economic impact modeling and the present study’s use of study areas.National Park research included Fayette, Nicholas, Raleigh, and Summers counties,while the present study excludes Summers. Summers represents an important part ofunderstanding the New River National River’s economic activity based on geographyand economy. However, climbers are far more apt to use economic services in thenorthern end of the National River, particularly Summersville, Oak Hill, Fayette, andBeckley as these are more centrally located around the preponderance of climbingopportunities. Recall also that around half the climbing studied in this report occurs inthe national park.8
9
Visitation EstimatesTable Three (next page) introduces visitation estimates to the study area from aprevious study (Maples and associates, manuscript in progress) on the New River Gorgeclimbing community. The table describes mean visits to major crags (or climbing areas)in the study region based on New River Alliance of Climbers and Access Fund’spopulation estimate of 6,000 unique climbers using the study area, five percent of whichlive in the study area. At this time, there are no other known estimations of climbingvisitation in the study area. The study’s authors estimated visitation at just under200,000 visits per year. However, this estimate allowed for visits to more than one cragduring a climbing trip, meaning that the estimate is high. Climbers may stay at oneclimbing crag on a visit (working on a project route, for example) or they may travel tomultiple crags on a visit (e.g. allowing for different climbing levels in the group oraddressing multiple projects). Weather and crowding may also shape these behaviors.In conversations with New River Alliance of Climbers and Access Fund, the researchteam elected to model expenditures on a more conservative estimate of 140,000climbing visits per year. To address (and remove) local visits from this estimate, theresearchers worked with New River Alliance of Climbers’ estimate that 5% of the 6,000unique climbers visiting the New were local residents (something reinforced by thisstudy’s response rates). The researchers allowed locals twice the mean visits of nonlocals (20,000 visits in all), leaving a visitation estimate of 120,000 visits per year to thestudy area by persons living outside the study area.10
Table Three. Climbing Visitation Estimates to Study Area in 94.9749Cotton Top60000401.123.4246,708.543Bubba City: Sandstonia60000641.344.0228,020.101Bubba City (excluding Sandstonia)60000640.743.4644,432.161Junkyard Area600001002.276.78113,628.14North Bridge Wall600001000.635.8953,768.844Bridge Buttress600001002.077.99012,422.11Ambassador Buttress6000050.070.411407.0352Fern Buttress60000201.363.1738,170.854Endless Wall600001254.629.82827,723.62Beauty Mountain60000892.106.46612,587.94Keeney's Buttress60000190.060.958361.809Lower Meadow60000501.624.1329,738.693Upper Meadow60000402.264.66813,537.69South Side Crags60000501.454.2928,683.417Carnifex Ferry6000020.030.205165.8291Gauley Crag6000030.030.239165.8291Ambassador Buttress6000050.020.274120.603Summersville Lake Long Point60000380.612.4043,633.166Summersville Lake Main Area60000302.613.9221,5648.24Summersville Lake Whipporwill60000501.504.2768,984.925Summersville Lake Lost World60000100.090.681527.6382Domino Point6000070.050.426316.5829Needle's Eye Park60000150.070.808437.1859Hawks Nest (Bouldering)60000300.642.6313,844.221Short Creek (Bouldering)60000500.382.8802,261.307Meadow Top (Bouldering)Other areas in the Region 83.8593,467.337Climbing CragNMinMaxMeanSouth Nuttall6000020Kaymoor60000Butcher's Branch6000Sunshine Buttress199,703.511
Mean Expenditures and IMPLAN CategoriesTable Four describes mean expenditures within the study area for non-local residentclimbers on visits to the New River Gorge. The table breaks expenditures down bycategories (e.g. lodging, transportation) and by specific categories that are modeled inIMPLAN. Overall, a few expenditures stand out. First is camping (average of 16.29 pertrip) in the study area. Based on other areas measured (hotel/motels and cabin rentals),camping was the far more popular lodging selection. Next, climbers spent on average 28.88 in the study area while moving among climbing areas. Third, climbers spent alarge portion of their expenditures in food service, particularly full-service restaurants(which include wait staff and generally more jobs than fast food). In all, climbers spentaround 100 per visit to the study area.Table Four also links the study’s mean expenditure categories to IMPLAN modelingcategories. Lodging options included camping, hotel/motels, and rental cabins.Camping includes any camping opportunities in the study area, including free camping.Hotel and motel includes any paid lodging in a room for rent scenario. Rental cabinsinclude the many rental cabins and homes in the study area, as well as AirBnBs.Transportation includes gasoline, taxis, and rental cars. Gasoline includes gasolinepurchases at gas stations. This category is modeled as a commodity chain back torefineries rather than as a gas station retailer to provide a more accurate depiction ofprofit margins in the chain.Table Four. Mean Expenditures for Non-local Resident Climbers Inside theStudy Area while Visiting the New River Gorge to ClimbCategoryIMPLANObs Mean St DevMinMaxCategoryLodgingCamping537 16.29 16.07 0.00 64.00500Hotel and motels548 0.826.76 0.00 75.00499Rental cabins/houses/Airbnb533 0.705.63 0.00 70.00500TransportationGasoline537 26.88 23.86 0.00 100.00156Taxi/Transport555 0.061.09 0.00 25.00412Rental Car547 0.071.05 0.00 19.67442Food PurchasesFull-service restaurant517 21.52 20.92 0.00 93.33501Limited-service restaurant545 6.0510.43 0.00 50.00502Convenience/gas station food541 5.626.88 0.00 25.00402Groceries535 8.5813.82 0.00 70.00400Retail purchasesRetail non-food purchases546 3.899.17 0.00 50.00405Climbing gear retail purchases538 10.42 22.92 0.00 125.00404Total Mean Expenditures Per Visit 100.9012
Food purchases covers fast food, dine-in restaurants, gas station food purchases, andgroceries. Fast food (e.g. McDonalds) is modeled as limited-service, while dine-inrestaurants (which includes wait staff) is modeled as full-service. Convenience foodincludes purchasing snacks at gas stations. Groceries include buying food at food andbeverage retail stores.Retail purchases included general non-food purchases and climbing gear. General retail(such as Walmart) is included as general non-food retail. In some economic impactstudies, these purchases can be modeled as commodity chains. However, in this study,this was not possible as the exact kinds of goods being purchased is unknown, so it isinstead margined. Climbing retail purchases (also margined) includes climbing gearpurchased in the study area. The research team makes the assumption that these gearpurchases were for use in the study area, which warrants their inclusion.Table Five reflects non-local resident climber expenditures outside the study area butinside West Virginia as a result of trips to the New River Gorge. These indicate travellingfunds required to get to the New River Gorge. Overall, non-local climbers are spendingaround 17.47 outside the study area but inside West Virginia on their way to and fromthe New River Gorge. Note that these expenditures are not modeled in the economicimpact analysis and are included only for reference purposes.Table Five. Mean Expenditures for Non-local Resident ClimbersOutside the Study Area but within West Virginia while Visiting theNew River Gorge to ClimbCategoryObs Mean StDev MinMaxLodgingCamping547 0.312.13 0.00 25.00Hotel and motels553 0.122.36 0.00 55.00Rental cabins/houses554 0.000.11 0.00 2.50TransportationGasoline551 11.13 20.33 0.00 100.00Taxi/Transport554 0.00 0.00 0.00 0.00Rental Car554 0.00 0.00 0.00 0.00Food PurchasesFull-service restaurant549 1.294.99 0.00 40.00Limited-service restaurant549 1.985.37 0.00 40.00Convenience/gas station food550 1.203.35 0.00 20.00Groceries546 0.914.26 0.00 35.00Retail purchasesRetail non-food purchases545 0.181.29 0.00 15.00Climbing gear retail purchases550 0.353.59 0.00 50.00Total Mean Expenditures Per Visit 17.4713
Economic Impact TerminologyIn the following paragraphs, we use three terms to describe economic impact: directeffect, indirect effect, and induced effect. Direct effect is the economic result createdby the money spent as a result of visitors being present in the study area. This directeffect can generate further change in the local economy via indirect and induced effects.Indirect effect is economic activity created when local businesses purchase goods andservices from other local industries as a result of the direct effect. For example, indirecteffect could include a local restaurant buying vegetables to create future meals for sale.Finally, induced effect is the estimated expenditures by local households andemployees as a result of the initial direct impact. For example, a local restaurantemployee may choose to spend his/her wages at another local business, creatingadditional rounds of local economic activity.These three terms can also be further divided by their employment impact in the region,value added to the local economy, and output. Labor income impact is measured bythe estimated labor income created by the economic activity in the region. Labor incomeimpact is a conservative estimate of economic impact and is the approach highlighted inthis report. Value added indicates the true economic wealth added to the localeconomy after subtracting the cost of inputs needed to conduct everyday business. Valueadded includes expenditures in profit, employment compensation, and taxes. Finally,output is value added plus total revenues and sales from economic activity.Economic Impact EstimatesBased on non-local mean expenditures per visit ( 100.90, see Table Four) and non-localvisitation estimates of 120,000 visits per year (see Table Three and its relateddiscussion), the researchers estimate that non-local climbers spend an estimated 12.1 million in the study area per year as a result of their visiting to climb.Table Six describes economic impact estimates for non-local resident visits to the studyarea to climb. The table includes three measures of economic impact which aredescribed in the previous section. Annual climbing expenditures by non-localvisitors to the area support an estimated 168 full or part time jobs in thestudy area. Additionally, non-local climber visitor expenditures supports 6.3million in labor income in the study region.Table Six. Economic Impact Summary of Non-localClimbing in the Study AreasImpact 125.7 4,725,520 6,155,659 9,720,907Indirect14.0 566,621 961,229 1,810,501Induced28.6 1,016,490 1,908,891 3,317,223Total Effect168.2 6,308,631 9,025,779 14,848,63114
Table Seven details employment industries where climber expenditures make themost notable impact. Job creation estimates in IMPLAN are based on portions of jobscreated or supported by the presence of expenditures. This includes both full and parttime jobs, and can also include entrepreneurs and proprietors.Overall, expenditures create the most support for jobs in dine-in restaurants (around 55full or part-time jobs) and convenience stores (an estimated 25 jobs). Campgrounds, themost popular overnight lodging location for climbers in this study, saw support for anestimated 11 jobs, as did retail climbing gear stores. Other areas included wholesaletrade (nine jobs), grocery stores (five jobs), general retailers (around three jobs), realestate (two jobs), and hospitals (around one job).It is important to note that these job estimates are the result of climbers’ initialexpenditures as well as economic activity created by those dollars as they move throughthe economy.Table Seven. Industries Most Affected by Rock Climbing ExpendituresEmployment TypeJobs RepresentedLabor IncomeFull-service restaurants55.8 1,224,742Retail, gasoline stores25.0 699,705Campgrounds/rental cabins11.7 1,758587Limited-service restaurants11.4 232,663Retail, sporting goods11.4 205,514Wholesale trade9.2 570,360Retail, grocery stores5.0 145,625Retail, general merchandise2.9 85,261Real estate2.6 31,013Hospitals1.6 96,725Table Eight also describes the tax benefits of non-local climbing visitation Visitorssupported an estimated 1.2 million in state and local taxes and another 1.1 million inFederal taxes.Table Eight. Annual Estimated Taxation Generated byTax TypeState/Local AmountFederal A
Appalachia and contains over 3,000 climbing and bouldering routes spread across over 60 miles of cliff line. About half the climbing in this region is on National Park Service, Bureau of Land Management, and/or Army Corps of Engineers public lands. No study has exclusively focused on the economic im