Transcription
The correct bibliographic citation for this manual is as follows: Gupta, Saurabh. 2018. Artificial Intelligence withSAS : Special Collection. Cary, NC: SAS Institute Inc.Artificial Intelligence with SAS : Special CollectionCopyright 2018, SAS Institute Inc., Cary, NC, USAAll Rights Reserved. Produced in the United States of America.For a hard-copy book: No part of this publication may be reproduced, stored in a retrieval system, or transmitted, inany form or by any means, electronic, mechanical, photocopying, or otherwise, without the prior written permissionof the publisher, SAS Institute Inc.For a web download or e-book: Your use of this publication shall be governed by the terms established by thevendor at the time you acquire this publication.The scanning, uploading, and distribution of this book via the Internet or any other means without the permission ofthe publisher is illegal and punishable by law. Please purchase only authorized electronic editions and do notparticipate in or encourage electronic piracy of copyrighted materials. Your support of others’ rights is appreciated.U.S. Government License Rights; Restricted Rights: The Software and its documentation is commercial computersoftware developed at private expense and is provided with RESTRICTED RIGHTS to the United StatesGovernment. Use, duplication, or disclosure of the Software by the United States Government is subjectto the license terms of this Agreement pursuant to, as applicable, FAR 12.212, DFAR 227.7202-1(a), DFAR227.7202-3(a), and DFAR 227.7202-4, and, to the extent required under U.S. federal law, the minimum restrictedrights as set out in FAR 52.227-19 (DEC 2007). If FAR 52.227-19 is applicable, this provision serves as notice underclause (c) thereof and no other notice is required to be affixed to the Software or documentation. The Government’srights in Software and documentation shall be only those set forth in this Agreement.SAS Institute Inc., SAS Campus Drive, Cary, NC 27513-2414August 2018SAS and all other SAS Institute Inc. product or service names are registered trademarks or trademarks of SASInstitute Inc. in the USA and other countries. indicates USA registration.Other brand and product names are trademarks of their respective companies.SAS software may be provided with certain third-party software, including but not limited to open-source software,which is licensed under its applicable third-party software license agreement. For license information about thirdparty software distributed with SAS software, refer to http://support.sas.com/thirdpartylicenses.
Table of ContentsNavigating the Analytics Life Cycle with SAS Visual Data Mining and Machine LearningBrett Wujek, SAS, Susan Haller, SAS, Jonathan Wexler, SASManaging the Expense of Hyperparameter AutotuningPatrick Koch, SAS, Brett Wujek, SAS, Oleg Golovidov, SASAnalyzing Text In-Stream and at the EdgeSimran Bagga, SASHarvesting Unstructured Data to Reduce Anti-Money Laundering (AML) Compliance RiskAustin Cook, SAS, Beth Herron, SASInvoiced: Using SAS Text Analytics to Calculate Final Weighted Average PriceAlexandre Carvalho, SASUsing SAS Text Analytics to Assess International Human Trafficking PatternsTom Sabo, SAS, Adam Pilz, SASBiomedical Image Analytics Using SAS Viya Fijoy Vadakkumpadan, SAS, Saratendu Sethi, SASHow to Build a Recommendation Engine Using SAS Viya Jared Dean, SAS
Free SAS e-Books:Special CollectionIn this series, we have carefully curated a collection of papers that introducesand provides context to the various areas of analytics. Topics coveredillustrate the power of SAS solutions that are available as tools fordata analysis, highlighting a variety of commonly used techniques.Discover more free SAS for additional books and resources.SAS and all other SAS Institute Inc. product or service names are registered trademarks or trademarks of SAS Institute Inc. in the USA and other countries. indicates USA registration.Other brand and product names are trademarks of their respective companies. 2017 SAS Institute Inc. All rights reserved. M1673525 US.0817
About This BookWhat Does This Collection Cover?The broad definition of Artificial Intelligence (AI) is the simulation of human intelligence by machines. These machines canunderstand requests in natural (human) language, learn, observe, reason and self-correct. AI is particularly adept at processing andanalyzing large amounts of data to provide targeted courses of action for human consideration. It applies machine learning, deeplearning, and natural language processing (NLP) to solve actual problems. SAS embeds AI capabilities in our software to delivermore intelligent, automated solutions that help you boost productivity and unlock new possibilities.The papers included in this special collection demonstrate how cutting-edge AI techniques can benefit your data analysis.The following papers are excerpts from the SAS Global Users Group (SUGI) Proceedings. For more SUGI and SAS GlobalForum Proceedings, visit the online versions of the Proceedings.More helpful resources are available at support.sas.com and sas.com/books.We Want to Hear from YouSAS Press books are written by SAS users for SAS users. We welcome your participation in their development and yourfeedback on SAS Press books that you are using. Please visit sas.com/books to Sign up to review a bookRequest information on how to become a SAS Press authorRecommend a topicProvide feedback on a bookDo you have questions about a SAS Press book that you are reading? Contact the author through saspress@sas.com.
vi Artificial Intelligence with SAS: Special Collection
Foreword“AI has been an integral part of SAS software for years. Today we help customers in every industry capitalizeon advancements in AI, and we’ll continue embedding AI technologies like machine learning and deep learningin solutions across the SAS portfolio.” Jim Goodnight, CEO, SASArtificial intelligence is a topic that is on the mind of almost all of our customers at SAS. We are frequentlydiscussing and evaluating the best way to leverage AI within an organization and how to help companies makesense of the volume and variety of data they have available and waiting to be used. Whereas in the past, thisdata may have taken the form of structured tabular data sets, today we are embracing opportunities with text,image and video data as well.We are also frequently researching and developing the best ways to make artificial intelligence easier to use andeasier to deploy into production. As our Chief Operating Officer, Dr. Oliver Schabenberger says, data withoutanalytics is value not yet realized. Today, powerful AI is augmenting analytics in every area, and helping tomaximize the value of the analytic tools and solutions that SAS has been championing for the last 42 years.SAS delivers AI solutions that incorporate many different techniques, including machine learning, computervision and natural language processing, and several ground breaking papers have been written to demonstratethese. We have carefully selected a handful from recent SAS Global Forum papers which illustrate how SAS isadding capabilities to our tools and solutions that help customers build their own AI solutions; and examples ofAI solutions using our tools.I hope you enjoy the following papers and that they further guide you down your path in building and deployingAI systems.Navigating the Analytics Life Cycle with SAS Visual Data Mining and Machine LearningBrett Wujek, SAS, Susan Haller, SAS, Jonathan Wexler, SASExtracting knowledge from data to enable better business decisions is not a single step. It is an iterative lifecycle that incorporates data ingestion and preparation, interactive exploration, application of algorithms andtechniques for gaining insight and building predictive models, and deployment of models for assessing newobservations. The latest release of SAS Visual Data Mining and Machine Learning on SAS Viya accommodates each of these phases in a coordinated fashion with seamless transitions and common data usage.An intelligent process flow (pipeline) experience is provided to automatically chain together powerful machinelearning methods for common tasks such as feature engineering, model training, ensembling, and modelassessment and comparison. Ultimate flexibility is offered through incorporation of SAS code into thepipeline, and collaboration with teammates is accomplished using reusable nodes and pipelines. This paperprovides an in-depth look at all that this solution has to offer.Managing the Expense of Hyperparameter AutotuningPatrick Koch, SAS, Brett Wujek, SAS, Oleg Golovidov, SASMachine learning predictive modeling algorithms are governed by “hyperparameters” that have no cleardefaults agreeable to a wide range of applications. The depth of a decision tree, number of trees in a forest or agradient boosting tree model, number of hidden layers and neurons in each layer in a neural network, anddegree of regularization to prevent overfitting are a few examples of quantities that must be prescribed.Determining the best values of machine learning algorithm hyperparameters for a specific data set can be adifficult and computationally expensive challenge. The recently released AUTOTUNE statement and autotuneaction set in SAS Visual Data Mining and Machine Learning automatically tune hyperparameters of modelingalgorithms by using a parallel local search optimization framework to ease the challenges and expense ofhyperparameter optimization. This paper discusses the trade-offs that are associated with the differentperformance-enhancing measures and demonstrates tuning results and efficiency gains for each.
viii ForewordAnalyzing Text In-Stream and at the EdgeSimran Bagga, SASAs companies increasingly use automation for operational intelligence, they are deploying machines to read,and interpret in real time, unstructured data such as news, emails, network logs, and so on. Realtime streaminganalytics maximizes data value and enables organizations to act more quickly. Companies are also applyingstreaming analytics to provide optimal customer service at the point of interaction, improve operationalefficiencies, and analyze themes of chatter about their offerings. This paper explains how you can augment realtime text analytics (such as sentiment analysis, entity extraction, content categorization, and topic detection)with in-stream analytics to derive real-time answers for innovative applications such as quant solutions atcapital markets, fake-news detection at online portals, and others.Harvesting Unstructured Data to Reduce Anti-Money Laundering (AML) Compliance RiskAustin Cook, SAS, Beth Herron, SASThe financial services industry has called into question whether traditional methods of combating moneylaundering and terrorism financing are effective and sustainable. Heightened regulatory expectations, emphasison 100% coverage, identification of emerging risks, and rising staffing costs are driving institutions tomodernize their systems. One area gaining traction in the industry is to leverage the vast amounts ofunstructured data to gain deeper insights. From suspicious activity reports (SARs) to case notes and wiremessages, most financial institutions have yet to apply analytics to this data to uncover new patterns and trendsthat might not surface themselves in traditional structured data. This paper explores the potential use cases fortext analytics in AML and provides examples of entity and fact extraction and document categorization ofunstructured data using SAS Visual Text Analytics.Invoiced: Using SAS Text Analytics to Calculate Final Weighted Average PriceAlexandre Carvalho, SASSAS Contextual Analysis brings advantages to the analysis of the millions of Electronic Tax Invoices (NotaFiscal Electrônica) issued by industries and improves the validation of taxes applied. This paper highlights twoitems of interest in the public sector: tax collection efficiency and the calculation of the final weighted averageconsumer price. The features in SAS Contextual Analysis enable the implementation of a tax taxonomy thatanalyzes the contents of invoices, automatically categorizes the product, and calculates a reference value of theprices charged in the market. The text analysis and the generated results contribute to tax collection efficiencyand result in a more adequate reference value for use in the calculation of taxes on the circulation of goods andservices.Using SAS Text Analytics to Assess International Human Trafficking PatternsTom Sabo, SAS, Adam Pilz, SASThis paper showcases a strategy of applying SAS Text Analytics to explore Trafficking in Persons (TIP)reports and apply new layers of structured information. Specifically, it is used to identify common themesacross the reports, use topic analysis to identify a structural similarity across reports, identifying source anddestination countries involved in trafficking, and use a rule-building approach to extract these relationshipsfrom freeform text. Subsequently, these trafficking relationships across multiple countries in SAS VisualAnalytics, using a geographic network diagram that covers the types of trafficking as well as whether thecountries involved are invested in addressing the problem. This ultimately provides decision-makers with bigpicture information about how to best combat human trafficking internationally.
Foreword ixBiomedical Image Analytics Using SAS Viya Fijoy Vadakkumpadan, SAS, Saratendu Sethi, SASBiomedical imaging has become the largest driver of health care data growth, generating millions of terabytesof data annually in the US alone. With the release of SAS ViyaTM 3.3, SAS has, for the first time, extended itspowerful analytics environment to the processing and interpretation of biomedical image data. This newextension, available in SAS Visual Data Mining and Machine Learning, enables customers to load, visualize,process, and save health care image data and associated metadata at scale. This paper demonstrates the newcapabilities with an example problem: diagnostic classification of malignant and benign lung nodules that isbased on raw computed tomography (CT) images and radiologist annotation of nodule locations.How to Build a Recommendation Engine Using SAS Viya Jared Dean, SASFactorization machines are a common technique for creating user item recommendations, there is evidence theygenerate double digit increases in engagement and sales. SAS has had recommendation methods for many yearsincluding market basket analysis, K-nearest neighbors (KNN), and link analysis, along with other techniques forcreating a next best offer. This paper focuses on creating recommendations using factorization machines andSAS Viya 3.3. It describes each step of the process: 1) loading data into SAS Viya; 2) building a collaborativefiltering recommendation model using factorization machines; 3) deploying the model for production use; and4) integrating the model so that users can get on-demand results through a REST web service call. These stepsare illustrated using the SAS Research and Development Library as an example. The library recommends titlesto patrons using implicit feedback from their check-out historyWe hope these selections give you a useful overview of the many tools and techniques that are available in theSAS AI platform.Additionally, you can visit our SAS AI Solutions webpages to learn more about how these solutions are helpingin some very cool crowdsourcing projects and how they can support your business needs.We look forward to hearing from you – your questions as well as your experiences – so we together cancontinue to make AI pragmatic and results driven.Saurabh Gupta, Director, Advanced Analytics and Artificial Intelligence Product ManagementSaurabh Gupta, Director of Advanced Analytics and Artificial IntelligenceProduct Management, SAS InstituteDuring his tenure with SAS, Saurabh has overseen and driven product strategy forthe Advanced Analytics, Artificial Intelligence, and Retail solutions portfolios.Saurabh graduated with a Ph.D. in Operations Management from The Universityof Texas at Austin. He has since devoted more than 19 years to specializing inlarge-scale systems analysis, design, and implementation in areas such as priceoptimization, supply chain management, and demand management. As a trueadvocate for leveraging his knowledge and skills to solve customer pain points,his work has received recognition from the journals of: Management Science andProduction and Operations Management.
x Foreword
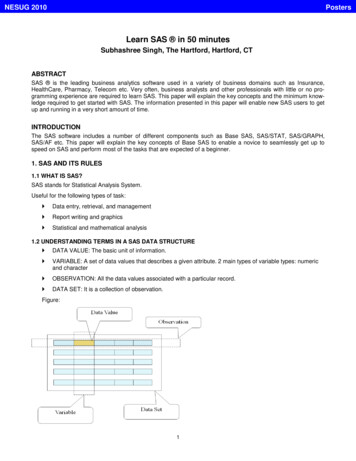
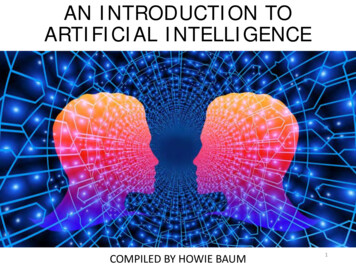
Paper SAS2246-2018Navigating the Analytics Life Cycle withSAS Visual Data Mining and Machine Learning on SAS Viya Brett Wujek, Susan Haller, and Jonathan Wexler, SAS Institute Inc.ABSTRACTExtracting knowledge from data to enable better business decisions is not a single step. It is an iterativelife cycle that incorporates data ingestion and preparation, interactive exploration, application ofalgorithms and techniques for gaining insight and building predictive models, and deployment of modelsfor assessing new observations. The latest release of SAS Visual Data Mining and Machine Learning onSAS Viya accommodates each of these phases in a coordinated fashion with seamless transitions andcommon data usage. An intelligent process flow (pipeline) experience is provided to automatically chaintogether powerful machine learning methods for common tasks such as feature engineering, modeltraining, ensembling, and model assessment and comparison. Ultimate flexibility is offered throughincorporation of SAS code into the pipeline, and collaboration with teammates is accomplished usingreusable nodes and pipelines. This paper provides an in-depth look at all that this solution has to offer.INTRODUCTIONWith the ubiquity of data these days, companies are racing to ensure that they can apply analytics toderive the insight necessary to provide better products and services, and ultimately to keep pace with, orsurpass, the competition. They know they need to “do machine learning,” but they frequently don’t reallyknow what that entails. Their focus often turns directly to applying the powerful modeling algorithms totheir data, resulting in individual eureka moments but neglecting the numerous phases of transformingdata into business value in a sustainable manner.Figure 1. Phases of the Analytics Life CycleThese important phases make up what is referred to as the analytics life cycle, as illustrated in Figure 1,which consists of the following: Data ingestion: consuming, merging, and appending data from potentially multiple data sourcesand formatsData preparation: cleaning, transforming, aggregating, and creating columns as necessary andappropriate to address the specified business problemExploration: profiling, analyzing, and visualizing your data to gain initial insight andunderstanding of variable distributions and relationships1
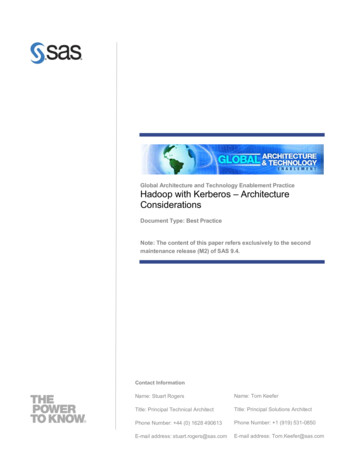
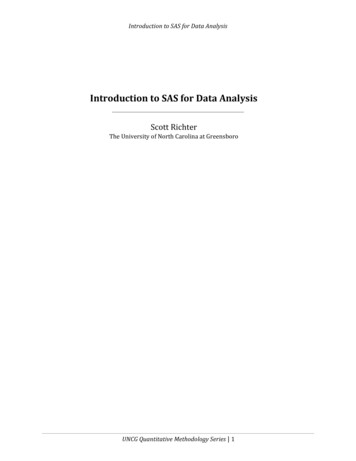
Modeling: exercising feature engineering techniques, applying algorithms to identify segmentsand build representations for classifying new observations and making predictions, andassessing and tuning the generated modelsModel deployment: selecting champion models and promoting them for use in a productionenvironment to aid in making effective business decisionsModel management: maintaining a version-controlled repository of models, incorporating theminto decision-making processes, monitoring their performance over time, and updatingthem as necessary to ensure that they are adequately and accurately addressing yourbusiness problemImplementing and adhering to a process that accommodates the entire analytics life cycle is a significantundertaking, but a necessary one. Certainly, the public marketplace of analytics packages in open-sourcelanguages provides access to an ample supply of algorithms and utilities for data manipulation,exploration, and modeling. But typical business environments require more than individuals working onmachine learning applications in silos and using a scattered collection of tools with little governance, lackof data and results lineage, inconsistent formats, collaboration bottlenecks, and hurdles to deployment. Inthe remainder of this paper, you will see how SAS Visual Data Mining and Machine Learning provides acomprehensive framework of capabilities to navigate this analytics life cycle through a seamlessintegration of interfaces that focus on each of the aforementioned phases, built on the foundation of SASViya. A case study that uses SAS Visual Data Mining and Machine Learning to address the problem oftelecommunications customer attrition is presented in the Appendix.THE FOUNDATION: SAS VIYAAn environment for end-to-end analytics relies on a solid foundation that can provide common access todata, analytics, and results in an efficient, consistent, and open manner. For SAS Visual Data Mining andMachine Learning, that foundation is provided by SAS Viya. SAS Viya is an extension of the SAS platformthat offers a distributed, in-memory data access layer in which analytic “actions” can be performed in anefficient distributed and parallel manner through the SAS Cloud Analytics Services (CAS) executionengine. Figure 2 illustrates the architecture, which is specifically designed to serve as an extensible andopen framework in which data can be accessed from a variety of common sources and actions can beinvoked in a language-agnostic fashion, and upon which custom and domain-specific applications can beestablished to exploit the in-memory efficiency and simple and common accessibility of data, actions, andresults.Figure 2. SAS Viya: An Extension of the SAS Platform2
SAS Visual Data Mining and Machine Learning is one such application; it assembles a collection of datapreparation and modeling actions that are presented through integrated interfaces that are speciallydesigned for each phase of the analytics life cycle, as shown in Figure 3. When your work in one phase iscomplete, you can directly progress to the next phase, avoiding any hassle (and error-prone process) oftransferring (and possibly translating) your data or results, or of launching new applicationsindependently. Because the analytics are performed by invoking actions in CAS, the data preparation andmodeling functions can also be executed by writing programs in SAS or other languages for which an APIwrapper has been written (Python, R, Java, Lua, and REST). A good example of how you can work on aparticular machine learning application across multiple interfaces and programming languages is offeredin Wexler, Haller, and Myneni (2017). This is all made possible by SAS Viya providing the common dataaccess layer and open access to a consistent set of analytics actions.Figure 3. SAS Visual Data Mining and Machine Learning Capabilities and InterfacesOne means of employing the capabilities that comprise SAS Visual Data Mining and Machine Learning isthrough an integrated collection of actions in a unified web interface that is designed specifically tofacilitate the end-to-end analytics life cycle, as depicted in Figure 4. The remainder of this paper navigatesthrough the analytics life cycle with SAS Visual Data Mining and Machine Learning via the user interfacesthat are associated with these actions.Figure 4. Menu of Actions to Access SAS Visual Data Mining and Machine Learning Capabilities3
DATA INGESTION AND PREPARATIONMachine learning applications should be developed and evolve as solutions to well-defined businessproblems. That is, assuming you have (or can get) the necessary data, what are the most importantquestions you would like answered to add value to your organization? This is the “Ask” phase of theanalytics life cycle shown in Figure 1, and it goes hand-in-hand with collecting the requisite data,identifying the necessary analytical operations, and ensuring that your data are in an appropriate form forthese analytics. Although a software platform cannot resolve the “Ask” for you, it can support it by theaccommodations it provides for ingesting and preparing data for the desired analytical operations in the“Prepare” phase of the analytics life cycle, as shown in Figure 5.Figure 5. Data Preparation Using SAS Data Studio in SAS Visual Data Mining and Machine LearningCONSUMING DATA FROM VARIOUS SOURCESSAS Visual Data Mining and Machine Learning provides built-in conveniences for browsing available dataand importing data from various sources as necessary. A common data browser is used in all interfaceswherever a data table needs to be selected (see Figure 6). For extended data management capabilities,an enhanced form of the data browser can be added to your environment, offered as a dedicated DataExplorer interface, which is accessible from the Manage Data action in the actions menu.Figure 6. Browsing and Loading Data4
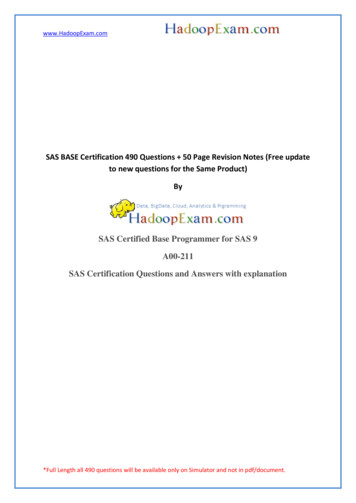
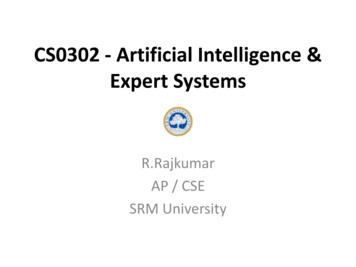
To prepare, explore, and perform analytics on data in SAS Viya, the data must be loaded into memory asa CAS table. The data browser displays data tables that are available to use immediately (data sets thathave been loaded into CAS tables), denoted by theicon next to the table name. Data can be madeavailable by defining connections to new Data Sources by clicking the “Connect” button ( ), andreferencing data sets that reside in those data sources. SAS Viya supports several types of data sourcesby using data connectors (depending on SAS/ACCESS licensing), including the following: File system: DNFS, HDFS, Path Database: DB2, Hadoop Hive, Impala, LASR, ODBC, Oracle, PostgreSQL, TeradataOnce a data source is defined, a CAS library (caslib) serves as a reference to it and is presented for youto browse available tables. Although you can browse all tables (including SAS data sets) that reside in thedata source, you can select only tables that are loaded as in-memory CAS tables to use within theapplication.Tip: To load a data set that resides in a specified data source but is not yet loaded (that is, it has anicon other thannext to it), right-click it and select Load.You can also import data from local files, such as the commonly used CSV (comma-separated values)format or other text files that contain data in a tabular format, or directly from social media feeds such asTwitter, Facebook, Google, and YouTube. The main thing to keep in mind is that a data set must beloaded into memory as a CAS table before you can work with it.For a selected table, the data browser displays all the column names along with their corresponding datatypes, in addition to information about the size of the table, as shown in Figure 6. You can run a profile ofthe table to get an initial indication of the cardinality, number of missing values, and basic descriptivestatistics for each variable. The profile provides some insight as to what type of data preparation youmight need to exercise before applying analytical operations on or modeling the data.TRANSFORMING AND ENHANCING YOUR DATAData preparation is such an important and necessary step in machine learning applications (Wujek, Hall,and Gunes 2016) that you will find capabilities to transform and augment your data in various formsthroughout different interfaces in SAS Visual Data Mining and Machine Learning. Often, interactive visualinspection of distributions and other aspects of the data is necessary in order to understand whichanalytical transformations are required, and other specialized forms of data manipulation, such as featureengineering techniques, are more closely associated with the model building phase. For data preparationto be done in a systematic and repeatable fashion so that it can be applied consistently to new data in thefuture, SAS Visual Data Mining and Machine Learning provides a powerful and convenient interface, SASData Studio, for preparing your data. SAS Data Studio enables you to build a data plan that consists of asequence of well-defined, repeatable steps that apply transforms to the source data table that is loaded.These transforms are organized in the following categories: Column Transforms to modify the values in existing columns in common ways Row Transforms to filter rows on the basis of variable values or to create columns throughtransposition Multi-input Transforms to join/merge or append tables Data Quality Transforms to standardize values and apply common data cleansing operations byusing a SAS Quality Knowledge Base Custom Transforms to calculate new columns by using simple expressions or custom codeThe out-of-the-box transforms provide a convenient way to quickly transform (and clean) the values incolumns and create new columns through aggregation and calculations. For any data preparation actionsthat are not directly available as transforms, the Code transform (one of the Custom Transforms)provides ultimate flexibility by enabling you to write SAS DATA step or CASL code to prepare your dataas necessary.5
Tip: When writing code for the Code transform in order to prepare data, you must use the variablesdp inputCaslib, dp inputTable, dp outputCaslib, and dp outputTable to refer to the input andoutput tables.Figure 7. Building and Applying a Data Preparation Plan in SAS Data StudioEach transform that is added as a step in the data plan must be defined and then run so that an updatedversion of the table is available for a subsequent step. The plan maintains a reference to the unalteredsource data table while it creates and updates a new table as a result of applying the steps. Informationabout the source table can be seen on the left, and information about the result table can be viewed onthe right. Profiles of the source and result tables can be run to view information about the variables.Tip: If the result table is not as expected or desired, you can roll back the list of steps from last to firstby clicking the undo button .USING YOU
About This Book What Does This Collection Cover? The broad definition of Artificial Intelligence (AI) is the simulation of human intelligence by machines. These machines can understand requests in natural (human) language, learn, observe, reason and self-correct.