Transcription
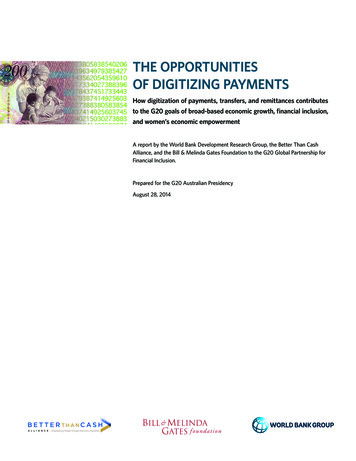
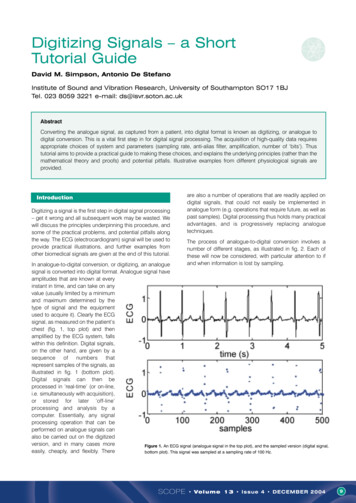
Digitizing Signals – a ShortTutorial GuideDavid M. Simpson, Antonio De StefanoInstitute of Sound and Vibration Research, University of Southampton SO17 1BJTel. 023 8059 3221 e-mail: ds@isvr.soton.ac.ukAbstractConverting the analogue signal, as captured from a patient, into digital format is known as digitizing, or analogue todigital conversion. This is a vital first step in for digital signal processing. The acquisition of high-quality data requiresappropriate choices of system and parameters (sampling rate, anti-alias filter, amplification, number of ‘bits’). Thustutorial aims to provide a practical guide to making these choices, and explains the underlying principles (rather than themathematical theory and proofs) and potential pitfalls. Illustrative examples from different physiological signals areprovided.IntroductionDigitizing a signal is the first step in digital signal processing– get it wrong and all subsequent work may be wasted. Wewill discuss the principles underpinning this procedure, andsome of the practical problems, and potential pitfalls alongthe way. The ECG (electrocardiogram) signal will be used toprovide practical illustrations, and further examples fromother biomedical signals are given at the end of this tutorial.are also a number of operations that are readily applied ondigital signals, that could not easily be implemented inanalogue form (e.g. operations that require future, as well aspast samples). Digital processing thus holds many practicaladvantages, and is progressively replacing analoguetechniques.The process of analogue-to-digital conversion involves anumber of different stages, as illustrated in fig. 2. Each ofthese will now be considered, with particular attention to ifand when information is lost by sampling.In analogue-to-digital conversion, or digitizing, an analoguesignal is converted into digital format. Analogue signal haveamplitudes that are known at everyinstant in time, and can take on anyvalue (usually limited by a minimumand maximum determined by thetype of signal and the equipmentused to acquire it). Clearly the ECGsignal, as measured on the patient’schest (fig. 1, top plot) and thenamplified by the ECG system, fallswithin this definition. Digital signals,on the other hand, are given by asequenceofnumbersthatrepresent samples of the signals, asillustrated in fig. 1 (bottom plot).Digital signals can then beprocessed in ‘real-time’ (or on-line,i.e. simultaneously with acquisition),or stored for later ‘off-line’processing and analysis by acomputer. Essentially, any signalprocessing operation that can beperformed on analogue signals canalso be carried out on the digitizedversion, and in many cases moreFigure 1. An ECG signal (analogue signal in the top plot), and the sampled version (digital signal,easily, cheaply, and flexibly. Therebottom plot). This signal was sampled at a sampling rate of 100 Hz.SCOPE Volume 13 Issue 4 DECEMBER 20049
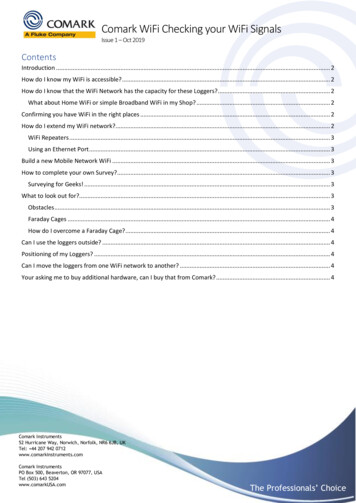
amplitudeFigure 2. The main steps in digital signal acquisition. The plots illustratethe manner in which each step modifies the input.aThe sampling theorem and aliasingtime (s)amplitudeThe ‘sampling rate’ is defined as the number of samplesacquired, per unit time, and is usually given in samples/secor Hz. It is intuitively clear that at a higher sampling rate,the digital signal provides a better approximation to theanalogue signal. It may furthermore be shown from theorythat if the sampling rate is sufficiently high, the analoguesignal can be reconstructed exactly from the samples, i.e.there is no loss of information in the process of sampling.The sampling theorem states that this recovery of theanalogue signal from its sampled version is possible, whenthe sampling rate is greater than twice the maximumfrequency present in the signal. This provides the maincriterion for selecting the sampling rate.btime (s)When the sampling rate is lower than required, aliasingoccurs, as illustrated in fig. 3. Consider a sine-wave of 1.5Hz (fig. 3a), sampled at 8.5 Hz. According to the samplingtheorem, this sampling rate is adequate, and the originalsine-wave can be reconstructed from the samples. Nowconsider a 10 Hz sine-wave (fig. 3b), again sampled atfs 8.5 Hz, i.e. much below the minimum of 20 Hz that isrequired according to the sampling theorem. It may benoted, that the samples obtained are identical to those in fig.3a, i.e. it would appear that the signal was made up of asine-wave of 1.5 Hz, rather than one of 10 Hz. This changeof frequency (from 10 to 1.5 Hz in this example) is known asaliasing. Sine-waves at 18.5 and 27 Hz also give identicaldigital signals (fig. 3c and d), and from these samples itwould be impossible to determine which frequency waspresent in the original analogue signal. Only when thesampling theorem is obeyed, is there no ambiguity as to thefrequency content of the signal.ctime (s)amplitudeThus, for example in fig. 1, the ECG signal had a maximumfrequency of about 40 Hz (determined by the filter settingsduring acquisition, and confirmed by observing thespectrum), and was sampled at 100 Hz (i.e. 2*40). Theanalogue signal (solid line) could therefore be reconstructedperfectly from the samples ( )1. It would thus also be possibleto calculate the samples corresponding to any other arbitrarysampling rate, from the digital signal acquired at 100 Hz.amplitudeTHE SAMPLING RATE MUST BE GREATER THAN TWICETHE MAXIMUM FREQUENCY PRESENT IN THE SIGNAL.dtime (s)Figure 3. Sine waves at 1.5 Hz, 10 Hz, 18.5 Hz, and 27 Hz, all giveexactly the same sample-values (marked as o), when sampled at 8.5Hz. Thus, the sampled sine-waves of 10, 18.5 and 27 Hz appear tohave been acquired from a 1.5 Hz sine-wave, i.e. they have been'aliased' down to 1.5 Hz. In order to avoid this ambiguity as to thefrequency in the analogue signal, the sampling rate must always begreater than twice the frequency present in the data.This reconstruction can be achieved by applying an analogue low-pass filter to the sampled signal, when each sample isrepresented by an impulse. This reconstruction process is clearly quite different from the simple linear interpolation betweensamples usually employed, when signals are plotted on a computer screen.110SCOPE Volume 13 Issue 4 DECEMBER 2004
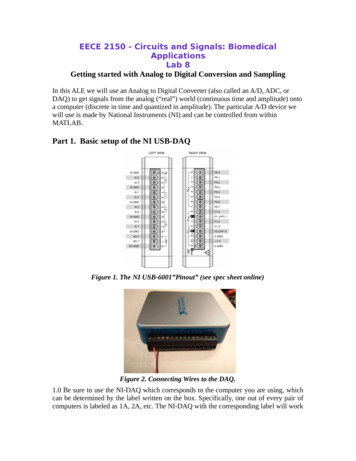
If a signal has been sampled with a sampling rate that is toolow and aliasing has arisen, it is (normally) impossible torestore the original data. The error cannot be undone andthe signal should be discarded. Practical signals, such asthe ECG, can be considered as made up of a sum of sine(and cosine) waves of different frequencies, in accordancewith Fourier analysis [1]. In order to adequately digitize suchsignals, the maximum frequency present in the signal mustbe considered, and a sampling rate that is more than twicethis value must be chosen. In order to ensure a known upperlimit to the frequency content of a signal, a low-pass filter(the anti-alias filter – see fig. 2) should be applied prior tosampling. For the example of the ECG signal, typically all theimportant information is contained in the band up to about100 Hz. In the specific example below (fig. 4a shows a smallsegment), the signal is was found to be contained in theband below about 40 Hz (fig. 4c), and a sampling rateabove 80 Hz would thus seem adequate for the ECG signal.However, there is also noise present at higher frequencies,indicated by the sharp spikes at the mains frequency of 50Hz, and its odd harmonics (150, 250, 350 and 450 Hz). Thusa much higher sampling rate (above 900 Hz) would berequired. However, if we suppress this noise prior tosampling, a lower sampling rate would be adequate. In thisexample, we apply a low-pass filter (fig. 4b and d) thatretains frequencies below 45 Hz (ECG), and attenuates thehigher components (noise). We then sample at 256 Hz (i.e.well above the theoretical minimum of 2*45 Hz). With theanti-alias filter (fig. 4b, d and f), aliasing is avoided, but theECG signal itself is preserved. Without the anti-alias filter(fig. 4a, c and e), aliasing occurs, and the noise above 256/2Hz is aliased: 150 Hz appears as 106 Hz, 250 as 6 Hz, 350as 94 Hz, and 450 Hz as 62 Hz . Of particular concern wouldbe the harmonic that has been aliased to 6 Hz2. This is in themiddle of the frequency band containing the ECG andcontaminates the ECG signal. Clearly, after digitizing nofiltering can remove that harmonic without also affecting theECG signal. Furthermore, it would be impossible to tellwhether the activity at that particular frequency arose as aresult of aliasing, or if it was present in the original analogueECG signal (or how much of it was present). The aliasingthat has occurred cannot be undone, and the digitizedsignal should be discarded.Anti-alias filters are not perfect and cannot eliminate allnoise above their ‘cut-off’ frequency (45 Hz in the example).This is evident in fig. 4, where the 50 Hz noise is attenuated,but not completely cancelled. As a result of this limitation ofthe filters, the sampling rate should normally be set to somethree to five times above the cut-off frequency of the antialias filter, not at the theoretical lower limit of twice. In theabove example with the anti-alias filter cutting off at 45 Hz,we used a sampling rate of fs 256 Hz. Excessively highsampling rates should also be avoided, since they result inmore data (i.e. larger data files), require more computermemory and computing time when processing, and mayrequire faster and more expensive A/D converter hardware.The example shown underlines the importance of selectingthe sampling rate based on the maximum frequency presentin the signal, and not simply the maximum frequency that wemay be interested in. Thus, in order to select a suitablesampling rate, first the maximum frequency of interest in thesignal should be determined (fmax). The cut-off frequency (fc)of the anti-alias filter (i.e. the maximum frequency that thefilter passes) should then be chosen as a little above fmax, soas not to attenuate the band of interest. The samplingfrequency is then chosen as fs 3*fc. It may be noted thatsignal acquisition systems often include a low-pass filter aspart of the in-built analogue signal processing, in order tosuppress noise (for ECG systems the cut-off frequency ofthis filter might typically be set at 100 Hz). This filter can betaken as the anti-alias filter, and the output signal digitized ata sampling rate some 3 – 5 times above the filter cut-offfrequency, without the need for a further specific anti-aliasfilter. It should also be emphasized again that the anti-aliasfilter has to be applied prior to digitizing, i.e. it must be ananalogue filter. A digital filter cannot perform this task, sinceit would operate on a signal that has already sufferedaliasing.In the example of the ECG signal, the maximum frequencyof interest is known to be usually around 100 Hz, and thusprovides guidance as to the selection of the anti-alias filterand the sampling rate for this signal. However, in anunknown signal, such guidance may not be available. In thatcase, you may make an initial assumption (chose a value ashigh as possible), and apply an anti-alias filter and A/Dconverter accordingly. You may then apply digital low-passfilters to the digitized signal, using progressively lower cutoff frequencies, until you are confident that you havereached a limit, beyond which the important parts of thesignal are distorted. That will provide you with an indicationof the maximum frequency of interest. Plotting the amplitude(or power) spectrum of the signal may be of assistance inthis process. Further acquisitions of this signal may then becarried out using this ‘experimental’ maximum frequency,and a corresponding anti-alias filter and sampling rate.QuantizationThe output of the A/D converter is actually a series of integernumbers, each representing the signals amplitude at asample. This is illustrated in fig. 5, where the relationshipbetween the A/D converter's input (analogue) and output(integer values) are shown, and figs. 6 and 7, whereanalogue and the corresponding digital signals areThe aliased frequencies fa can be calculated as fa f – ifs , where f is the original frequency, fs is the sampling rate, and i isfsan integer such that fa 2. Thus, f 150 Hz becomes fa 150– 256 106 Hz, and f 450 Hz becomes2 fa 450– 2*256 62 Hz, etc.SCOPE Volume 13 Issue 4 DECEMBER 200411
ECGbECGatime (s)amplitudedamplitudectime (s)frequency (Hz)amplitudefamplitudeefrequency (Hz)frequency (Hz)frequency (Hz)Figure 4. A segment of an ECG signal without (left column) and with (right column) anti-alias filtering. The samples of the signal ( ) obtained at 256 Hz,before (a) and after (b) anti-alias filtering. The anti-alias filter has clearly reduced the mains-noise, and smoothed the signal. c) The amplitude spectrum of theanalogue signal, with ECG activity below about 45 Hz, and mains-noise at 50, 150, 250, 350 and 450 Hz (fundamental and odd harmonics). d) After anti-aliasfiltering (cut-off at 45 Hz), the higher harmonics are suppressed, and noise at 50 Hz is attenuated. Below 45 Hz, the filter has little effect. e) The amplitudespectrum of the sampled signal, if no anti-alias filter is applied. The higher harmonics of the mains noise are aliased and appear at 106, 6 (buried in the ECGsignal), 94, and 62 Hz, respectively. f) The amplitude spectrum with the anti-alias filter and sampling at 256 Hz. No aliasing is evident, and the spectrum of theECG signal itself is maintained. Note that c and d show frequencies up to 500 Hz, and e and f only up to 128 Hz.illustrated. In fig. 5, on the horizontal axis the analogue valueof any sample is shown, and the vertical axis gives thecorresponding integer-valued output of the A/D converter.The integer output is obtained by rounding (to the nearestinteger) or truncation (to the next lower integer). Thus theamplitude of the digitized signal varies in discrete steps; thisis known as ‘quantization’ of the amplitude.12SCOPE
This is a vital first step in for digital signal processing. The acquisition of high-quality data requires appropriate choices of system and parameters (sampling rate, anti-alias filter, amplification, number of ‘bits’). Thus tutorial aims to provide a practical guide to making these choices, and explains the underlying principles (rather than the