Transcription
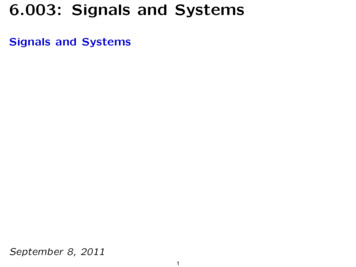
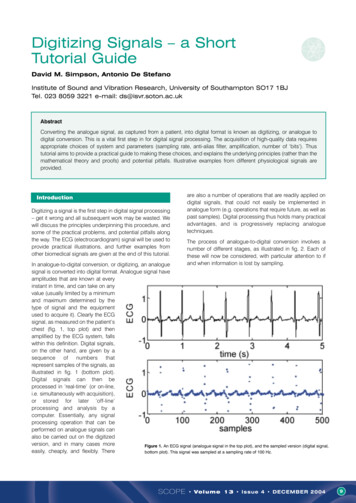
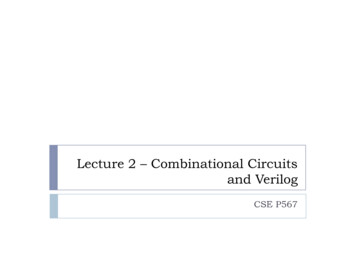
EECE 2150 - Circuits and Signals: BiomedicalApplicationsLab 8Getting started with Analog to Digital Conversion and SamplingIn this ALE we will use an Analog to Digital Converter (also called an A/D, ADC, orDAQ) to get signals from the analog (“real”) world (continuous time and amplitude) ontoa computer (discrete in time and quantized in amplitude). The particular A/D device wewill use is made by National Instruments (NI) and can be controlled from withinMATLAB.Part 1. Basic setup of the NI USB-DAQFigure 1. The NI USB-6001”Pinout” (see spec sheet online)Figure 2. Connecting Wires to the DAQ.1.0 Be sure to use the NI-DAQ which corresponds to the computer you are using, whichcan be determined by the label written on the box. Specifically, one out of every pair ofcomputers is labeled as 1A, 2A, etc. The NI-DAQ with the corresponding label will work
on either computer in that pair but not on any other computers in the lab. So be sure tograb the correct NI-DAQ box!1.1 We can connect input signals into the NI-DAQ using wires with stripped ends. Insertthe wire end into the first Analog Input terminals “AI 0 and -, also indicated as 0 and4”. You will need to tighten the connectors “snuggly/gently” with a screwdriver. Fornow, do not connect the other end of the wires to anything. (Note that the photo of theNI-DAQ has the wires connected to ground and AI 0, which is not the connection we aremaking in this lab)1.2 Plug in the DAQ to your computer with the USB cable. You should see a blue lighton the top of the board. Open Matlab—IMPORTANT, USE MATLAB version 2015a, not2014a. We will use a “session based DAQ interface” for this lab.There is somewhat confusing documentation on the Matlab website which you canreview -devices.html#responsive -data.html1.3 In this lab we will go through the basic steps of setting up an acquisition (blue textindicates what you type at the command line, purple text indicates the response fromMatlab).First, you can see what DAQ devices are available by typing: daq.getDevicesat the command line. If it is connected properly you will see something like thefollowing (after a pause of a few seconds). If not, stop and make sure everything ishooked up correctlyans ni: National Instruments USB-6001 (Device ID: 'Dev1')Analog input subsystem supports:-10 to 10 Volts rangeRates from 0.1 to 20000.0 scans/sec8 channels ('ai0' - 'ai7')'Voltage' measurement typeAnalog output subsystem supports:-10 to 10 Volts rangeRates from 0.1 to 5000.0 scans/sec
2 channels ('ao0','ao1')'Voltage' measurement typeDigital subsystem supports:13 channels ('port0/line0' - nal' measurement typesCounter input subsystem supports:1 channel ('ctr0')'EdgeCount' measurement type1.4 Next, we need to create a “DAQ session” by typing: s daq.createSession('ni')Matlab will return something like the following:s Data acquisition session using National Instruments hardware:Will run for 1 second (1000 scans) at 1000 scans/second.No channels have been added1.5 Next, we need to add an analog data input channel. For this we use the“addAnalogInputChannel” command. The inputs correspond to the DAQ session (s, see1.4), the device name (Dev1, see 1.3), the input channel (ai0), and the measurement type(Voltage): ch addAnalogInputChannel(s, 'Dev1', 'ai0', 'Voltage')ch Data acquisition analog input voltage channel 'ai0' on device 'Dev1':Coupling: DCTerminalConfig: DifferentialRange: -10 to 10 VoltsName: ''ID: 'ai0'Device: [1x1 daq.ni.DeviceInfo]MeasurementType: 'Voltage'1.6 You can see more DAQ parameters by looking at the subsystems using: sub ch.Device.Subsystems
Matlab will return the following::sub Analog input subsystem supports:-10 to 10 Volts rangeRates from 0.1 to 20000.0 scans/sec8 channels ('ai0' - 'ai7')'Voltage' measurement typeProperties, Methods, EventsAnalog output subsystem supports:-10 to 10 Volts rangeRates from 0.1 to 5000.0 scans/sec2 channels ('ao0','ao1')'Voltage' measurement typeProperties, Methods, EventsDigital subsystem supports:13 channels ('port0/line0' - nal' measurement typesProperties, Methods, EventsCounter input subsystem supports:1 channel ('ctr0')'EdgeCount' measurement typeProperties, Methods, Events
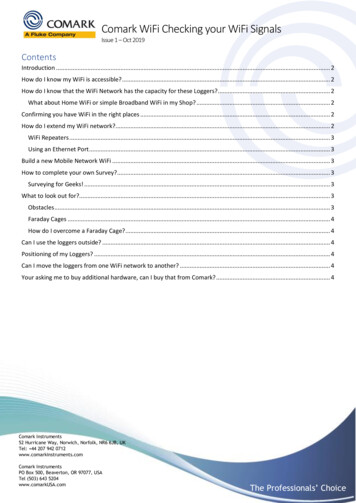
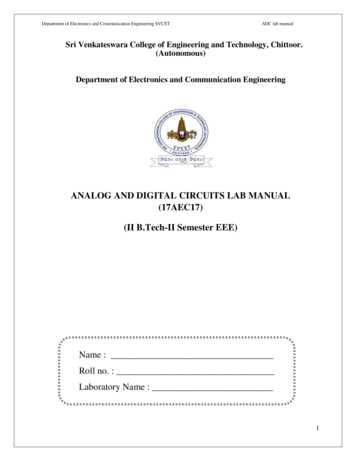
Part 2. Inputting, acquiring, and plotting a test signal.Figure 3. Connecting the Function Generator to the DAQ Board2.1 Connect the function generator the USB-DAQ with a BNC to banana connector cableand some alligator clips, similar to figure 3 above.2.2 Now set up the function generator to generate an output wave as follows:Sine wave, frequency 500 Hz, Amplitude 5V, DC Offset 0V, Output enabled (on).Use your BNC “T” to observe the function generator signal on the oscilloscope while it isalso going into the A/D converter.2.3 We can set up the parameters of our acquisition as follows.Let’s assume we want a sampling frequency Fs of 10,000 Hz (samples per second), andwe want to acquire 0.01 s of data (100 samples).We can do this by setting the DAQ input channel acquisition rate: s.Rate 10000Matlab will return:s.Rate Rate: 10000Also set the number of samples (which Matlab calls “Scans”):
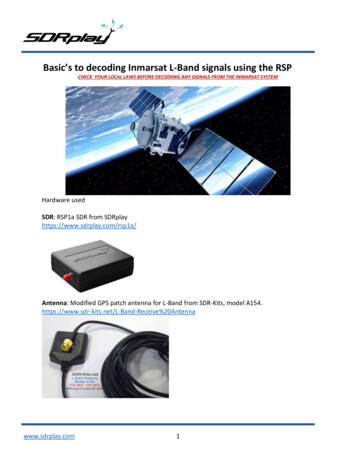
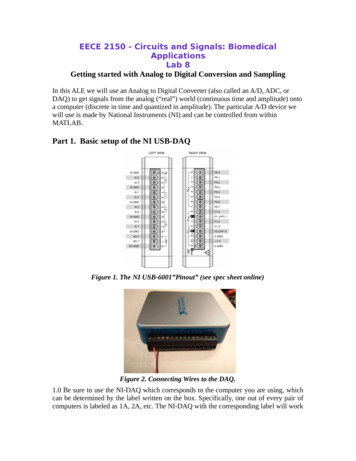
s.NumberOfScans 100Matlab will return:s.NumberOfScans Data acquisition session using National Instruments hardware:Will run for 100 scans (0.01 seconds) at 10000 scans/second.Number of channels: 1index Type Device Channel MeasurementTypeRange----- ---- ------ ------- ------------------- ---------------- ---1 ai Dev1 ai0 Voltage (Differential) -10 to 10 VoltsName2.4 Now we can acquire the data using the “startForeground” command as follows: data s.startForeground();This will read 100 samples into the variable ‘data’ at a rate of 10000 samples / s. We cancheck that this worked by plotting the data: figure; plot(data, '.-')which gives something like Figure 4 below.Count the number of periods shown in your graph and determine whether this is correct.Figure 4. Basic Acquired Data Trace
2.5 This graph is not professional because it is not properly labeled and does not have acorrect x-axis. As a refresher on how to do this, first, we should generate a proper “timeaxis” (x-axis).For the conditions above, the time step is 1/10000 samples /s 0.0001 s. In general thisis: dt 1/s.Rate;The time of the first sample is typically set either just “dt”, or 0.0001s, or to 0. We willuse the first option here for convenience. The time corresponding to the last sample is100*0.0001s 0.01s. In general this is s.NumberOfScans*dt: t end double(s.NumberOfScans)*dt;Here we have had to use the function “double” to convert the integer values.NumberOfScans to a double precision value to perform the multiplication operation inMatlab. So our time axes is: time [dt:dt:t end];We can now make a nicer plot, such as: figure; plot(time, data, 'r.-'); xlabel('Time (s)'); ylabel('Input Signal (V)'); title('500 Hz Sinewave, 5V Ampl, 0V DC Offset')Here, xlabel, ylabel and title label the figure and axes. Calling plot with 'r.-' modifiergives us a red line (r), with points marked by dots (.) and connected with a line (-).Part 3. Limitations of digitization: Quantization error.Use the following function generator (FG) and analog to digital converter (ADC; Matlab)settings. Keep using the BNC “T” so you can have the output go both the oscilloscopeand the A/D converter so that you can observe both the analog and digitized signals.For each configuration, acquire and plot the data in Matlab (print a copy of your figure toput in your notebook). Remember to generate proper time-axes and labels as above. Foreach case, i) show the plot, ii) explain if the data does or does not properly representthe input sine wave and, iii) explain the cause of the problem, and iv) explain (withhelp from the instructors, if necessary) how the problem could have been avoided.Config1FG:Sine waveAmplitude 100mV (center-to-peak)
Frequency 200 HzDC Offset 0VADC: Sampling rate 10,000 Samples / sAcq time 0.01 secondsConfig2FG:Sine waveAmplitude 10mV (center-to-peak – set 10mVp-p)Frequency 200 HzDC Offset 0 VADC: Sampling rate 10,000 Samples / sAcq time 0.01 secondsVoltage Resolution of A/D:The NI USB6001 is a 14-bit A/D converter that has an input range from -10 V to 10 V.However, the digitized value can only take on a finite number of values (or in otherwords, the voltage output is quantized). How many distinct values N can a 14-bit registerhold? What is the voltage difference between each value V ? Does this explainthe observations in above? Do you observe anything that cannot be explained by thequantization of the signal in the A/D process?Part 3. Sampling music or speech.Use your computer or phone to output an audio signal. Observe this signal on theoscilloscope (try to make the signal as large as possible – 1 to 2 volts p-p is good,somewhat less is ok). Use MATLAB and your ADC to obtain 4 audio samples, one at a20kHz sampling rate, one at a 5 kHz sampling rate, one at a 3 kHz sampling rate, and oneat a 1 kHz sampling rate. Choose the number of samples so that each data setcorresponds to a few seconds of sound. You can play back the samples using theMATLAB commands (assuming you name the data from the four scans data20k, data5k,data 3k, and data1k): soundsc(data20k, 20000); soundsc(data5k, 5000); soundsc(data3k, 3000); soundsc(data1k, 1000);What do the different samples sound like, compared with the original and with eachother. Try to describe them more precisely than just good and bad – what do you hear?Why is this happening? Discuss with your instructors.
Part 4. If you have time: A/D Sampling Rate – Deeper Investigationa) Sampling Interval and Signal FrequencyClearly, if you sample too slowly you will not be able to record a signal offrequency f. To explore this further, set your function generator at a frequencyf 1000 Hz with a center-to-peak amplitude of 2V (center-to-peak amplitude4V into an infinite impedance load). Collect a 2 second sample of the signal –using s.DurationInSeconds 2 andy s.startForeground()commands at the following sampling frequencies:Fs 20000, 10000, 4000, 2500, 1800, 1600, 1400 and 1200 samples/s. Aftercollecting each sample, use your computer speakers and the MATLABsoundsc(y, Fs) command to play back each sample. (You can make aMATLAB script m-file to do all these sequentially for easier comparisons!) Isthere some point where you think you are no longer hearing a signal at 1000 Hz?If you have time, change the function generator to produce a signal atf 2000 Hz , sample it at Fs 20000, 10000, 4000, 3600, 3200, 2800 and2400 Hz, and play out the sound using soundsc(y, Fs).Can you generalize to say what the maximum frequency fmax is that can beaccurately digitized given a sampling frequency Fs? If you sample at a frequencyabove the maximum frequency, what happens to the signal you hear? What is themaximum frequency you could accurately digitize at F s 20000 Hz ,F s 5000 Hz , and F s 1000 Hz ? What happens to signals at frequenciesabove these maximum frequencies? Does this help explain why the sound filesyou sampled were so distorted at lower sampling frequencies?DO NOT FORGET TO HAVE THE INSTRUCTOR OR ONE OF THE TAs SIGNOFF ON YOUR NOTEBOOK WHEN YOU ARE DONE.Department of Electrical Engineering, Northeastern University.Last updated: 10/11/16, N. McGruer; 9/29/15, 100 minutes, DH Brooks, 9/29/15, S WMcKnight; 8/10/15, M.Niedre
11.10.2016 · The NI USB-6001”Pinout” (see spec sheet online) Figure 2. Connecting Wires to the DAQ. 1.0 Be sure to use the NI-DAQ which corresponds to the computer you are using, which can be determined by the label written on the box. Specifically, one out of every pair of computers is labeled as 1A, 2A, etc. The NI-DAQ with the corresponding label will work . on either computer in that pair but not .