Transcription
Food Measure (2012) 6:27–34DOI 10.1007/s11694-012-9130-3ORIGINAL PAPERA machine vision system for high speed sorting of small spotson grainsTom Pearson Dan Moore Jim PearsonReceived: 30 September 2011 / Accepted: 11 October 2012 / Published online: 27 October 2012Ó Springer Science Business Media New York (Outside the USA) 2012Abstract A sorting system was developed to detect andremove individual grain kernels with small localizedblemishes or defects. The system uses a color VGA sensorto capture images of the kernels at high speed as the graindrops off an inclined chute. The image data are directlyinput into a field-programmable gate array that performsimage processing and classification in real time. Spotdetection is accomplished by a combination of colorinformation and a simple, nonlinear spatial filter thatdetects small dips in pixel intensity along an image line.Color information is combined with spatial filtering toachieve a high level of accuracy. Testing was performed onpopcorn with blue-eye damage, which is characterized by asmall blue blemish on the germ. A two-camera system wasdeveloped to inspect the opposite sides of each kernel asthey slide off the end of a chute. The chute was designedsuch that the kernels slide down the chute without tumbling, increasing the probability that a spot will be in thefield of view of one of the cameras. The system’s accuracyis 89 % identification of blue-eye damaged kernels with a6 % false positive rate. The throughput is approximately180 kernels per second, or 100 kg/h.KeywordsFPGA Camera Color ImagingT. Pearson (&)USDA-ARS-NPA-CGAHR, Manhattan, KS, USAe-mail: thomas.pearson@ars.usda.govD. MooreNational Mfg., Lincoln, NE, USAJ. PearsonShort Dog Electronics, Corvallis, OR, USAIntroductionThe detection of small localized spots (or blemishes) onagricultural products using machine vision has proven to befeasible [1–3]. However, this approach becomes complicated when one desires real-time detection and handling atan economically feasible cost. Commercial color sortersare widely used to separate grains, nuts, and other productsby color, but they do not have the spatial resolution orimage processing capability to detect small spots onkernels [4]. An imaging- and hardware-based processingsystem was developed that was integrated into a sortingsystem for the accurate separation of grains by color andsurface texture [5]. However, this system could not detectsingle spots or blemishes on kernels. In an earlier work [4],it was attempted to address the detection of spots on popcorn caused by blue-eye fungal infestation. However, theaccuracy of detecting blue-eye infested kernels was only74 % with 9 % false positives, and the throughputwas only approximately 35 kg/h. Feedback from thepopcorn industry indicated that the detection accuracy forblue-eye infested kernels must be approximately 90 % withapproximately 5 % false positives, and the throughput mustbe higher before a sorting method would be useful enoughto be implemented.Some of the problems in the initial effort to detect blueeye infested kernels were caused by dark areas on the edgesof the kernels and the random orientation of the kernels inthat system [4]. Moreover, the study did not use colorinformation to help differentiate blue-eye blemishes fromother darker regions or spots on the kernels because theprocessing power of the hardware was insufficient.The objective of this study was to improve thethroughput and accuracy of a sorter used to detect blue-eyedamaged popcorn kernels through improved lighting and123
28T. Pearson et al.feeding systems, as well as additional processing enabledby an field-programmable gate array (FPGA) with morelogic elements and memory to accommodate more mathematical operations on the image than previously possible.The goal was to produce a machine with the accuracy andthroughput required for industry implementation.Materials and methodsA sorting system with three parallel chutes and two cameras was constructed as shown in Fig. 1. In this system,bulk kernels were placed into a hopper, and a vibratoryfeeder moves the kernels in a single layer onto a chute thatis inclined at 45 . Images of the opposing sides of thekernels are acquired about 10 mm after the kernels slide offthe chute. A two-camera system was chosen instead of thethree-camera system as used in Pearson [4]. This allowedparallel chutes to be used to increase throughput, and madeit possible to orient the kernels such that their germ facedone of the two cameras. This system is similar to thatoriginally developed [5] except for four important differences: the feeding system was designed to prevent kerneltumbling and orient the kernels so the germ faced one ofthe cameras, the camera circuit board facilitates moreimage processing, the use of two cameras on opposingsides of the kernels, and the image algorithm used to detectsmall spots on the germ of the popcorn caused by blue-eyefungal infestation. Each of these differences is discussed indetail below.Chute designIt was observed that popcorn kernels, while on the vibrating feeder, almost always orient themselves with their germhoppercamerafanAirnozzlefeederchutefacing up or down. This is because the germ or endospermsides of the kernel tend to be flat, and this orientation putsthe kernel into the lowest center of gravity. However,sorting cannot be performed at the end of the vibratingfeeder, as the kernels are too close to each other, whichprohibits the efficient diversion of defective kernels. Aninclined chute is required to accelerate and separate thekernels. An aluminum extrusion was designed and fabricated with flat bottom grooves of sufficient width such thatthe popcorn kernels could slide down the chute with theirgerm facing up or down, thereby matching their orientationon the vibrating feeder. The depth of the grooves was deepenough that kernels could slide on their germ or endospermside yet not so deep that the kernels could tumble. Since thegrooves of the chute were shallower than the length of theaverage kernel, a plastic cover, cut from transparencyplotter film (17702T, Hewlett Packard, Palo Alto, CA) wasplaced over the chute and prevented most of the kernelsfrom flipping completely over. The width and depth of thegrooves in the chute were determined using the width andthickness of 300 randomly selected popcorn kernels fromtwo different growing seasons and five different growinglocations. Using these measurements, the groove width wasset at 7.6 mm, which corresponded to the average widthplus three standard deviations of the kernel width. Thegroove depth was set at 6 mm, which corresponded to theaverage kernel thickness plus three standard deviations.The average length of the popcorn kernels was 8.1 mmwith a standard deviation of 0.9 mm. Therefore, it wouldbe impossible for at least 95 % of kernels to tumble downthe chute with this design. To further ensure that kernelsremained in their germ up/down orientation, the top end ofthe chute was curved such that the bottom of the chutegrooves follow a 25.4 mm radius, then it was cut so that thesurface at the bottom of the chute grooves would be tangentto the end of the vibratory feeder as shown in Fig. 2. Anormal practice for a vibratory feeder-chute transitionwould be to drop kernels from the feeder onto an inclinedchute. However, this practice can initiate tumbling andprevent the germ from facing one of the cameras. Finally,the aluminum chute was polished and hard anodized toreduce friction and further reduce tumbling.Sorter design with two camerasLens andLEDcameraFig. 1 Sorting system for the detection of spots. Note that twocameras are used such that opposite sides of the kernels are imagedsimultaneously123As indicated in Fig. 1, the two-camera arrangementrequired the placement of an air nozzle to divert blue-eyeinfested kernels in a slightly unusual direction. In mostsingle channel sorting machines, the kernels were divertedroughly perpendicularly to their travel path. However, thiswas not possible with the two-camera system because itwould cause the diverted kernels to pass over the lowercamera’s field of view. Therefore, the air valve was placed
A machine vision system for high speed sorting29by the closely spaced LEDs. An aluminum heat sink(MM23600, M&M Metals, Carrollton, Texas) with a fan(#BG0702-B055-000, NMB Technologies Corporation,Chatsworth, CA) was subsequently mounted to the PCB onthe side opposite the LEDs. The LEDs had a cool whitecolor temperature of 5,500 K, which provided good colorrendition, especially for enhancing blue (B) color. A linearlens was placed over the LED array (C-002, DBM ReflexLighting Solutions, Laval, Québec) to diffuse the lightfrom each LED and focus it onto the point of imaging.Camera circuit boardA circuit board with an image sensor (KAC-9628, EastmanKodak Co., Rochester, NY) directly linked to a FPGA(EP2C20Q240C8, Altera, San Jose, CA) was designed toperform the image analysis in real time. A schematic of theboard is shown in Fig. 3. The FPGA programs were writtenin the Verilog HDL language and compiled in Quartus II,which was supplied by the FPGA manufacturer. Compiledprograms were transferred from the PC to the FPGA usinga special communications cable (ByteBlaster, Altera, SanJose, CA). The image sensor was mounted on the oppositeside of the PCB board from the FPGA to minimize thedistance the data would need to travel and reduce thepotential of data corruption from noise. The support electronics for the image sensor and the FPGA are thosespecified by the manufacturer and were described in detailin [4]. The FPGA used in this design has 18,752 logicelements and 234 kbits of memory, as opposed to theFPGA used in [4], which has only 4,608 logic elements and117 kbits of memory. The additional logic elements madeit possible to perform more image processing operations,Fig. 2 Feeder-chute transition. Note that, normally, a plastic coverwould be placed over the chute to prevent the kernels from tumbling.This cover was removed so that the chute-feeder transition was morevisiblein an almost vertical orientation above the kernel flowstream and diverted the kernels straight down vertically,while accepted kernels continued on a path approximately45 from vertical.Lighting for this sorting system was provided by fourwhite light emitting diode (LED) arrays placed around thekernel stream. One light array was placed under the chute.The LED arrays were constructed from a custom madealuminum clad printed circuit board (PCB-POOL IMS(Aluminum), PCB-Pool Beta Layout, San Jose, CA) andconsisted of nine 5 W LEDs (LZ1-00CW05, LEDEngin,Santa Clara, CA) in a linear pattern spaced 5.5 mm apart.The aluminum clad PCB provided excellent heat conduction through the board to help dissipate heat generatedFig. 3 Block diagram of thecamera systemPC computerBlasterClock, 48MHzByte -USBRS232RS232 to USBconversion8-bit datapclkImage sensorKodak KAC-9268hsyncvsyncFPGA programEEPROMFPGAAltera Cyclone IIEP2C20Q240C8SPII2CUser EEPROMQuad encoder, digital readout(separate board)Solid-state relays,separate boardindicator LEDs123
30and the expanded memory enabled the capturing of higherresolution images and the use of buffers for filtering andcolor interpolation.As in [4], the image sensor operates in near line-scanmode, which means that each frame in the image is composed of only two lines and successive frames are combined to form a two-dimensional image. When a kernelenters the field of view, the pixel intensity increases andtriggers the FPGA to commence image capture. Next, theimage is loaded into its on-chip memory. Each image isstored in a raw (un-interpolated) format with a size of124 9 124 pixels. Spatial resolution was approximately0.06 mm/pixel. Each image, at 8 bits/pixel, requires 123kbits. The memory structure is 8 bit words and requires thememory to be allocated in 2n bytes; therefore, 214 byteswere allocated, leaving 1,008 bytes for other image data,such as image features, that the FPGA extracts from theimages in real time. If desired, the user can connect a PC tothe FPGA through the USB interface and transfer theimages and extra data from the FPGA memory to a PC foreach kernel. As discussed below, the image sensor has 640pixels per line with a field of view spread over three parallel channels that the grain slides down. Three differentregions of interest are centered over the three channels;each has a width of 124 pixels.The FPGA and the image sensor are timed with the same48 MHz clock source. The image sensor divides this clockfrequency by four to obtain a pixel clock frequency of12 MHz. Because the FPGA clock rate is faster than thepixel clock rate, it is possible to perform mathematicaloperations on the image while pixels are being transferredfrom the sensor to the FPGA.The camera board also has EEPROM memory that theuser can transfer data to through the USB connection. Thisdata is read by the FPGA during startup and can containparameters for kernel classification (such as discriminatefunction coefficients) or parameters to adjust the imagesensor at startup (such as the pixel clock rate). In addition,the camera board has an input for a switch, a quad encoder,and a pulse width modulated output to a digital LCD display. The FPGA was programmed to decode the encodersignal and adjust the PWM signal proportionally to theencoder number. This number can be used as a useradjustable rejection threshold for classification and sorting.Finally, the camera board has buffered outputs to solidstate relay triggers that fire air solenoid valves to divertkernels as discussed in [4].The image sensor (KAC-9628, Eastman Kodak Co.,Rochester, NY) has 640 9 480 pixels and uses a colorBayer filter to sense red (R), green (G), or B light on different pixels as shown in Fig. 4.The pixel data was digitized on the image sensor chip andtransferred to the FPGA without interpolating the colors.123T. Pearson et al.Fig. 4 Bayer filter pattern on the image sensor used. One line iscomprised of green and red pixels, and the next line is blue and greenpixels (Color figure online)Normally, color interpolation is performed after an entireimage is acquired, but this approach is not possible for realtime sorting because all of the image processing must beperformed as the image is being acquired so that a decisioncan be made almost immediately after the kernel passes outof the field of view. This design allows the FPGA to be readyto process another kernel almost immediately. To interpolatethe colors with minimal delay between kernels, two largefirst-in-first-out buffers were created using the FPGAsmemory. The buffer lengths are two lines (1,280 pixels) andone image line (640 pixels) each. As each pixel is receivedfrom the image sensor, it goes into the buffers, and the pixeldata from exactly two lines above the current pixel location isoutputted by the buffers. The output of these buffers and thecurrent pixel data are subsequently input into three revolvingmemory variables, forming a 3 9 3 pixel array. Colorinterpolation is the process of using colors from adjacentpixels to compute a triplet of R, G, and B pixel values for allof the pixels in the image. This process can involve a largenumber of pixels and numerical operations [6]. To minimizethe amount of computations, the interpolation algorithmused in this study simply averages the appropriate adjacentpixels in a 3 9 3 pixel array. With a Bayer color pixel pattern, there are four color arrangement scenarios for pixels in a3 9 3 pixel array, as shown in Fig. 5.The center pixel of the 3 9 3 array is simply used as oneof the colors for the RGB triplet. In the cases where a Gpixel is centered, the average of the two adjacent R pixelsand the average of the two adjacent B pixels are used tocomplete the RGB triplet. The averages are computed bysumming the pixel values and subsequently right shifting 1bit to obtain an average. It is known that this operationtruncates the result instead of rounding it. If the centerpixel is R or B, the average of the four adjacent pixelscomprising the other two colors is used to complete thetriplet. In this case, the sum of the 4 pixels is right shifted 2bits to obtain the average color.Fig. 5 Possible color arrangements in a 3 9 3 pixel array from rawcolor image data (Color figure online)
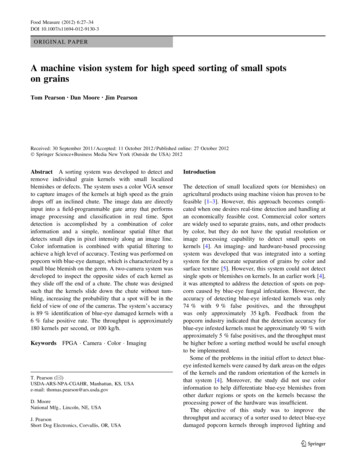
A machine vision system for high speed sorting31The summing and shifting color interpolation operationson the 3 9 3 pixel arrays are efficient, can be performedbetween pixels being clocked into the FPGA, and do notslow any of the other image computations. The color of eachpixel in the 3 9 3 array is tracked by counting pixels fromthe start of each line and by their relation to the vertical syncand horizontal sync pulses from the image sensor. Imagelines containing R and G pixels are preceded by both verticaland horizontal sync pulses, whereas the green–blue lines arepreceded by only a horizontal sync pulse. The only delaycomes from the two line image buffer and is only 0.08 ms.The kernels travel off the chute at a speed of approximately2 m/s. Therefore, after the entire image is acquired, thekernel has only traveled 0.16 mm before all the processingis complete. Most of the gaps between kernels as they slideoff the chute are greater than 1 mm. If kernels happen to betouching, the first 0.16 mm of the trailing kernel’s image istruncated; however, this was considered to be an acceptableloss of data that probably would not cause the kernel to bemisclassified.The RGB values for all the pixels were converted to hue,saturation, and value (hsv) and CIE Lab color values. Inaddition, the difference between two of the three colorvalues for each pixel (R-G, R-B, and G-B) was computed.The averages and standard deviations of these data areshown in Table 1. All of the computed color values andRGB values were saved in a spreadsheet along with theirassociation with blue-eye damaged regions, shadows, orother portions of the kernels. Stepwise discriminantanalysis software (Number Cruncher Statistical Systems,Kaysville, UT) was used to select the single best colorvalue for distinguishing pixels in blue-eye regions fromother regions on the kernel. The stepwise procedureselected saturation as the best feature for distinguishingblue-eye pixels from the other regions of the kernel andselected R-B for distinguishing blue-eye regions fromshadows. Figure 6 shows a color image of a blue-eyedamaged kernel and an image displaying only the saturation component of the hsv image.Image processing and classification algorithmTable 1 Average and standard deviation (in parenthesis) for samplepixels from different popcorn regionsSamples of popcorn from two growing years and from fivedifferent storage bins were collected so that a reasonablerange of kernel color and kernel morphology could bestudied. Samples were drawn from bins known to have highlevels (*5 %) of blue-eye damage. Each sample wasapproximately 1 kg and was divided using a Boerner divider(#34, Seedburo Co., Des Plaines, IL). One of the fractionswas kept for sorter testing, whereas the other samples werehand inspected, and 100 undamaged and 100 damagedkernels were pulled from each sample for a total of 2,000blue-eye and 2,000 undamaged kernels. Un-interpolatedraw images of each kernel were then collected in the twocamera sorter prototype by feeding the kernels from thevibratory feeder in the same way as if they were beingsorted. The images were color interpolated off-line using thesame technique as discussed previously and were saved inBMP format for off-line analysis to develop an image processing algorithm for detecting the damaged kernels.The first off-line analysis performed was to investigateuse of color to distinguish blue-eye damaged regions fromthe other parts of the kernel. Each of the saved kernelimages was opened in Adobe Photoshop, and RGB valueswere recorded for 10 pixels in the blue-eye region (ifpresent) and 20 pixels in other areas of the kernel withsimilar R values to the blue-eye region. These other regionswere usually located near the edge of the kernel or in areaswith shadows, due to undulations on the kernel’s surface.On the undamaged kernels, RGB values of edges andshadow areas were recorded from 30 pixels scatteredaround the kernels.Color featureBlue-eyeEndospermShadowsR122.4 (17.7)118.6 (43.8)136.7 (10.6)G100.2 (16.1)86.6 (20.3)109.9 (9.4)B65.1 (10.7)51.5 (14.8)69.6 (7.4)Hue24.4 (2.4)21.9 (3.0)24.1 (1.7)s0.47 (0.03)0.56 (0.07)0.49 (0.03)L43.7 (6.5)39.4 (10.5)48.1 (3.8)ab3.9 (2.0)23.2 (3.4)8.4 (11.8)25.5 (8.3)5.1 (1.8)26.4 (2.5)R-B57.4 (8.6)67.1 (37.1)67.1 (6.5)G-B35.1 (6.6)35.1 (7.3)40.3 (4.8)R-G22.2 (4.2)32.0 (35.2)26.7 (3.9)Fig. 6 Color image of a popcorn kernel with blue-eye damage (left)and the saturation image (right) (Color figure online)123
32T. Pearson et al.Next, the saturation image was processed to extractspots indicating blue-eye damage. Note that the germ andtip cap regions are high in saturation, whereas the blue-eyeregion was relatively low. Portions close to the edge of thekernel can have similar saturation levels to the blue-eyeregion. A simple nonlinear filter was developed to distinguish blue-eye regions from other regions having similarsaturation levels that can be executed in real time.The filter simply compares the saturation levels of 5pixels on the same line, 1 pixel is centered between theother four, two are spaced only 1 pixel from the center, andthe other two are separated from the center pixel by a largergap of pixels. The pixels location in this filter can bedescribed as {x - gap, x - 1, x, x ? 1, x ? gap} wherex is the pixel location along the image line and gap isdistance in pixels. If the saturation level of least two of thepixels at x - 1, x, or x ? 1 are less than both of the pixelsat x - gap and x ? gap by more than a preset offset value,then the center pixel is considered to be part of a blue-eyeregion. This effectively identifies a ‘‘dip’’ in the saturationlevels across the pixels that is at least 2 pixels wide and lessthan the offset value from the surrounding pixels. Darkerregions along the edge of the kernel are not counted asblue-eye as they do not have such a dip associated withthem. This simple filter was applied to all the images savedwith gaps ranging from 5 to 15 pixels in single pixelincrements and offsets ranging from 10 to 30 levels ofsaturation in increments of four. For each combinationof gap and offset, the pixels that were considered to be partof a blue-eye kernel were counted. Afterwards, stepwisediscriminant analysis was used to select the best combination of gap and offset for distinguishing blue-eye damaged kernels from undamaged kernels. In addition to thecounts, the averages and standard deviations of the imagepixels classified as blue-eye from the R-B image weresaved to help reduce false positive errors caused by shadows on undamaged kernels. It was observed that shadowregions of undamaged kernels had slightly higher levels inthe R-B image and a much lower variance of R-B pixelvalues than did the blue-eye regions.FPGA implementationThe FPGA was programmed to compute saturation valuesfrom the RGB values through a modification of the standard conversion of the procedure [7] as outlined below.maxmins¼ maximumðR; G; BÞ¼ minimumðR; G; BÞ¼ ðmax minÞ maxwhere R, G, and B are the interpolated red, green, and bluevalues of the pixel, and s is the saturation. However, for allpixels corresponding to the kernel in the test set, R is the123maximum and B is the minimum, which simplifies thesaturation computation as shown in Eq. 1.s ¼ ðR BÞ Rð1ÞAll of the R-B values were found to be less than 127 andso were stored in a 7 bit variable. The division wasperformed by left shifting the R-B value 9 bits to obtain amaximum of a 16 bit number, then dividing by R (an 8 bitnumber) using a division function supplied by the Quartus IIsoftware. This resulted in s being scaled between 0 and 255.The 48 MHz clock was used to perform the division and wascompleted under four clock cycles so this computation doesnot cause any delay to the image processing. Finally, toeliminate any effects of background pixels having similarsaturation values to the kernel, all pixels with an R value lessthan 15 were set to a saturation value of zero.The number of pixels classified by the filter as belonging toblue-eye regions was saved in addition to the sum of the R-Bvalues and the sum squared of the R-B values of the pixels inthese regions. The average and the variance of the pixelsclassified as blue-eye regions were then computed with Eq. 2using division functions supplied by the Quartus II software. var(blue-eyeÞ ¼ sum2 sum mean ðn 1Þð2Þwhere var(blue-eye) is the variance of the R-B image pixelsthat were classified as belonging to a blue-eye region, sum,sum2, and mean are the sum, sum squared, and mean of theR-B regions classified as blue-eye, respectively, and n isthe number of pixels classified as belonging to a blue-eyeregion. Although the computation of variance requires thecomputation to be broken into three clock cycles, one formean computation, one for multiplication and subtraction,and the division of a 22 bit number by a 12 bit number, thetime required for the variance computation to execute aftera complete image was acquired was less than 1 ls.Therefore, for practical purposes, this method did not delaythe ability of the sorter to respond in real time.Three different image processing modules were programmed such that the three parallel kernel channels couldbe inspected independently of one another. The programrequired approximately 72 % of the logic elements available on the FPGA and 68 % of the memory. The EEPROMon the FPGA board was programmed with a defaultthreshold level to classify kernels, and this level was readimmediately after powering up. The threshold level wasprogrammed to be adjustable with the attached quadencoder but was not used in the sorter testing experimentsas discussed below.Sorter testingAfter programming the FPGA, the 2,000 kernels used todevelop the image algorithm were run individually down
A machine vision system for high speed sortingthe sorter a second time. As computed in real time by theFPGA, the count of blue-eye pixels, mean, and variancefrom the R-B image were recorded. These data were usedto set threshold levels for separating the unsorted samples.Sorting was performed on the non-hand-picked 500 gportions of the samples that were collected from the fiveseparate bins over two different years. After sorting, theaccepted and rejected streams from each sample wereinspected, and the number of blue-eye kernels in eachfraction was recorded.ResultsFrom the 2,000 images, it was determined that the optimalpixel gap and pixel saturation offset to use in the filter were10 pixels and 24 levels of saturation, respectively. Applying these parameters to the training set, the blue-eyekernels had an average count of 146 blue-eye pixels, andthe undamaged kernels had an average count of 30 blueeye pixels. The minimum count for all of the kernels withblue-eye damage was 15, whereas 49 % of the undamagedkernels had counts less than 15. Inspection showed that92 % of the blue-eye damaged kernels had counts greaterthan 60, whereas 87 % of the un-damaged kernels hadcounts less than or equal to 60, indicating a false positiverate of 13 % if a threshold of 60 was used. Most of theundamaged kernels with greater than 60 pixels classified asblue-eye were due to shadows on the kernels from irregularkernel surface morphology. The false positive rate could bereduced by using var(blue-eye) in conjunction with thenumber of pixels that were classified as blue-eye. The studyshowed that 79 % of the undamaged kernels with blue-eyecounts between 60 and 90 had var(blue-eye) values of 35 orless. Conversely, 87 % of the actual blue-eye damagedkernels had var(blue-eye) values greater than 35. Therefore, a three-step classification scheme was used asfollows:(1)(2)(3)If the blue-eye pixel count [90, then classify thekernel as blue-eye damaged.If the blue-eye pixel count is between 60 and 90, andvar(blue-eye) [35, then classify it as blue-eye; otherwise classify it as undamaged.If the blue-eye pixel count B60, then classify it asundamaged.This classification scheme correctly classified 92 % ofthe blue-eye damaged kernels and 94 % of the un-damagedkernels from the 2,000 hand-picked kernels from thetraining set.After the classification scheme was programmed into theFPGA, the 10 un-picked 500 g popcorn samples weresorted. After inspecting these samples, it was found that, on33Table 2 Sorting accuracies for the ten popcorn samples tested sortedfrom highest blue-eye accuracy to lowestSampleYearsBlue-eyeaccuracy (%)Un-damagedaccuracy (%)Averageaccuracy 92102007869691909492Averageaverage, 90 % of the blue-eye damaged kernels wereremoved, and 94 % of the un-damaged kernels wereaccepted. The sorting accuracies among the ten samplesranged from 85 to 94 % for blue-eye damaged kernels and92 to 96 % for undamaged kernels. Some kernels tended tobe more round in shape, and they did not orient as well asthe others; this was one reason for the sorting accuracydifferences among the samples. The two samples with themost round-shaped kernels had the lowest accuracy forblue-eye damage but the highest accuracy for un-damagedkernels. The accuracies for all ten samples are shown inTable 2.DiscussionThe accuracy of this sorter was comparable or better thanprevious technologies for separating blue-eye damagedpopcorn. The original FPGA-based sorting system (Pearson[4]) achieved an average accuracy of 83 % compared with92 % for the current study. The primary reasons for thebetter accuracy are the use of saturation and R-B valuesfrom the shadows; the original system used only the Rpixels in the image. The LED lights used on this
lens was placed over the LED array (C-002, DBM Reflex Lighting Solutions, Laval, Que bec) to diffuse the light from each LED and focus it onto the point of imaging. Camera circuit board A circuit board with an image sensor (KAC-9628, Eastman Kodak Co., Rochester, NY) directly linked to a