Transcription
International Journal of Development and SustainabilityOnline ISSN: 2186-8662 – www.isdsnet.com/ijdsVolume 1 Number 2 (2012): Pages 85-98ISDS Article ID: IJDS12060301Sizing PV-wind hybrid energy system forlightingMustafa Engin 1*, Dilşad Engin 2Ege Higher Vocational School Department of Electronics Technology, Ege University, 35100 Bornova, Izmir, TurkeyEge Higher Vocational School Department of Control and Automation Technology, Ege University, 35100 Bornova, Izmir,Turkey12AbstractSizing of wind and photovoltaic generators ensures lower operational costs and therefore, is considered as animportant issue. An approach for sizing along with a best management technique for a PV-wind hybrid system withbatteries is proposed in this paper, in which the best size for every component of the system could be optimizedaccording to the weather conditions and the load profile. The average hourly values for wind speed and solarradiation for Izmir, Turkey has been used in the design of the systems, along with expected load profile. A hybridpower model is also developed for battery operation according to the power balance between generators and loadsused in the software, to anticipate performances for the different systems according to the different weatherconditions. The output of the program will display the performance of the system during the year, the total cost ofthe system, and the best size for the PV-generator, wind generator, and battery capacity. Using proposed procedure,a 1.2 kWp PV-wind hybrid system was designed for Izmir, and simulated and measured results are presented.Keywords: PV-wind hybrid system, PV, Wind turbineCopyright 2012 by the Author(s) – Published by ISDS LLC, JapanInternational Society for Development and Sustainability (ISDS)Cite this paper as: Engin, M. and Engin, D. (2012), “Sizing PV-wind hybrid energy system forlighting”, International Journal of Development and Sustainability, Vol. 1 No. 2, pp. 85–98.*Corresponding author. E-mail address: mustafa.engin8@gmail.com
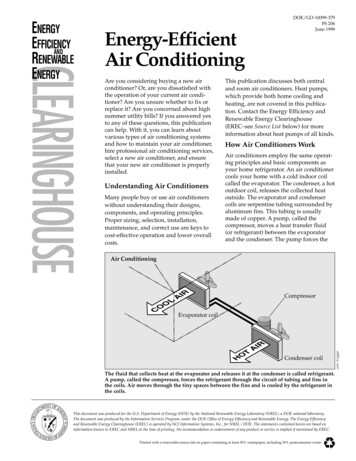
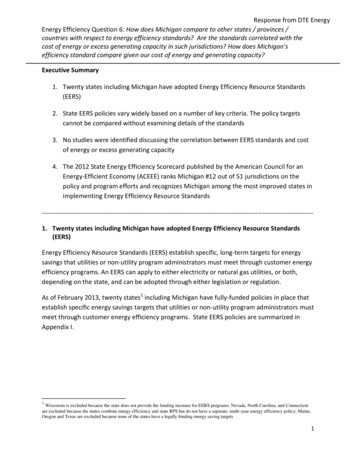
International Journal of Development and SustainabilityVol.1 No.1 (2012): 85–981. IntroductionA stand-alone solar energy system cannot provide a continuous source of energy due to the low solarradiation periods. Also, stand-alone wind energy systems cannot satisfy load demands due to the significantfluctuations in the magnitude of wind speeds from one hour to another, or throughout the year. Therefore, anenergy storage system will be required for each of the two systems in order to satisfy the power demands.Usually storage systems are very expensive and need to be reduced to their minimum possible storage sizefor a renewable energy system to be cost effective. Hybrid energy systems can be used to reduce the energystorage requirements as they rely on multiple sources of energy to ascertain continuous operation with oneor more inactive power sources. While the total system output may be less than the hybrid components’individual capabilities, the reduction of battery size is economically significant. Solar and wind energy whichare two random sources of renewable energy are individually less reliable. However, in many regions, thesum of solar and wind energy has approximately constant value during all seasons. Combining these tworenewable energy sources could make the system more reliable and depending on the regional conditions,the system costs might stay constant or slightly decrease. However, the energy system sizing procedure andoperation control strategies are getting more complex. Configuration of the PV-wind hybrid energy systemdepends on the wind speed and solar insolation at the considered site.Graphical solution (Markvart, 1996) defines PV-wind hybrid system configuration using only seasonalvariations instead of hourly variations. This method defines the size of PV arrays and wind generatoraccording to the supply-demand criteria and then it can be optimized according to the cost criteria. SeelingHochmuth (1997) takes interdependency between sizing and operation strategy into account. SeelingHochmuth and Marrison (1997) have solved the non-linear sizing problem using genetic algorithm. Beyerand Langer (1996) have determined the size of hybrid system using limited meteorological parameters.Kellogg et al. (1998) have developed a simple iterative technique that is based on energy balance for sizingPV-wind hybrid energy systems. Green and Manwell (1995) and Morgan et al. (1997) presented softwaretools for assessing hybrid system performance for pre-determined system configuration.In this paper, hybrid system model that covers costing and system performance variables is identified.Decision variables, objective function, and constraints are determined for this model. Using simple iterativetechnique, sizing variable and performance variables are optimized according to the objective function underconstraints.2. Solar evaluation instruments and measurementsThe Solar-Wind Meteorological Station is located on the roof of the Solar Energy Institute Building in EgeUniversity for determining the local potentials of both solar and wind energy, as shown in Figure 1. Thisstation consists of four main sections, namely (i) sensors unit, (ii) data logger unit, (iii) electric power unit,and (iv) tripod kit. Table 2 gives the specification of the equipment used for the solar radiation and windenergy measurements. The station is operated with PV-battery hybrid power supply and hereby the auxiliaryenergy is not required. The data gathering is made at every second and all variables monthly averages are86ISDS www.isdsnet.com
International Journal of Development and SustainabilityVol.1 No.1 (2012): 85–98also logged. The Solar-Wind meteorological station was installed in October 1993 and the measurementshave been taken since then (Ulgen and Hepbasli, 2002).Figure 1. The solar-wind meteorological station at Ege University, Bornova, Izmir, Turkey3. Hybrid energy system performance modelPV-wind hybrid energy system’s main components are shown in Figure 2. PV array and wind turbinegenerate energy for the load. Battery stores excess energy and supplies to the load when the generatedenergy is not enough for the load. Battery charge controllers keep battery voltage within specific voltagewindow and thus, they prevent over-discharge or over-charge regimes. To protect the battery againstovercharging, PV array and wind generator is disconnected from the system, when the DC bus voltageincreases above Vmax-off and when the current required by the load is less than the current generated by thePV array and wind generators. They are connected again when DC bus voltage decreases below V max-on. Toprotect the battery against excessive discharging, the load is disconnected when the DC bus voltage fallsISDS www.isdsnet.com87
International Journal of Development and SustainabilityVol.1 No.1 (2012): 85–98below Vmin-off and when the current required by the load is greater than the current generated by the PV arrayand wind generators. The load is connected again when DC bus voltage increase above V min-on. Inverterconverts generated energy from DC to AC for AC load.Figure 2. Hybrid energy system components.3.1. PV module performance modelThe most important electrical characteristics of a PV module are short circuit current, open-circuit voltage,and maximum power point. These characteristics depend on temperature and irradiance. The temperaturecoefficient for the open circuit voltage is negative and large, approximately equal to –2.3 mV/ C for anindividual cell. On the other hand, the current coefficient is positive and small, approximately 6 μA/ C for asquare centimeter of the module area. In practical calculations, current variations with temperature can beneglected, and the voltage variations with temperature can be defined for a PV module consisting N c cellsconnected series using equation 1 (Markvart, 1994).dVOC/dt -2.3 Nc mV/ C(1)The operating temperature of the cell which differs from the ambient temperature, determines the opencircuit voltage. Operating temperature can be calculated using equation 2 for a given ambient temperature(Lorenzo, 1994).TC Ta 0.03 Ga88(2)ISDS www.isdsnet.com
International Journal of Development and SustainabilityVol.1 No.1 (2012): 85–98where Tc is operating cell temperature, Ta is the ambient temperature and Ga is irradiance. Open-circuitvoltage of the cell can be calculated using equation 3. CCCVOC VOC, 0 2.3 mV/C TC T0 (3)For the PV cell, the short-circuit current is proportional to the irradiance where the open-circuit voltageis a logarithmic function of the current. Using equation 4, PV cell short-circuit current can be calculated forgiven irradiance (Hansen et. al., 2000).CCI SC I SC, 0Ga / Ga , 0(4)PV module’s short-circuit current is proportional to the number of parallel connected PV modules.MCI SC N PC I SC(5)PV module’s open-circuit voltage can be calculated using equation 6.MCVOC N SC VOC(6)The equivalent series resistance of the module can be calculated as below:RSM N SC RSCN PC(7)The PV module’s current IM under arbitrary operating condition can be described as (Hansen et. al.,2000);M V M VOC RSM I MM I M I SC1 exp N SMVt C (8)The necessary number of PV modules to be connected in series is derived by the number of modulesneeded to match the bus operating voltage.MVPV VOC N SM(9)The current output of a PV array at time t, IM (t), is related to the number of parallel strings as below(Hansen et. al., 2000):ISDS www.isdsnet.com89
International Journal of Development and SustainabilityI PV (t ) I M (t ) N PM f MMVol.1 No.1 (2012): 85–98(10)3.2. Wind turbine performance modelCharacteristic curves for wind turbines are given as power output versus wind speed at the hub height. Windturbines are never connected in series (Seeling-Hochmuth, 1998). Several wind turbines can be connected inparallel to match the system current requirements. This can be done with parallel strings of the same windturbine type or with strings of a different wind turbine type. It is assumed here that at most two differentturbine types are used at the same time in one system. Yearly energy densities for wind are calculated usingequation 11. If we assume the average yearly energy demand as D, we can determine average wind turbinediameter using equation 12, so that wind turbine type can be defined easily (Bagul et al., 1996).PWT 0.5 . Cp . air . 3D Dav, year1 hours / year PW 4(11)(12)The power output of the wind turbine array at time t,PWT (t ) N wt , type Ii 1WTi(t ) VWTi N PWTi(13)3.3. Battery performance modelBatteries in a hybrid system are connected in series to obtain the appropriate nominal bus voltage. Therefore,the number of batteries connected in series for the same type of battery in a battery bank is calculated asbelow:NSBat VPV/VBat(14)The hybrid system can have several different types of battery banks. The battery state of charge of abattery bank at time t is calculated based on adding the charge current (positive sign) or discharge current(negative sign) to the battery bank state of charge at the previous time instant. When adding the battery90ISDS www.isdsnet.com
International Journal of Development and SustainabilityVol.1 No.1 (2012): 85–98current to the battery state of charge, self discharge losses and battery charging losses should be taken intoaccount (Seeling-Hochmuth, 1997).SOC(t 1) SOC (t ) BatBani 0ii I Bat (t ) t i ( I kolbat (t )) N PBat(15)3.4. Inverter, charger, and loads performance modelThe inverter characteristics can be described by the inverter input-output relationship. Some of the powergoing into the inverter will be lost due to transformation losses that are named inverter efficiency losses.Pinv ,ip inv Pinv op , inv f ( Pinv op )(16)In fact, charge regulators can be modeled as a switch which connects and disconnects generator tobattery or load according to battery state of charge, temperature or load demand (Engin, 2002). The outputpower, PBC-OP of the battery charger equals to the input power PBC-IP multiplied with the efficiency lossesduring the energy conversion. Efficiency losses depend non-linearly on the DC output power and therefore,non-linearly on the DC output current of the battery charger.PiBC ip BC PBC op , BC f ( PBC op )(17)Efficiency losses can be calculated from efficiency losses versus output power curves that are given bythe manufacturers. In most cases, two types of loads are present, DC appliances 12V, 24V, 48V or ACappliances 220V. The estimated power consumption should be given in intervals of hourly, daily, or yearly. Ifboth a DC and an AC generator exist, some of the DC generator energy can be routed through the inverter tothe AC loads.I Gdc I dcL , or I Gdc I dcL I inv ip(18)3.5. Costing model of hybrid systemIt is stated by Seeling-Hochmuth (1998) that in the life cycle costing equipment and operation costs arecompiled and discounted over the assumed project life. The hybrid system life cycle costs are defined as theinitial investment and future discounted operation costs.ISDS www.isdsnet.com91
International Journal of Development and SustainabilityNumberof Compenents LCC CC Discounted COP ,i i 1 Vol.1 No.1 (2012): 85–98(19)The hybrid system operation costs are in general non-linear, and depend largely on component size andtype, and the way the system is operated. As they depend on future operations, they can only be estimatedroughly (Seeling-Hochmuth, 1998).The sizing variables are sizes of component types and their number to be installed. From the PV module,wind turbine, battery, battery charger and inverter performance models sizing variables are defined asfollows:NSBat, NPBat, NSM, NPM, NPWT, NPin, PVtype, WTtype, INtype, BCtype, BATtypeHybrid system must include operation strategies that describe the energy flow between the generatorand the load. The operati
In this paper, hybrid system model that covers costing and system performance variables is identified. Decision variables, objective function, and constraints are determined for this model. Using simple iterative technique, sizing variable and performance variables are optimized according to the objective function under constraints. 2. Solar evaluation instruments and measurements The Solar .