Transcription
Rick SaddlerHit & Run CandlesticksIntroduction to Tradingwith Japanese sticksTradingforProfits,LLCPhone:(417)- ‐848- ‐3519www.hitandruncandlesticks.comTrading for Profits LLCCopyright All rights reserved
Rick SaddlerHit & Run CandlesticksIntroduction to Tradingwith Japanese CandlesticksTable of ContentsIntroduction to Trading with Japanese CandlesticksWhy, Candlestick Signals and PatternsRecognizing the story behind the signalsDoji and Doji VariationsEngulfing PatternsHarami PatternsKicker SignalsMorning StarEvening StarShooting StarHanging ManHammersPiercing PatternDark Cloud CoverThat’s a WrapAll efforts have been made to assure the accuracy of this written material. This information is provided for educationalpurposes only. No communication should be construed as financial or trading advice. Rick Saddler is not a stock broker,broker dealer or investment adviser. Investing and trading involves significant financial risk.Trading for Profits LLCCopyright All rights reserved2
Rick SaddlerHit & Run CandlesticksIntroduction to Tradingwith Japanese CandlesticksIntroduction to Trading with JapaneseCandlesticksJapanese Candlesticks are gaining popularity among individualtraders, mainly because they are easier to learn and interpret versusbar charts. Of equal importance is the fact that they fall into thecategory of leading indicators. Unlike lagging indicators (for example;a moving average) which appear after the fact, the JapaneseCandlesticks signals are leading indicators because they provide earlywarning alerts to possible price movements. When you see one ofthese alerts confirmed by moving averages, they can provideprofitable trade opportunities.Rather than bore you with the history of Japanese Candlesticks, sufficeit to say they have been in use for over 400 years. They are reliableand provide traders with extremely valuable insight to potential pricemovements.Many traders use Japanese Candlestick charts simply because they aremore visually appealing than bar charts and as a result they are easierto read and interpret. The candlestick chart appears to be threedimensional making it easier to see the relationship between the openand close and the high and low. Each candlestick allows you to moreeasily detect the price action that is indicative of either selling pressureor of buying pressure. The body of the candle itself is thicker than theshadow also making it far easier to see how the close price relates tothe open price than when reading bar charts.Japanese Candlesticks also provide more of a real time depiction ofmarket sentiment whereas bar charts often only signify market noise.Candlesticks utilize one to three time periods and are able to visuallyblock out market noise unlike bar charts. Bar charts will actually allowspikes to highs and lows to be prominent in their data unlikecandlesticks which are able to focus on what the market actually did toforce price action during a period of trading.Trading for Profits LLCCopyright All rights reserved3
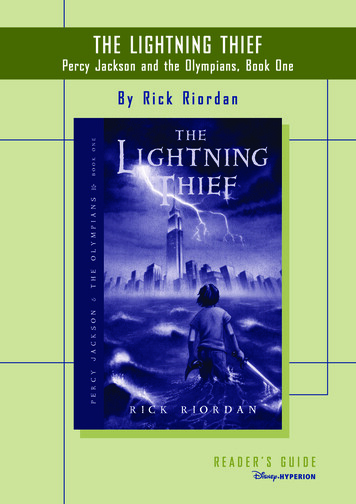
Rick SaddlerHit & Run CandlesticksIntroduction to Tradingwith Japanese CandlesticksThe image below illustrates the construction of Japanese Candlesticks.The hollow Bullish candle forms when the stock price closes higherthan its opening price.The solid Bearish candle forms when the stock price closes lower thanits opening price.Candlestick charting methods have quickly gained popularity over thelast several years. Whether you are a novice trader, or experiencedprofessional, I believe once you understand the power behind thesignals you will never go back to other charting methods again!The art is not in making money, but in keeping it!” – UnknownTrading for Profits LLCCopyright All rights reserved4
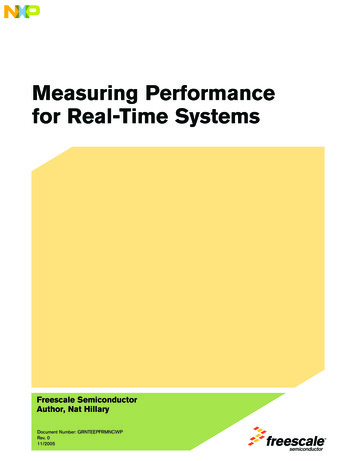
Rick SaddlerHit & Run CandlesticksIntroduction to Tradingwith Japanese CandlesticksCompare Japanese Candlesticks to other charting formats. Bar Charts: Better than line charts for displaying opening andclosing prices, yet still visually limited. Point and Figure Charts: Good for visualizing support andresistance but so are candlesticks and not as easily learned. Line Charts: straightforward illustrations best used for shorttrading frames but limited data compared to candlesticks.Trading for Profits LLCCopyright All rights reserved5
Rick SaddlerHit & Run CandlesticksIntroduction to Tradingwith Japanese Candlesticks Japanese Candlesticks Chart: obviously my chart preference,as the balance of this document will attest to the manyattributes of the effectiveness of utilizing the signals andpatterns.Now that you can visibly compare the other charting formats, let’s lookat some of the advantages of trading with Japanese Candlesticks.1. Quickly see opening and closing prices, which areimportant indicators for support and resistance levels.2. One quick glance is all you need to see whether the buyersor sellers are in control.3. Each individual candlestick tells a story of investorsentiment, giving you an insight not only how to trade butwhen.4. The majority of popular charting systems utilize candlesticksignals and patterns in their scanning systems. What agreat way to narrow down thousands of trades into amanageable list.Trading for Profits LLCCopyright All rights reserved6
Rick SaddlerHit & Run CandlesticksIntroduction to Tradingwith Japanese Candlesticks“Never spend your money before you have it”- Thomas JeffersonWhy I have a passion for CandlestickSignals and PatternsOnce upon a time, maybe just like you, I began my education to learnhow to make profits from trading the markets. I chose to focus mainlyon technical analysis versus fundamental analysis. My first obstaclewas to wade through copious declarations of the latest ‘Holy Grail’ oftrading techniques. My decisions became much easier once I wasintroduced to Japanese Candlesticks.There are a number of complex, and often over-whelming, amounts ofinformation for new investors. Even if you are able to refrain fromfalling victim to the latest gimmicks, the tried and true methods cansometimes be mathematically challenging. Interesting observation;many of these indicators suggest using a wave, arc, fan, or some typeof visual cue to use in conjunction with the resulting data.The visual picture provided by candlesticks gives us a quickassessment of anticipated price movement. By learning a few basicsignals, even a new chartist can easily see the ‘story’ behind thecandlesticks.Most every trading platform available includes scanning ability forutilizing candlestick signals and patterns. This is especially important ifyou don’t want to spend your time reviewing thousands of charts.Considering there are over 10,000 entities from which to choose, timemanagement is a must.And, my most popular reason for using candlesticks? They workexactly the same in varying time periods. So whether I want to find aswing trade, run a quick scalp, or place a day-trade – Candlesticksignals work equally well in all time frames.Trading for Profits LLCCopyright All rights reserved7
Rick SaddlerHit & Run CandlesticksIntroduction to Tradingwith Japanese CandlesticksRecognizing the story behind the signalsTo effectively trade with candlesticks one must first understand theinformation contained in the construction of the signal and themeaning behind the variations in the different candlestick signals andpatterns. But, don’t worry, there are only a dozen main signals. Onceyou’re familiar with these major signals, the rest falls into place quitenicely.There are 4 main components that build a candlestick:1. Opening price; is the first piece of data needed and will startthe candlestick either at the top or bottom part of the candle,depending on whether price action is Bullish or Bearish. Asillustrated earlier, the Bullish candlesticks are usually representedby a white, or green body on the chart. The Bearish candlesticksare usually black or red, depending upon your chartingprogram.2. Highest price; is illustrated by a wick (or tail) above the bodyof the candle unless the price never goes above the openingprice. In this case there is no wick above the body of the candle.3. Lowest price; is also represented by a wick (or tail) below thebody of the candle. Again, if the underlying stock is experiencingconsiderable Bullish action, there may be no wick below thebottom body of the candle. (illustrating the price never tradedbelow the close of the day.)4. Closing price; the final piece of data needed to complete thecandlestick signal. The closing price finishes the body of thecandle near the top (if Bullish) or the bottom (if Bearish).Trading for Profits LLCCopyright All rights reserved8
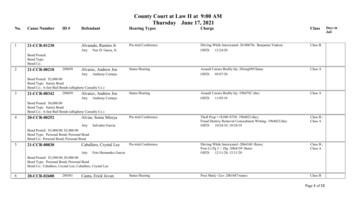
Rick SaddlerHit & Run CandlesticksIntroduction to Tradingwith Japanese CandlesticksDoji and Doji VariationsDojiThe Doji is one of the most informative signals in Candlestick tradingand is comprised of one candle. It forms when the opening priceand closing price occur at the same level (or very close) in a specifictimeframe.In order for a doji signal to be valid it must meet two conditions. First,the opening price and the closing price of the stock must be almost atthe same price level (as stated above). Second, there must be an uppershadow or a lower shadow, or both.When a doji candlestick is formed, a cross formation appears (as seenabove) with the horizontal line representing the opening price andclosing price occurring at the same level. The vertical line on the dojicandlestick chart represents the total trading range during thattimeframe. This clearly indicates that the bulls and the bears are atan equilibrium signifying a state of indecision. When this occurs thetrader should keep an eye out for a trend reversal.Doji lines are patterns in the doji candlestick chart with the same openand close price. There are three special types of Doji lines explained onthe next page.Trading for Profits LLCCopyright All rights reserved9
Rick SaddlerHit & Run CandlesticksIntroduction to Tradingwith Japanese CandlesticksDoji Variations1) Dragonfly Doji – This doji line has a long lower shadow and noupper shadow and it indicates a bearish trend reversal. This type ofdoji opens at the high of a session, has a significant inter perioddecline, then it climbs back up closing at the same level as theopen.2) Gravestone Doji – This doji line has a long upper shadow and nolower shadow and indicates a bullish trend reversal. It is derived bythe formation of the signal looking like a grave stone and is formedwhen the opening price and closing price occur at the low of the day.Its specialty is for calling market tops and it could indicate imminentdisaster for a stock.3) Spinning Top (Long-Legged) Doji – This doji line has a longupper and lower shadow with the price in the middle of the range. It is avery important reversal signal and it signifies a great amount ofindecision in the market. It is formed when prices trade well over andbelow the day’s opening price, but then close almost at the same levelas the opening price.Trading for Profits LLCCopyright All rights reserved10
Rick SaddlerHit & Run CandlesticksIntroduction to Tradingwith Japanese CandlesticksEngulfing PatternsEngulfing patterns form when the body of the second candlestickcompletely engulfs the first. They often complete other reversalpatterns, showing even stronger evidence that an eminent change willoccur. Therefore; Engulfing Patterns are frequently spotted at the topor bottom of a move.Bullish Engulfing PatternThis is a major reversal pattern comprised of two opposite coloredbodies. It is formed after an established downtrend, and it opens lowerthan the previous day’s close; and closes higher than the previousday’s open. The first candlestick represents a falling share price (black orred image) and the second candlestick represents the share pricestarting low and ending up at or near its highs (white or green image).To qualify as a Bullish Engulfing pattern these conditions must be met.1. There must be a definable downtrend.2. The white or green candle must completely engulf the bodyof the previous black or red candle.3. The body of the engulfing candle must be the opposite color ofthe first candle. (the exception would be if the first candlestick isa Doji, or small bodied candle)The size of the black or red candlestick is of no consequence,however the shadows (or tails) of the small candlestick (black orred) are short, which enables the body of the large candlestick (whiteor green) to cover the entire candlestick from the previous day. Thesize of the white or green candle is of more consequence because thelarger it is, the more bullish the anticipated reversal.Trading for Profits LLCCopyright All rights reserved11
Rick SaddlerHit & Run CandlesticksIntroduction to Tradingwith Japanese CandlesticksWhat does this reversal pattern indicate is happening in themarkets?The bullish engulfing pattern is used when a stock has been decliningand it typically represents a change in investor sentiment. Theassumption that this pattern carries is that after a period of sellingpressure, the white or green candle forms because the stock hasopened below the previous close; the buyers moved in and pushed theprice higher. (The exception to this rule, however, is if the first realbody of the engulfing pattern is a doji or an extremely small body. Adoji candlestick chart engulfed by a very large white or green real bodycould be a bottom reversal).To confirm this pattern, the share price must strengthen further in thefollowing time period, or in other words, a bullish confirmationshould come within 1 to 3 time frames after the pattern.The name of this pattern implies that the bulls have taken control ofprice movement from the bears. The bullish engulfing pattern isassociated with a declining trend in price, which implies that a low orend to the price decline has occurred.Trading for Profits LLCCopyright All rights reserved12
Rick SaddlerHit & Run CandlesticksIntroduction to Tradingwith Japanese CandlesticksBearish Engulfing PatternThe bearish engulfing pattern consists of a small white/green candlestickwith short shadows or tails followed immediately by a large black/redcandlestick that engulfs the previous candle.To simplify, engulfing patterns are when the body of the secondcandlestick engulfs the first and are considered reversal patterns.To qualify as an engulfing candlestick, certain conditions must be met.1. There must be a definite uptrend.2. The second real body (do not include the tails) should have theopposite color of the first real body.3. The second day’s body should completely engulf the previousday’s body. (I use the example of ‘day’ but it is the same in alltime periods)The first day’s color is the same as the trading trend. In order to beconsidered a bearish engulfing pattern, the second day of the signalshould be a black (or red) candle opening above the close of theprevious day and closing below the open on the previous day’s white(or green) candle.It is found at the top of an uptrend, meaning the stock must be in adefinite uptrend before this signal occurs. It is important to note thatthis signal often follows or completes the doji, the hammer, or thegravestone patterns.Trading for Profits LLCCopyright All rights reserved13
Rick SaddlerHit & Run CandlesticksIntroduction to Tradingwith Japanese CandlesticksWhat does the bearish engulfing pattern indicate is happeningin the markets?This pattern typically is accompanied by an uptrend in a security andcan indicate a peak or a slowdown in its advancement. It may signal afuture bearish trend which means that the bears are overwhelming thebulls and prices will move down.The second black (or red) candlestick begins to form, after anadvance, and when residual buying pressure causes the security toopen above the previous close.Sellers then begin to drive the prices down and by the end of thesession, the prices will move below the previous open. As a result, thesecond candlestick (black or red) engulfs the previous day’s body andcreates an apparent short-term reversal. The bearish engulfing patterncreates a very strong probability that the buying is over and selling willdominate price action so there is opportunity for creating a good shortposition.This pattern is the exact opposite of the bullish engulfing pattern. Bothindicate reversals at the tops and the bottoms and are easilyrecognized indicators at the end of a trend. The signals are extremelyaccurate when a bullish engulfing pattern occurs during oversoldconditions, and the bearish engulfing signal is equally valid when itoccurs in the overbought area.Trading for Profits LLCCopyright All rights reserved14
Rick SaddlerHit & Run CandlesticksIntroduction to Tradingwith Japanese CandlesticksHarami Candle - Bullish“White body within black candle”The bullish harami candle is found at the bottom of a downtrend, andis the reverse of the engulfing pattern. The Japanese definition of thiscandle means pregnant woman or body within. When identifying abullish harami candle the body of the first candle must be the samecolor as the current trend and should be a long black (or red) candle.The body of the second candle is a white (or green) candle and itopens and closes within the body of the previous day’s candle.Additionally, as mentioned above, the downtrend must have beenevident for a good period of time with a long black or red candleoccurring at the end of the down trend. The presence of this candleindicates that the trend is over. Also, the location and the size of thesecond candle can determine the magnitude of the reversal.What does this bullish candlestick pattern indicate is happeningin the markets?This bullish signal occurs during a downtrend when the bulls step inand open the price higher than the previous day’s close. Price goesup as the bulls continue to preside. This is a result of investors holdingtheir positions, in hopes of a reversal only to eventually give up andsell, indicating that the trend is over. In other words, the bears areconcerned and the shorts begin to cover their positions. The bulls arethen able to close the candle higher into the previous day’s body.Confirmation is required the following day. The bulls must stay incontrol, convincing the bears that the trend is over. This is a greatopportunity to enter into a long position.When identifying the bullish candle it is important to note two things.First, the higher the white or green candle closes up on the redTrading for Profits LLCCopyright All rights reserved15
Rick SaddlerHit & Run CandlesticksIntroduction to Tradingwith Japanese Candlestickscandle, the more convincing it is that a reversal has occurred. Second,the longer the black or red candle and the white or green candle thestronger the reversal.Candlestick Harami – Bearish“Black body within white candle”The bearish candlestick harami is found at the top of an uptrend, andis the exact opposite of the bullish harami candle. It is also defined aspregnant or body within and it is a two candle formation.To be valid it must contain the following criteria. First, the body of thefirst candle is white (or green) and the body of the second candle isblack (or red). Second, price action must have been in a definiteuptrend in order for this signal to occur. This can be visually identifiedon a chart when the long white or green candle occurs at the end ofthe trend. In other words, when identifying this pattern, the body ofthe first candle must be the same color as the current trend. The nextday (or time period) should be a black or red candle opening below orlower than the close of the previous day, and closing above or higherthan the open of the previous day’s green candle. This also means thatthe first body of the pattern is a long body and the second body issmaller.Confirmation is needed and the next day (or time period) must showcontinued weakness.What does the bearish candlestick harami pattern indicate ishappening in the markets?This is an exciting candlestick pattern because it occurs at the top of atrend! The bears step in and open the price lower than the previousday’s close. The bulls then begin to take their profits and get outbefore the price closes lower for the day. In other words, moreTrading for Profits LLCCopyright All rights reserved16
Rick SaddlerHit & Run CandlesticksIntroduction to Tradingwith Japanese Candlesticksexperienced investors know when they see this signal that they musttake their profit and move on before the trend reverses. Otherwise,they will watch their profits quickly diminish.Additional information of interest - The longer the white/green andblack/red candles, the more forceful the reversal. Second, the lowerthe black/red candle closes down on the white/green candle, the moreconvinced investors are that a reversal has occurred, regardless of thesize of the black/red candle.Kicker SignalsKicker signals are one of the most powerful signals and they indicatea severe change in investor sentiment. This signal is most relevantwhen it occurs in the oversold or the overbought area, and it worksequally well in either direction (bullish or bearish).This two candle pattern formation occurs when two candles ofopposite colors form next to each other with a gap between thecandles.The Kicker Signal is considered one of the most important candlesticksignals, as it illustrates a strong change in investor opinion. Thechange in sentiment is so severe that it creates a dramatic visualchange of not only an abrupt change in direction but with suchstrength it creates a gap (void) between the changes.The first candle opens and moves upward in the direction of the currenttrend. The second (black or red) candle opens much lower than thefirst (white or green) candle’s close forming a gap. Price thencontinues lower which is the opposite direction of the previous day’scandle. There is typically little or no upper wick when seeing thissignal.Bearish Kicker SignalTrading for Profits LLCCopyright All rights reserved17
Rick SaddlerHit & Run CandlesticksIntroduction to Tradingwith Japanese CandlesticksIt is important to note that the trend is irrelevant for thissignal. This signal typically occurs due to surprising news likely toaffect investor sentiment. The price should never retrace into theprevious day’s trading range in order for this kicker signal to bevalid.A bearish signal of this nature indicates very strong selling pressure.There are also instances in which bearish kicker signals arestrengthened. A longer candles makes the reversal more dramatic, asdoes a larger gap.What do bearish kicker signals indicate is happening in themarkets?As previously discussed, this signal illustrates a dramatic change ininvestor outlook due to surprising news that changes the direction ofthe price. A true kicker signal demonstrates such a drastic change indirection that the new direction will continue with significant strengthfor a good period of time.Bullish Kicker SignalTrading for Profits LLCCopyright All rights reserved18
Rick SaddlerHit & Run CandlesticksIntroduction to Tradingwith Japanese CandlesticksThis signal is the exact opposite of it’s Bearish counterpart. The firstcandle opens up and then continues to move down in the direction ofthe current trend. The second (white or green) candle opens muchhigher than the first (black or red) candle’s close forming a gap. Pricethen continues higher which is the opposite direction of the previousday’s candle.It is important to note that the trend is irrelevant for thissignal. This signal typically occurs due to surprising news likely toaffect investor sentiment. The price should never retrace into theprevious day’s trading range in order for this kicker signal to bevalid.A bullish signal of this nature indicates very strong buying pressure.There are also instances in which bullish kicker signals arestrengthened. A longer candles makes the reversal more dramatic, asdoes a larger gap.Morning StarTrading for Profits LLCCopyright All rights reserved19
Rick SaddlerHit & Run CandlesticksIntroduction to Tradingwith Japanese CandlesticksThe morning star is a bullish reversal signal found at the bottom of adowntrend. It is a is a three candle pattern and suggests that goodthings are to come. Or, in other words, that prices are going toincrease.To qualify as a morning star signal four criteria must be met.1. The stock must be in a definite downtrend before this signal canoccur.2. The first day of the signal must confirm the current downtrendby displaying a long black (or red) real body. (the bears are incomplete control the first day)3. The second day displays a candle formation that indicates a stateof indecision as the star candle gaps away from the first day.(The star may also be a Doji Candle) Supply and demand isequal on this day.4. The third day should display a white (or green) candlestickthat should close at least halfway up the black (or red)candlestick.5. In other words, the long white/green body gaps up from theprior day. This third candle provides the confirmation needed toindicate a reversal. (This confirmation is apparent in themorning before the sun rises, thus giving this signal itsname.)Trading for Profits LLCCopyright All rights reserved20
Rick SaddlerHit & Run CandlesticksIntroduction to Tradingwith Japanese CandlesticksAdditional pattern notations for the morning star candlestick: The larger the candles, the greater force for a reversal. A gap (or window) between the first and second day, adds additionalodds for the reversal. Even more advantageous; a gap occurring before and after the starcandle Note: A gap is not as common and is not required, but whenyou witness a gap ‘pay heed’ there is potential for even greater force. The higher the third day’s candle comes up in relation to the firstday’s black/red candle, is even more compelling as it will cause thereversal to occur with greater strength.What does this signal indicate is happening in the markets?Again, this trend means that a strong downtrend has been in effectand the bears are in full control. A tug-of-war ensues causing greatconcern for the bears, and eventually the bulls are able to take over.“If you can count your money, you don’t have a billion dollars!” J. Paul GettyEvening Star CandlestickTrading for Profits LLCCopyright All rights reserved21
Rick SaddlerHit & Run CandlesticksIntroduction to Tradingwith Japanese CandlesticksThe evening star candlestick indicates bad things are on the horizonfor traders. Or, in other words, lower stock prices may be on the way.This pattern is a top reversal signal and is the opposite of themorning star signal. Investors must be careful when identifying theevening star candlestick pattern since it tends to be more difficult toidentify than other Japanese candlesticks patterns.The criteria required, in order for this signal to be valid includes thefollowing conditions.1. The stock must have been in a definite uptrend before this signalcan occur. (The bulls are in complete control on the firstday.)2. The first day of the signal must be a long white/green bodycontinuing the current uptrend.3. The second day (indecision day causing the star candleformation) increases the probabilities of a reversal. (The starmay also be a Doji Candle) Supply and demand is equal on thisday.4. The third day should be a long red/black body that closes downat least halfway into the body of the first day’s greencandle. This is proof the bears have stepped in with strength.(supply is far greater than the demand)Trading for Profits LLCCopyright All rights reserved22
Rick SaddlerHit & Run CandlesticksIntroduction to Tradingwith Japanese CandlesticksAdditional pattern notations for the evening star candlestick: The larger the candles, the greater force for a reversal. A gap (or window) between the first and second day, adds additionalodds for the reversal. Even more advantageous; a gap occurring before and after the starcandle Note: A gap is not as common and is not required, but whenyou witness a gap ‘pay heed’ there is potential for even greater force. The lower the third day’s candle comes down in relation to the firstday’s white/green candle, is even more compelling as it will causethe reversal to occur with greater strength.What does the evening star candlestick indicate is happening inthe markets?Again, this trend means that a strong uptrend has been in effect andthe bulls are in full control. A tug-of-war ensues while the sellers beginto take profits. This causes great concern for the bulls, and eventuallythe bears are able to take over.“Of one thing, be certain: if a CEO is enthused about aparticularly foolish acquisition, both his internal staff and hisoutside advisors will come up with whatever projections areneeded to justify his stance. Only in fairy tales are emperorstold that they are naked. “ Warren BuffetTrading for Profits LLCCopyright All rights reserved23
Rick SaddlerHit & Run CandlesticksIntroduction to Tradingwith Japanese CandlesticksShooting Star Candlestick SignalThe Shooting Star candlestick signal is a Bearish Reversal Signalindicating price has reached the top of its uptrend. It sends animportant alert for those traders with open long positions that it istime to close their trade. For experienced traders watching for newshort positions, it offers an early opportunity for greater profits.The Shooting Star Candlestick reversal signal criteria areFirst, there is an established uptrend.The candlestick has a small body and a long upper tail, or shadowequaling at least twice the length of the real body. (The uppertail shows the extent of the price movement during the tradingperiod) There should be little, or no, lower shadow (or tail).While not required, this pattern has even greater importancewhen there is a gap between the real body of the previoustr
Many traders use Japanese Candlestick charts simply because they are more visually appealing than bar charts and as a result they are easier to read and interpret. The candlestick chart appears to be three-dimensional making it easier to see the relationship between the open and close and the high and