Transcription
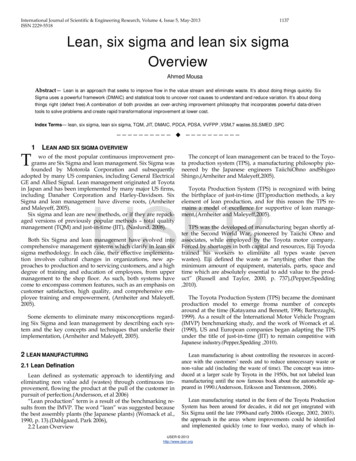
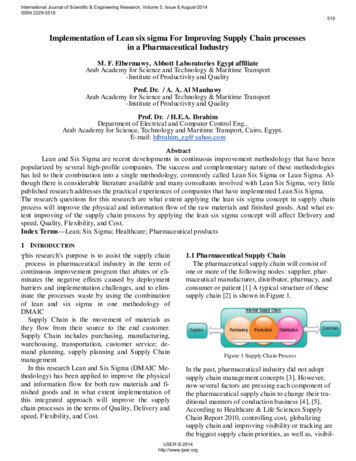
International Journal of Scientific & Engineering Research, Volume 5, Issue 8,August-2014ISSN 2229-5518519Implementation of Lean six sigma For Improving Supply Chain processesin a Pharmaceutical IndustryM. F. Elbermawy, Abbott Laboratories Egypt affiliateArab Academy for Science and Technology & Maritime Transport-Institute of Productivity and QualityProf. Dr. / A. A. Al ManhawyArab Academy for Science and Technology & Maritime Transport-Institute of Productivity and QualityProf. Dr. / H.E.A. IbrahimDepartment of Electrical and Computer Control Eng.,Arab Academy for Science, Technology and Maritime Transport, Cairo, Egypt.E- mail: hibrahim eg@yahoo.comAbstractLean and Six Sigma are recent developments in continuous improvement methodology that have beenpopularized by several high-profile companies. The success and complementary nature of these methodologieshas led to their combination into a single methodology, commonly called Lean Six Sigma or Lean Sigma. Although there is considerable literature available and many consultants involved with Lean Six Sigma, very littlepublished research addresses the practical experiences of companies that have implemented Lean Six Sigma.The research questions for this research are what extent applying the lean six sigma concept in supply chainprocess will improve the physical and information flow of the raw materials and finished goods. And what extent improving of the supply chain process by applying the lean six sigma concept will affect Delivery andspeed, Quality, Flexibility, and Cost.Index Terms—Lean; Six Sigma; Healthcare; Pharmaceutical products1 INTRODUCTIONThis research’s purpose is to assist the supply chainprocess in pharmaceutical industry in the term ofcontinuous improvement program that abates or eliminates the negative effects caused by deploymentbarriers and implementation challenges, and to eliminate the processes waste by using the combinationof lean and six sigma in one methodology ofDMAICSupply Chain is the movement of materials asthey flow from their source to the end customer.Supply Chain includes purchasing, manufacturing,warehousing, transportation, customer service; demand planning, supply planning and Supply ChainmanagementIn this research Lean and Six Sigma (DMAIC Methodology) has been applied to improve the physicaland information flow for both raw materials and finished goods and in what extent implementation ofthis integrated approach will improve the supplychain processes in the terms of Quality, Delivery andspeed, Flexibility, and Cost.1.1 Pharmaceutical Supply ChainThe pharmaceutical supply chain will consist ofone or more of the following nodes: supplier, pharmaceutical manufacturer, distributor, pharmacy, andconsumer or patient [1] A typical structure of thesesupply chain [2] is shown in Figure 1.Figure 1 Supply Chain ProcessIn the past, pharmaceutical industry did not adoptsupply chain management concepts [3]. However,now several factors are pressing each component ofthe pharmaceutical supply chain to change their traditional manners of conduction business [4], [5].According to Healthcare & Life Sciences SupplyChain Report 2010, controlling cost, globalizingsupply chain and improving visibility or tracking arethe biggest supply chain priorities, as well as, visibil-IJSER 2014http://www.ijser.org
International Journal of Scientific & Engineering Research, Volume 5, Issue 8,August-2014ISSN 2229-5518ity or tracking issues are the biggest obstacles to globalizing pharmaceutical supply chain.2. REVIEW OF METHODOLOGY2.1 Lean MethodologyThe companies’ need for constant improvementand evolution leads to the search of managementtools and methods to foster the development of customer service and to reduce the costs for all associated processes. Accepting this perspective of management, where the achievement of excellencethrough continuous improvement of procedures andprocesses and the search for new management concepts are emphasized, led several companies to engage in management strategies where the assumptions of the “lean” philosophy are key.The basic concepts of the Lean philosophy aroseinitially from the 50s in Japanese companies andhave been developing it up to today. These conceptsare centered on just- in-time, where the only goal isthe production of products only at the time they arerequested [6]. The term "lean" is emerging as a newdesignation for production / management “philosophy” that opposes the concept of “mass production”[7].In 1996, they published a second book LeanThinking, and defined Lean thinking as “a way tospecify value, lineup value-creating actions in thebest sequence, conduct those activities without interruption whenever someone requests them, and perform them more and more effectively.In short, lean thinking is lean because it provides away to do more and more with less and less – lesshuman effort, less human equipment, less time, andless space – while coming closer and closer to providing customers with exactly what they want”. Thisbook provides the conceptual framework for categorizing all of the tools and practices of Lean production into five basic areas, the principle of Lean production can be show in Table 1.Although Lean production is focused on effectiveness in the production process, Lean thinking is morefocused on the efficiency in the company as a whole,including nonmanufacturing: administration, andservice [9].5202.2 Six Sigma MethodologySix Sigma is a methodology to reduce the numberof product defects and to reach organizational excellence. It helps the organization to achieve a competitive advantage [10]. This is a structured methodology with systematic statistical-based techniques,which is used to improve the performance ofprocesses / products or quality of a service by reducing process variation [11].Table 1: The Lean Principle [8]PrincipleDescriptionValueDefine value from the standpoint of theCustomerView your product delivery system as acontinuous flow of processes that addvalue to the productThe product should constantly be moving through the value stream toward thecustomer at the rate of demand.Products should be pulled through thevalue stream at the demand of thecustomer rather than being pushed onthe customerThe never-ending pursuit of eliminatingwaste in the system such that productscan flow seamlessly through the valuestream at the rate of demand.The ValueStreamFlowPullPerfectionIn addition to statistical techniques, the methodologyalso incorporates other concepts such as financialanalysis and project planning [12]. To systematizethe application of this methodology in process improvement is often used a formal method calledDMAIC (Define, Measure, Analyze, Improve andControl) [13].This method is a closed loop that allows for the elimination of certain phases of a process (those withno added value to the product or service) and allowsconcentration on new metrics and application of different technologies for continuous improvement. Theuse of DMAIC steps causes the realization of actionsin a sequential and logical way, and in accordancewith the scope of the project [14].Many of the tools and techniques may be applied inmore than one stage of the methodology, since theirpurpose may coincide with the objectives of theIJSER 2014http://www.ijser.org
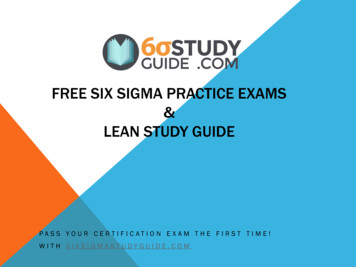
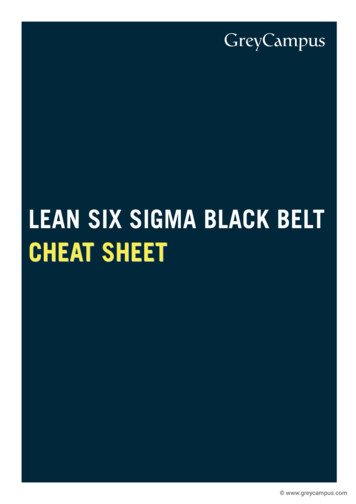
International Journal of Scientific & Engineering Research, Volume 5, Issue 8,August-2014ISSN 2229-5518tasks of each phase [14]. The Six Sigma is a philosophy that has evolved gradually with the results obtained in various organizations (industry and services) [15].One of the main factors when selecting a Six Sigmaproject involving services is positive financial impact and increased customer satisfaction [16].Like any quality improvement methodology, thereare limitations in its implementation. Moreover, theservice sector exhibits an increased difficulty, sincethis sector has highly dynamic processes [10, 17].There are many possibilities of implementing SixSigma projects in the service sector. But it is important to strictly define the characteristic of the processthat will be measured, to ensure that it is critical forcustomer satisfaction and for the level of servicequality.2.3The Integration of Lean and Six SigmaMethodologiesLean and Six Sigma are the two best continuousimprovement methodologies widely used by variousindustries [1]. Lean is used to deliver products andservices better, faster and at a lower cost, meanwhile,Six Sigma is used to achieve stable and predictableprocess results, reducing process variation and defects. Lean is developed within the Toyota Production System in the 1970s based on the teachings ofFord, Japanese experts and others, while Six Sigmaoriginally introduced within the Motorola ResearchCentre in mid-1980s [1], [18].Lean and Six Sigma methodologies are different butcomplementary, both attempt to improve the process:Lean assumes that waste removal will speed up theprocess by which improving business performance,Six Sigma assumes that process variations result inprocess problems and the reducing process variationwill improve business performance [1], [19].521LeanSix ePerfectControlFigure 2: The relationship of Lean and Six Sig maModified Approach for Lean and Six SigmaImplementationIn this section, we combine Lean principles and SixSigma methodologies within a modified approachbased on the main concept of DMAIC structure thatsuccessfully used to improve several processes in theprevious literature.The problem-solving approach for Lean and SixSigma implementation is shown in Figure 3.Define a key problem, or a critical area for improvementUnderstand and document the current process,Identify value and waste of the processChoose the appropriate methods to solve the problem,or improve the processLeanReduce delaysSix SigmaReduce defects, devia-Create the future state and action plansfor implementation of improvementsLSS can be described as a methodology that focuseson the elimination of waste and variation usingDMAIC structure to accomplish customer satisfaction with regards to quality, delivery, and cost. Therelationship between the five Lean principle and SixSigma DMAIC is shown in Figure 2.Develop a quality control planValidate the improved processHand over to the process owner for continuous improvementFigure 3: Modified Approach of Lean and Six Sig maIJSER 2014http://www.ijser.org
International Journal of Scientific & Engineering Research, Volume 5, Issue 8,August-2014ISSN 2229-5518Case StudyResearch ProblemAs a result of monitoring the efficiency workingcircle of supply chain process of the raw materialsand finished goods, there are some of Current problems:1- Raw Materials flow:Stock out of some of raw materials, which affectefficiency of the production plan.Over inventory of other materials, that has the impact on the cash Flow, return rate, inventory risk,and inventory capacity.Data error and duplication, differential between theactual and theoretical stock.Over transportation, over motion, InappropriateProcessing, poor manual recording system.Dissatisfaction of the production peoples due to lowperformance of the Raw materials Store.2- Finished goods flow:Delaying in the implementations of sales orders.over inventory of some products.Shortage in the availability of some other products.Dissatisfaction of the distributors and the salesteams, Data error and duplication, differential between the actual and theoretical stock.Over transportation, over motion.Complexity and Inappropriate Processing in Documentation Cycle, Poor manual recording systemResearch KPI’SRaw Materials flow- Lead Time Variation availability of Raw Materials.- Preparation time of raw material of the sampledproduct Safety stock value.Finished goods flow- Preparation time of sales order.- Safety stock Value.- Working man hours.DefineThe purpose of the first phase of the DMAIC processis to identify and refine a process in order to meet orexceed the customer’s expectations. The Definephase includes developing the team charter as shownin table 2, critical to quality characteristics, problemstatement, communication plan, project scope, andgoal statements.In this stage the following points will be addressed:- Define & Scope Problem.- Determine Project Objectives & Benefits.522- Create Project Charter.- Create Value Stream Mapping.Project CharterTable 2 Project CharterProject Name:of Implementation of Lean six sigma in Supply Chain of the Pharmaceutical IndustryBusiness Case:Opportunity StatementLevelProblem Statement):improve the performanceof the physical and information flow for both rawmaterialandfinishedgoods supplying process,that avoiding shortage andnon-availability of manyitemsReducing preparation lead (cycle)time,Establish Safety Stock calculation,Enhance the monitoring systemBy applying Lean six sigma in thisprocessWhich havesome of expectedbusiness impacts in the terms of:- Delivery and speed, Quality, Cost,Flexibility, Moral.Defect Definition: Time waste andVariationProject Scope:Goal Statement:1- Establish safety stockcalculations in both finished goods and raw materials stores.2-Enhance the documentation system, and improvethe monitoring system ofstock.3- Eliminate the non-Valueadded to improve the cycletime of the preparationtime of production andsales orders.4- eliminate the Non Valueadded in the distributionprocess flowExpected Savings/Benefits:Process Start Point:Begin from receiving the annualsales plan which is translated intoproduction planProcess End Point:The distributors receive the finished goods as the end of salesorders.In Scope: the information andphysical flow of raw materials andfinished goodsOut of Scope:All the production stagesProject Plan:Task PhaseStart DateEnd DateActual EndDefine phaseMeasure phase1-7 nalyze phaseImprove phaseControl phase1-9-20111-10-201123-1- 3-2012IJSER 2014http://www.ijser.org(High
International Journal of Scientific & Engineering Research, Volume 5, Issue 8,August-2014ISSN 2229-5518Defining the Process with SIPOC:It’s important to get a high- level understanding ofthe scope of the process first. A SIPOC Process definition helps the Process Owner and those working onthe process to agree the boundaries of what they willbe working on. It provides a structured way to discuss the process and get consensus on what it involves before rushing off and drawing process maps,as shown in table 3Table 3 SIPOC Di agramProcess: Supply recastPlanProductionplanPlanningTPM asingPlanRawmaterialsProduction rationR.MOrderProductR.MOrderDispensing ction DepartmentsMeasureIn this phase, it will be focused on how to reachthe main (Non-Value Added) How long it takes forany work item to make it through the process frombeginning to end in the Supply Chain process in bothLoops Raw materials and finished goodsIn this stage the following points will be addressed:Measure performance standards.Measure system analysis.Measure process cycle efficiency.Time value analysis.523The Scope of the Project has two Loops as shown infigure 4- List of Hot Spots loop 11- Non accurate Bill of materials; which cause manydefects and data errors in requirements plan, the actual stock often is different from the theoreticalStock.2- Bad Communications between planning and purchasingDepartment about the implementation of purchasingplan; which cause many defect, waiting, shortageand over inventory.3- Non accurate following up the implementation ofpurchasing process of raw materials which causemany shortages and stock out. High Variation of purchasing orders lead time which causes shortages inavailability of raw materials.4- There are three different stores due to bad layout;which cause over motions and waiting through storage process and data errors. No effective codingsystem of the raw materials; which cause many defects.5- Preparing production orders; there are over motions due to many stores, non-effective storage system, there are many shortage in availability of manyraw materials items due to non- available safetystock. There are data errors due to non-effective coding system6- There are data errors due to non-effective codingsystem, and main store have no feedback about thebill of materials of each product.7- There is data duplication in operation orders; dueto Problems in coding system, which causes manydefects, waiting, over process.8- Non effective following up for the implementationof production Plan, which cause, waiting, delay inimplementation of production plan, Missing data,errors, delaying in decision making.9- Not accurate and non-updated stocks; cause manydefects, wrong decisions- List of Hot Spots loop 21- Abbott TPM receives sales orders from AbbottDistribution as daily separated Excel sheet; whichmay cause data duplication.2- Finished goods stores receive sales orders fromAbbott TPM by mobile or telephone; which maycause miscommunications, data errors and duplications.3- Non accurate data due to Manual documentationIJSER 2014http://www.ijser.org
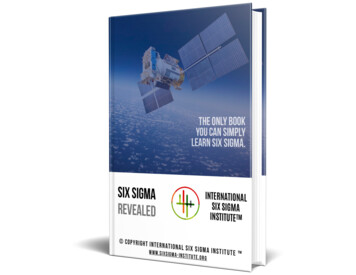
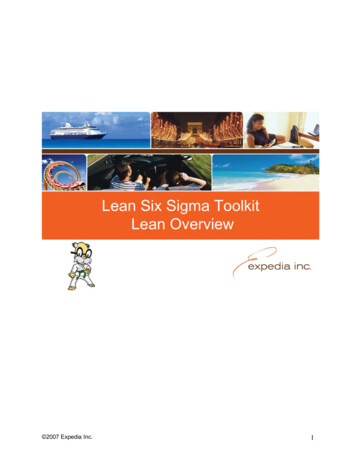
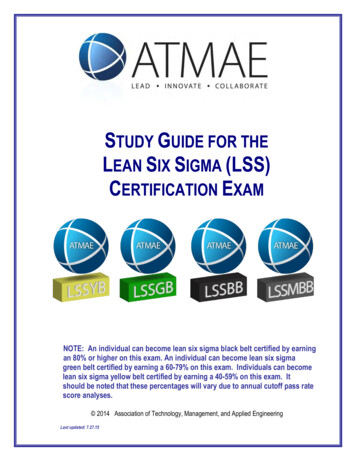
International Journal of Scientific & Engineering Research, Volume 5, Issue 8,August-2014ISSN 2229-5518524Figure 4 Current stream mapssystem.4- There are three Different stores; Many Deferentrecords, over motions.5- Preparation from three different Stores, Many Deferent records, over motions.6- Collects the distribution receipts from three stores;data missing, over motions.7- Limited deliveries times (one deliveries/ day) byTPM vehicles, there are many breakdowns in KahiraTransport vehicles.8- Every week TPM Manager Take Copy of theshipping receipts from the store and record the allsales for all branches of the distributors in first sheet;it take about one day man work from him.Three times in the month TPM Manger collects salesfor every Distributors and making the Second Sheet.9- Then he Collect the total sales for all Distributorsto make the sales wave in the third sheet to send it toAbbott finance team, that is happening tree times inthe monthAnalyzeThe purpose of the Analyze phase is to develop andtest hypotheses about the causes of process defects.Therefore, Hypothesis Testing is a common tool inthis phase. In the Analyze stage, there are three mainPoints:- Estimate Process Capability- Non-Value added Analysis- Process Performance- Identify Variation sourceLoop 1 (Raw materials flow):- Lead Time VariationThere is a high Variation in lead time availability ofthe sampled raw material as shown in figure 5 andthe average lead time is 105 daysFigure 5 Lead Ti me Variati on of raw material- Preparation time of production ordersThe Average time of Preparation production orderis 268 Mins, in addition to high variation as shown infigure 6IJSER 2014http://www.ijser.org
International Journal of Scientific & Engineering Research, Volume 5, Issue 8,August-2014ISSN 2229-5518525- Actual stock of finished productsDays of healthy stock of the sampled product is below the required target as shown in figure 9Figure 6 Preparati on ti me of production orders- Actual Safety stock calculation of sampledraw mate rial:The reorder quantity is 20,000 kg and the orderquantity is 30,000 kg as shown in figure 7Figure 9 Days of healthy stock- Working man hours of TPM manager:The total working man hours for final distributorsinvoice through three waves per month are 39 hours,as shown in figure 10Figure 7 Actual Safety stock calculationsLoop 2 (Finished goods flow):- Preparation time of sales ordersThere is a high variation of preparation sales orders,the average time of sales order is 206 Mins. Asshown in figure 8Figure 10 Working Man Hours- Identify Variation sourceIdentify the potential root causes of the variationsource for poor flow of raw materials and finishedgoods flow as shown in figure 11Figure 8 Preparation time of sales ordersImproveThe Improve phase focuses on formulating andimplementing process improvement ideas. Tools inthis stage include Multiple Regression and Design ofExperiments. In the Improve phase the followingpoints are addressed:- Creating Ideas.- Rating of ideas.- Improvement Recommendation.IJSER 2014http://www.ijser.org
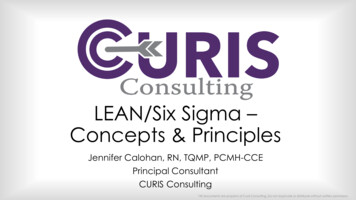
International Journal of Scientific & Engineering Research, Volume 5, Issue 8,August-2014ISSN 2229-5518Table 4 Safety Stock Calcul ati onsOrderNo.Replenishment 03.033.333.003.032.973.006,000Service Level0.111.64Safety StockAverage Rep.1,0763.03Reorder Point19,25620,332Order QuantityAverage RepStdv.Rep.3.030.11Consumption/ton/month6000- Safety Stock Consumption*Stdv.Rep*Service Level- Reorder quantity SafetyStock * Average Rep.- For 95% Service Level ,Z 1.655264- Reorder point based on the lead time.5- Plan small deliveries.6- Payment Terms.- Finished goods Flow1- Establish One Store for Abbott Finished Products.2- Establish new layout for the store, arranging the materials according to:- The more exit.- FIFO; Making three color card; Red card the most priority for exit; (near expired), Yellow Card the 2nd priority,Green Card the 3rd one.3- Supply the store with Fax machine to receive accuratedocumented sales orders.4- Supply the store with computer; convert the manualdocumentation to computerized system.5- Establish computerized system to manage inventoryand distribution system; which manage:- Daily batches movement.- Receipts the distributors.- Making invoices.- Products Store cards.- Campaign invoices.- More than seven kinds of reportsSafety Stock Calculations- (Loop1) Raw mate rials- Safety Stock based on the lead time variation.- Reorder point based on the lead time, as shownin table 4Table 4 Safety Stock Determination (Raw Materia ls)- Plan small deliveries.The order quantity becomes 20,332 kg instead of30,000 kg before improvement as shown in figure 12Table 4 Safety Stock Determination (Raw Materia ls)Figure 11 Identify Potenti al Root Causes- Raw Material Flow1- Establish One Store for Abbott contains:- Specified Abbott raw materials.- Separated Stock from Materials which Abbott andTPM participate in it, these quantity for Abbott onlyand entered the store by Abbott specific code2- Establish new layout for the store, arranging the materials according to:- Product Family.- The more exit.- FIFO; Making three color cards; Red card the mostpriority for exit, Yellow Card the 2nd priority; GreenCard the 3rd one.3- Safety Stock based on the lead time variation.Figure 12 Reorder Point (Loop 1 )IJSER 2014http://www.ijser.org
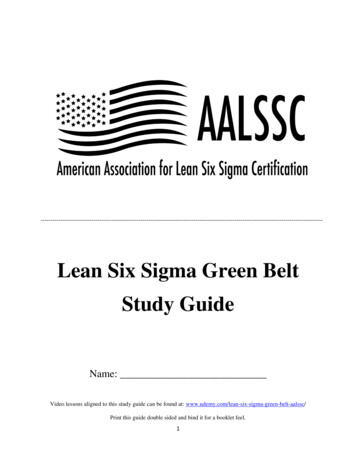
International Journal of Scientific & Engineering Research, Volume 5, Issue 8,August-2014ISSN 2229-5518Safety Stock Calculation- (Loop2) Finished goodsSafety Stock calculations based on the forecast andthe deviation in the last sales, as shown in tables 5,according safety stock rules as shown in table 6Table 5 Safety Stock Determination (FinishedGoods)SalesMonthQuantity Lead time (months):3Oct-10219,344Service 0,554152,850Lead time demand:Standard Deviation:Service factor:Mar-11Apr-11143,042160,325Lead time factor:Safety stock:Ma y-11239,221Reorder Jul-11183,978Order Quantity1,200, 234,882Table 6 Safety Stock RulesBy Lokad.com, Copyright 2007Formul asLead time demand:Standard Deviation:NORMSINVLead time factor:Safety stock:Reorder point:CommentsSumming the forecastsDeviation in the past salesInverse of the normal distributionSquare root of lead-t ime to forecast ratioCo mbin ing factorsLead time demand safety stock- Define reorder quantity for finished goodsThe reorder point is 645,382 units, and the orderquantity is approximately 1,200,000 units as shownin figure 13527Quantity1,200,264645,38290,500Order QuantityReorder Pointsafety StockTimeFigure 13 Reorder Point (Loop 2 )Control:Improvement actions need to be monitored to assess the effectiveness of actions, to maintain benefitsover time and to ensure the stabilization of theprocesses .In order to verify the effectiveness of the improvements, there is a Comparison between the performance of before and after improvement.Results:- Eliminating the variation of lead time of sampledraw materials as illustrated in figure 14- Decrease the cycle time and the variation of preparation time of production orders, and sales orders asshown in figures 15, 16, 17.- Eliminate the over motion for physical flow ofboth raw materials and finished goods- Implement safety stock calculation for the sampledraw material, and finished good.- Eliminate the non-value added processes as shownin figure 19.- Implementing Lean Six Sigma in Supply ChainProcesses, large or small, must be a company-wideinitiative. That we can improve the performance ofsupply chain by reducing the causes of defects andEliminate non value added processes and improvingService and sales causing greater customer satisfaction.IJSER 2014http://www.ijser.org
International Journal of Scientific & Engineering Research, Volume 5, Issue 8,August-2014ISSN 2229-5518528Figure 17 sales order Preparation ti me Loop 2Figure 14 Lead Ti me Variation of Ibuprofen 38(After improvement)(After improvement)Figure 15 Order Preparation ti me (After improvement)Figure 18 Sales orders Lead Ti me Loop 2Figure 16 Order Preparation ti me (After improvement)Figure 19 working man hours Loop 2IJSER 2014http://www.ijser.org
International Journal of Scientific & Engineering Research, Volume 5, Issue 8,August-2014ISSN 2229-5518ConclusionThe research case study is improving the performance of the supply chain processes in the pharmaceutical industry. Through monitoring the performance of the supply chain processes there are manykinds of wastes in; Stock out, over inventory, defects, over transportation, over motion, InappropriateProcessing. The KPI’s are identified to monitor andindicate the performance of the case study. Valueadded results have been achieved after improving thesupply chain processes.References[1] Salah, S., Rahim, A., &Carretero, J. A. (2011). Implementation of Lean Six Sigma (LSS) in supply chain management (SCM): an integrated management philosophy. International Journal of Transitions and Innovation Systems, 1(2),138-162.[2] Zhang, N. S., He, W., & Tan, P. S. (2008). Understandinglocal pharmaceutical supply chain visibility,fro m STR V9 N4 CD Version/STR V9 N4 10 POM.pdf[3] Geimer, H., & To mlinson, G. (2002). The Neglected PharmaceuticalSupplyChain,fro mhttp://www.pharmtech.co m/pharmtech/Analytical/article/detail/57640.[4] Singh, N. (2005). The Pharmaceutical Supply Chain:a Diagnosis of the State-of-the-Art. Master of Engineeringin Logistics, Massachusetts Institute of Technology.[5] Sousa, R. T., Liu, S., Papageorgiou, L. G., & Shah, N.(2011).Global supply chain planning for pharmaceuticals.Chemical Engineering Research and Design, 89(11), 23962409.[6] A. M. Sánchez, and M. P. Pérez, “Lean indicators andmanufacturing strategies,” International Journal of Operations& Production Management, 21, pp. 1433-1451, 2001.[7] S. Taj, “Lean Manufacturing performance in China: Assessment of 65 manufacturing plants,” Journal of manufacturing Technology Management, vol.19, no. 2, pp. 217-234, 2008.[8] Wo mack, J. P., & Jones, D. T. (1996).Lean thinking.Banish waste and create wealth in your Corporation. NewYo rk: Simon and Schuster.[9] Ch iarini, A. (2011). Japanese total quality control, TQM,Deming’s system of profound knowledge, BPR, Lean and SixSig ma Co mparison and discussion. International Journal ofLean Six Sigma, 2(4), 332-355.[10] A. Chakrabarty, and K. C. Tan, “The current state of sixsigma application in services,” Managing Service Quality, vol.17, no. 2, pp. 194-208, 2007.[11] M. Ku mar, A. Jiju, F. J. Antony, and C. N. Madu, “Winning customer loyalty in an automotive co mpany through SixSig ma: a case study,” Quality Reliability Engineering International, vol. 23, no. 7, pp. 849–866, 2006.[12] Y. Kwak, and F. Anbari, “Benefits, obstacles, and futureof six sig ma approach,” Technovation, 26(5-6), pp. 708-715,2006.529[13] S. Reynard, “Motorola celebrates 20 Years of Six Sig ma,”iSixSigma Magazine, pp.20-27, 2007.[14] J. Antony, “Six sig ma for service processes,” BusinessProcess Management Journal, vol. 12, no. 2, pp. 234-248,2006.[15] M . Abdolshah, and R. M. Yusuff, “Fundamental elementsfor the succeful performance of six sigma projects in serviceindustries,” Linköping University Electronic Press, vol. 33, no.23, pp. 1-11, 2008.[16] A. Pandey, “Strategically focused training in Six Sig maway: a case study,” Journal of European Industrial Training,vol. 31, no. 2, pp. 142-62, 2007.[17] J. Antony, M. Kumar, and B. R. Cho, “Six sig ma in service organisations: Benefits, challenges and difficult ies, common myths, emp irical observations and success factors,” International Journal of Quality Reliability Management, vol. 24,no. 3, pp. 294-311, 2007.[18] Koning, H. d., Verver, J. P. S., Heuvel, J. v. d., Bisgaard,S., & Does, R. J. M. M. (2006). Lean Six Sig main Healthcare. Journal for Healthcare Quality, 28(2), 4-11.[19] Nave, D. (2002).Ho w to compare Six Sig ma, Lean and thetheory of constraints.Quality Progress, 35(3), 73-78.IJSER 2014http://www.ijser.org
2.3The Integration of Lean and Six Sigma Methodologies Lean and Six Sigma are the two best continuous improvement methodologies widely used by various industries [1]. Lean is used to deliver products and services better, faster and at a lower cost, meanwhile, Six