Transcription
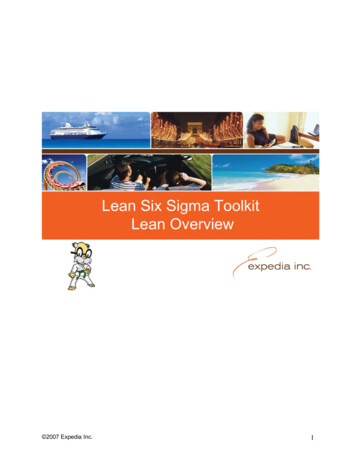
Lean Six Sigma ToolkitLean Overview 2007 Expedia Inc.1
This page left blank 2007 Expedia Inc.2
Purpose & Agenda The purpose of this program is to provide the key concepts and skillsfor understanding some of the basic tools used in evaluating aprocess Our Agenda Overview of the concepts and tools used to create a leanenterprise Objectives and Expectations By the end of this module, participants should understand: What are the elements of a lean enterprise How Lean supports Key Business Objectives Strategy and Tactics of a Lean Transformation Lean Methods and Tools 2007 Expedia Inc.3
This page left blank 2007 Expedia Inc.4
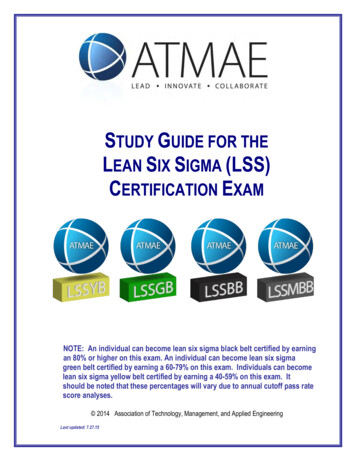
Today we are going to focus on the concepts and tools ofLeanFoundations: The ToyotaProduction SystemToyota1Specify ValueProduction SystemPeopleJidokaPeoplePeople3EstablishFlow5Work gMotionInventoryMoving ls – Value Stream MappingLeanConsumptionPhase II Lean Event - Value Stream Mapping - Current State (GLINK)KAESalesOfficeIFAHead OfficePolicyholderHead icationQuotationRequestDetermineSSCGet Agency #(GLink /Spreadsheet)5 mins2 mins0-7Hrs2HrsGet RequiredDetails0 - 30 mins10 mins0Input DataPrint Quote1-30 mins5 mins-0Man: 1minLean Phase II QuotationsEvent16th November. 2004Cardiff Sales Offiice- Inv Funds- N RD- Commission- W OP- Existing Cont- Authority0Higher Availabilit yEight TypesOf WasteLog QuotePackageSortDistinguish the30 secsnecessaryf romunnecessary1 min - 3theHours1-20 mins5 minsSet InOrderPostA place for1 mineverythingandeverything in itsor Lengthof dayplacerem aining0 minsnon-batch01 minSustainVolume:9 Per Region Per DayTools – 5SHigherQualityPrevent anysetback’s in thefirst 3s’sMakea habitTouch Tim e: 28.5 m insof maintainingCycle Time: Variable (2.5-10.5 Hours)established(W orking to end of day post process)proceduresKeep clean andready to useStandardiseImprovedEnvironmentLower CostsJust-in-Time2Map theValue StreamFive Principlesof LeanShineReliability Origins of Lean Lean has been around a long time: Pioneered by Ford in the early 1900’s (33 hrs from iron ore tofinished Model T, almost zero inventory but also zero flexibility!) Perfected by Toyota post WWII (multiple models/colors/options,rapid setups, Kanban, mistake-proofing, almost zero inventory withmaximum flexibility!) Known by many names: Toyota Production System Just-In-Time Continuous Flow Typically based in manufacturing/production, but also highlyapplicable to transactional projects Outwardly focused on being flexible to meet customer demand,inwardly focused on reducing/eliminating the waste and cost in allprocesses 2007 Expedia Inc.5
Using Lean Tools The goal of “Lean” focused improvement projects is to increase thespeed of a process Controlling and reducing Cycle Time (and cycle time variability),will generate faster feedback cycles on improvement projects increase process velocity and thus cycles of learning In addition, controlling and reducing cycle time (and cycle timevariability) is a key driver to: Facilitating productivity improvements (reduced cost) andcapacity improvements (increased revenue) Remember: reducing cycle time shows us “where the rocksare!” Install workplace organization/visual systems Standardize & mistake-proof operations Redesign operations for steady flow Redesign operations from “push” to “pull” Rapid improvement via “Kaizen events” 2007 Expedia Inc.6
Using Lean ToolsToolActivity Network DiagramAffinity diagramBenchmarkingBrainstormingControl Charts (p, np, c, u, I, MR, Run, x-bar& R)Control y(Quality) Phase(Lean)Applied (DMAIC)Define,Analyze, ImproveDefine, Measure, ImproveDefine,ImproveDefine, Measure,Analyze, ImproveAnalyze,Control Improve, Control Cost of Poor Quality - Concepts of WasteDefine,Measure, Analyze Current State Value Stream MappingMeasure Cycle Time Data AnalysisAnalyzeAnalyze Define, Improve Interrelationship DiagramDefine,Analyze,Improve KaizenImprove ImproveDefine,Analyze,Improve, Control Define, Deploy Poke-Yoke (Mistake Proofing)Control Prioritization MatricesDefine,Analyze,Improve Five "S"Kanban SystemMatrix DiagramNominal Group TechniqueProcess Balancing (TAKT time)Process Efficiency (PCE, PCT)Process MappingAnalyzeContol Analyze,Improve,Control Define, Improve Throughput Yield (First time and rolled)Tree Diagrams Define, Measure Value Added/ Non-Value Added AnalysisAnalyze Value Stream Mapping - Future StateImprove Visual ManagementMeasureControl WIP CapAnalyzeImprove Failure Modes and Effect Analysis (FMEA)Measure, Analyze,Improve Analyze Define, Analyze,Improve, Control HistogramsPareto Charts 2007 Expedia Inc.Expedia Six Sigma TrainingBlack Belt trainingGreen Belt training, Champion training, Kaizen training, SOM-10Green Belt training, Black Belt Training,Champion training, SOM-10Green Belt Training, Kaizen Training, SOM-10Champion trainingGreen Belt Training, Black Belt Training, SOM-12Champion trainingGreen Belt Training, Black Belt Training,Champion trainingGreen Belt Training, Black Belt Training, SOM-5Champion trainingGreen Belt Training, Black Belt Training, SOM-7Champion training, Kaizen trainingGreen Belt Training, Black Belt Training, SOM-11Champion trainingGreen Belt Training, Black Belt Training, SOM-12Champion training, Kaizen trainingBlack Belt trainingGreen Belt Training, Black Belt Training, SOM-12Champion trainingBlack Belt TrainingGreen Belt Training, Black Belt Training,Champion trainingGreen Belt Training, Black Belt Training, SOM-10Champion trainingGreen Belt Training, Black Belt TrainingChampion trainingGreen Belt Training, Black Belt Training,Champion trainingGreen Belt Training, Black Belt Training, SOM-11Champion trainingGreen Belt Training, Black Belt Training, SOM-11Champion trainingGreen Belt Training, Black Belt Training, SOM-2Champion trainingGreen Belt Training, Black Belt Training, Kaizen Training,Champion trainingGreen Belt Training, Black Belt Training, SOM-8Champion trainingGreen Belt Training, Black Belt Training, SOM-7Champion trainingGreen Belt Training, Black Belt Training, SOM-7Champion trainingGreen Belt Training, Black Belt Training, SOM-12Champion trainingGreen Belt Training, Black Belt Training, SOM-11Champion trainingGreen Belt Training, Black Belt Training, SOM-9Champion trainingGreen Belt Training, Black Belt Training, SOM-6Champion trainingGreen Belt Training, Black Belt Training, SOM-6Champion training7
Key Lean Definitions The following definitions are used throughout Lean Six Sigmadiscussions to describe the speed, efficiency, throughput, and capacityof a process:Work-In-ProcessProcessExit RateProcess Cycle Time Process Cycle Time (PCT): The time from release of a product into aprocess until its completion Example: The elapsed time from when a customer calls, to whenthe ticket is issued averages 3 days Work-In-Process (WIP): Product that is within the boundaries of theprocess Example: There were 3300 reservation applications in process atthe end of the month Exit Rate (Throughput): The output of a process over a defined periodof time Example: Our process closed 500 reservation applications per daylast month Capacity: The maximum amount of service a process can deliver overa continuous period of time Example: The capacity of our process is 120 reservations perhour Time Trap: Any process step that inserts delay time into a process We are concerned with the time trap that injects the MOST delay Example: our quality team evaluate 120 transactions per day, allother process steps can process 145 transactions per day Constraint: A time trap that is unable to produce at the exit raterequired to meet customer demand (internal or external) Example: our agents can only complete 120 reservations per day,but customer demand is currently 130 reservations per day! 2007 Expedia Inc.8
The Basics of Lean1. Determine the Voice of the Customer (VOC)2. Identify the Process Value Stream3. Implement Pull Systems4. Improve Process Flow5. Achieve Lean Perfection – Continuous ImprovementLean GoalsHighest Quality, Lowest Cost, Shortest Time, Maximum Flexibility 1. Determine the Voice of the Customer The challenge is to understand how your customers define andprioritize the various needs and expectations they have of yourproducts and servicesQualityProduct or Service Features, Attributes, Dimensions, CharacteristicsRelating to the Function of the Product or Service, Reliability, Availability,Taste, Effectiveness - Also Freedom from Defects, Rework or ScrapCostPrices to Consumer (Initial Plus Life Cycle), Repair Costs, PurchasePrice, Financing Terms, Depreciation, Residual ValueDeliveryLead Times, Delivery Times, Turnaround Times, Setup Times, CycleTimes, DelaysService& SafetyService Requirements, After-Purchase Reliability, Parts Availability,Service, Warranties, Maintainability, Customer-Required Maintenance,Product Liability, Product/Service SafetyCorporateResponsibilityEthical Business Conduct, Environmental Impact, Business RiskManagement, Regulatory and Legal Compliance 2007 Expedia Inc.9
1. Determine the Voice of the CustomerTypes of Voices Complaints Compliments Product returns Product/service sales preferences Contract cancellations Market share changes Customer defections/acquisitions Customer referrals Closure rates of sales calls What other customer voices could you or do you use in your businessHow do our customerscommunicate to InboundCommunicationsCasualContact 2007 Expedia Inc.10
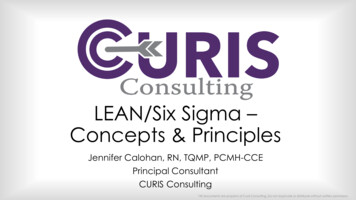
2. Identify the Value Stream Process mapping is a lean technique first used by ToyotaTaichi Ohno’s problemThe solution A standard method for flow mappingManaged a machine shopHad a large area of responsibilityHad an unsatisfied customerCould not see non-value add or flowat a glance4 x WkBuildSchedules(Mon1xWeek)Goods InGoods InWeld (Day Shift 430 Mins)50Weld BenchCT1111107C/O 50 Mins(Col 0 Mins)DistributionOrders(Thurs/ 1xWk)MRPMon/Tues/Wed/ThursPartSide LSide RBraceHook28 DayForecastsLoftycranesOrders(Tues/1xWk)ABC Pressings4 x DayShippingList Copy(Fri1xWeek)Chassis (Day Shift 430 Mins)Final Assy (Day Shift 430 Mins)Assy 1Assy 2Assy 3Assy 4Assy 538CT 191 OpCT 211 OpCT 161 OpCT 331 OpCT 271 Op20Brace041036Green9Black550 Units/Wk08:00, 09:00,10:00, 12:00.Side LSide RYellow108Side LBrace363Dispatch Dept20 Dispatch2Side R HookHook Purpose of Process Mapping Identify problems and opportunities in the current process Develop and communicate what the target end state should look likeand how to get there? 2007 Expedia Inc.11
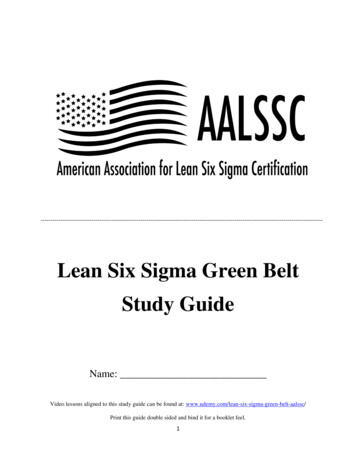
Value Stream Mapping The value stream is all of the operations/activities that are necessaryto bring a specific product through critical business tasks: Problem solvingValue Add Analysis - CurrentTakt Tim e 55 secTask Time (seconds) Information management Physical transformation Delivery to customer807060504030201001234CVA Time56Task #7BVA Time8910NVA Time Define Value Add along the Value Stream What adds value to product (function, form, or feature) What destroys value for the business (8 types of waste)Order Mgmt SupervisorService lead time 384 minWeekly UpdateCUSTOMERPhone CallCustomer call time 24 minPhone CallOrder MgmtScreen for Acct MgrManual UpdateP/T 3 minLost calls 10%Volume 12002-5SUPPLIERSdaysLargeBusiness6 CustomersSmallBusinessOrder MgmtOrder MgmtCustomerInfoProductNeed44Order MgmtOrder MgmtPricingShippingInfo445 CustomersP/T 2 minP/T 6 MinP/T 6 MinP/T 2 MinHomeError Rate 2%Volume 800Error Rate 0%Volume 800Error Rate 2%Volume 800Error Rate 1%Volume 8002 min6 min6 min2 minDIST1020OrdersPickPack & ShipP/T 120 MinError Rate 1%Volume 12003 Customers5 min3 min 2007 Expedia Inc.240 min120 min121
Two Stages of Value Stream MappingCurrent Current State Rigorous, fact based analysis Purpose Detailed visual description of the current value stream Objectives Show a holistic view of the entire current system Visualize material and information interactions Highlight non-value add and its sources throughout the system Identify problems and improvement ideas Provide common framework for discussionFuture Future State Creative design synthesis Purpose Detailed visual description of a redesigned best practice valuestream Objectives Force best practice in creating a vision of the ideal lean valuestream Set baseline for tactical implementation planning by identifyingvalue stream loops Prioritize improvement efforts/actions Assist in quantifying improvement potential Allow target setting (short-mid-long term) 2007 Expedia Inc.13
Example of Key Process DataMeasurementDescriptionProduct variationsNumber of distinct types of loans or applications ineach process stepCycle time* (C/T)Time elapsing between 1 completed loan and thenext completed loan (includes wait time)Wait time* (Wait)Time spent by the loan in a queueTouch time* (T/T)Time spent actually processing the loan (i.e., the timean operator actually touches the loan or file)Setup time* (S/T)Time spent prior to beginning process per FTE pershift (e.g., login time)Working time (W/T) Maximum theoretical time per FTE per shift availablefor each step (minus break, meeting, and clean up) inhoursActual amount of time available to process loans perUptimeFTE per shift (hours)Number of FTEsPeople available to fully operate a process step pershiftNumber of shiftsNumber of shifts per dayError ratePercent of applications or loan packages subject torework as a result of the selected areaInventory/QueuesizeDistance traveled*(D/T)Capacity 2007 Expedia Inc.Number of applications or loan packages waiting fornext process stepDistance for manual transfer of paperworkMaximum number of loans processed per hour perperson/machin
The following definitions are used throughout Lean Six Sigma discussions to describe the speed, efficiency, throughput, and capacity of a process: Process Cycle Time (PCT): The time from release of a product into a process until its completion Example: The