Transcription
African Journal of Hospitality, Tourism and Leisure, Volume 8 (2) - (2019) ISSN: 2223-814XCopyright: 2019 AJHTL /Author/s- Open Access- Online @ http//: www.ajhtl.comRepurchase intention and word of mouth factors in themillennial generation against various brands of Bobadrinks during the Covid 19 pandemicNonot Yuliantoro,* Vasco Goeltom, Juliana, Innocentius Bernarto,Rudy Pramono, Agus PurwantoPelita Harapan University, MH Thamrin Boulevard 1100Tangerang, Banten 15811, IndonesiaE-mail: agozpor@gmail comAbstractThe purpose of this research was to find out whether 1) Price promotion, 2) Brand image, 3) Foodquality and 4) Perceived value of several Taiwanese boba beverage brands in Jakarta affect thesatisfaction of millennial generation customers. 5) Does Customer Satisfaction affect the RepurchaseIntention of Taiwan boba drinks and 6) Does Customer Satisfaction affect the Word of Mouth in variousTaiwan boba beverage brands. A Survey method was used in this research. Data was collected usingonline instrumentation with a millennial generation target population between the ages of 18 to 38 yearsin Jakarta and surrounding areas. Data collection was carried out, when the world first faced the COVID19 pandemic. The sample used in this study amounted to 285 respondents, and the data collectiontechniques used convenience sampling. Partial Least Square-Structural Equation Modelling with PLSplus 3.0 program was used as an approach in testing the data collected. The findings of the study statedthat price promotion on several brands of boba drinks did not affect the satisfaction of millennials inconsuming them, while brand image, food quality, perceived value all affected the satisfaction ofmillennials in consuming various brands of boba drinks. Millennial generation satisfaction was found toinfluences repurchase intention and word of mouth.Keywords: Price, promotion, brand image, food quality, perceived value, customer satisfaction,repurchase intention, word of mouth.IntroductionThe growth rate of the food and beverage business globally is inseparable with the emergenceof a variety of food and beverage brands from certain countries and it has become a culinarytrend in many countries. Consumption patterns that are influenced by human lifestyles andtechnological advances are factors that influence the emergence of food or beverage trendsin society (Amato et al., 2017). Millennials is a term created by Howe and Strauss (2000) andrefers a group of consumers including Baby Boomers and Generation X. Millennials are partof a society that has a lifestyle that is in accordance with current conditions, and this generationwas born between 1982 - 2002 (Elam, Stratton & Gibson, 2007) and have a tendency tocoexist with information technology so that it will be easy to access and obtain informationincluding the latest concerning the F&B industry. Customer satisfaction delivers a leadingindicator of consumer purchase intentions and loyalty towards a product or service.The object of this research was the variety of brands of boba drinks in Jakarta that are muchin demand by the public, especially the millennial generation consumer. The variety of bobabeverage brands that dominate the market include Sugar Tiger, Xing Fu Tang, Quickly,Kokumi, KOI, Xiboba, Chatime and several other brands. When the online media Detik Foodreviewed the holding of the 2019 boba festival in Jakarta this got enthusiastic support from thepeople of Jakarta. However, the occurrence of the COVID 19 pandemic with the socialdistancing policy tended to break the chain of distribution of COVID 19 (Allcott et al., 2020)and it affected the purchase pattern of boba drinks. This was then limited by ordering throughonline applications because the outlets did not serve direct purchases to customers becausethe malls were not open to the public as long as the PSBB regulations are enacted and theconditions affected the sale of Taiwan's boba drinks in Jakarta.1
African Journal of Hospitality, Tourism and Leisure, Volume 8 (2) - (2019) ISSN: 2223-814XCopyright: 2019 AJHTL /Author/s- Open Access- Online @ http//: www.ajhtl.comThis research was carried out based on a perceived research gap from a previous researchon the development of promotion variables to be tested for their effect on customer decisionbehavior (Banerjee & Singhania, 2018), by developing variable price promotion and brandimage, food quality and perceived value as factors influencing repurchase intentions and wordof mouth with customer satisfaction in various brands of boba drinks in Jakarta.Literature Review and HypothesisA. Price Promotion Relationship with Customer SatisfactionThe purpose of price promotion is to increase sales, build good relationships with customers,and to be ready to compete with competitors, bring in new customers, and maintainingcustomer loyalty (Bogomolova 2017). Factors that influence customer satisfaction inrestaurants are service quality, food and beverage quality, friendly prices (Andaleeb &Conway, 2006; Nguyen et al., 2018) obtained in accordance with customer expectations. Pricepromotion significantly influences customer satisfaction (Huang et al., 2014; Hanaysha, 2017;Moslehi & Haeri, 2016; Nicolaides, 2008). Promotions that are directly related to the sellingprice become an attraction for customers to buy the product being sold. Service experiencesand promotions in due course serve as a way for customers to appraise the quality of aproduct or service offering, and they form their overall quality perceptions of theproduct or service. Based on previous research, the following hypothesis is determined:H1 Price promotion has a significant effect on satisfactionB. Relationship of Brand Image with Customer SatisfactionBrand Image is an important aspect of marketing that is subjective because it is a perceptionthat is formed through consumer interpretation (Mete & Davies, 2017; Nicolaides, 2008a).Overall brand image affects the satisfaction of casual dining restaurants (Espinosa et al.,2018). The corporate brand image of Starbuck coffee influences customer satisfaction inTaiwan (Tu & Chang, 2012). Brand image is the originator that helps achieve customersatisfaction (Song, Wang & Han, 2019). Based on previous research, the following hypothesisis determined:H2 Brand Image provides a significant influence on customer satisfactionC. Relationship between Food Quality and Customer SatisfactionFood quality can be defined as suitability to be used as food ingredients for consumption andleads to customer satisfaction. Thus, quality can be described as a requirement needed tomeet the needs and expectations of consumers and to exceed them (Nicolaides, 2012; Peri,2006). The characteristics of a product have significance in determining the level of productacceptance for users (Cardello, 1995). Food quality in the coffee chain affects customersatisfaction as ascertained by Huang et al., (2014). Food quality affects satisfaction at therestaurant outlet of a luxury hotel (Han & Hyun, 2017). Food quality has a significant effect onrestaurant customer satisfaction (Nicolaides, 2012; Abdullah et al., 2018; Banerjee &Singhania, 2018). Delightful eating experiences provide a fond memory, one of which isinfluenced by the quality of food that causes consumers to be satisfied, believe in and providepositive word of mouth on a product served to them (Jalilvand et al., 2017). Based onreferences from previous studies, the following hypotheses are established:H3 Food quality has a significant influence on customer satisfactionD. Relationship between Perceived Value and Customer SatisfactionPerceived value can be interpreted as a customer's view of a value that they get after buying(Zeithaml, 1988). The perceived value of the customer is a significant determinant of customersatisfaction (Ryu, Lee & Kim, 2012; Nicolaides 2016). Perceived value significantly influencesorganic restaurant customer satisfaction (Konuk, 2019). Restaurant quality encourages2
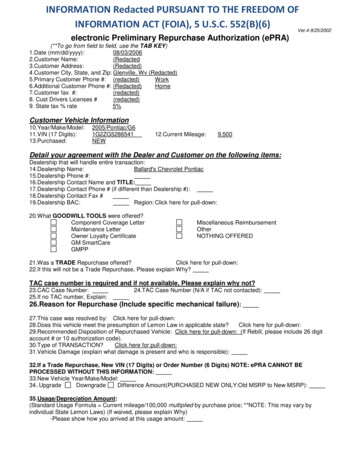
African Journal of Hospitality, Tourism and Leisure, Volume 8 (2) - (2019) ISSN: 2223-814XCopyright: 2019 AJHTL /Author/s- Open Access- Online @ http//: www.ajhtl.comperceive value perceived by customers in consuming healthy foods (Jin et al., 2018).Customers assume that perceived value is influenced by the overall picture of fast foodrestaurants (Ryu, Han & Kim, 2008). Based on references from previous studies, the followinghypotheses are established:H4 Perceived value provides a significant effect on satisfactionE. Relationship between Customer Satisfaction and Repurchase IntentionThe desire to repurchase a food or beverage product is a form of response from the customerof the experience of enjoying the product. Customer satisfaction affects repurchase intentionin the coffee chain (Huang et al., 2014). Customer satisfaction has a positive influence onrepurchase intention in restaurants and cafes (Nicolaides, 2016; 2012, 2008;Berliansyah &Suroso, 2018). Customer satisfaction influences customer repurchase intention in the fastfood industry (Anwar & Gulzar, 2011; Nicolaides, 2008). Satisfaction has a significant influenceon repurchase intention in coffee shops (Moslehi & Haeri, 2016). Customer satisfaction has apositive influence on Starbucks coffee repurchase intentions (Quintao & Prasonnguskarn,2017). Based on references from previous studies, the following hypotheses were determined:H5 Customer Satisfaction has a significant influence on repurchase intentionF. Relationship of Customer Satisfaction with Word of mouthWOM is one of the most important channels of information dissemination between individuals(Ismagilova et al., 2017). Quality and service environment affect the value of customer servicereceived from a service experience and will result in satisfaction that affects word of mouth(Laroche et al., 2005; Ramphal & Nicolaides, 2014). Satisfaction affects word of mouth in thefast food industry (Anwar and Gulzar, 2011). Customer Satisfaction has a positive effect onword of mouth in food and drink services at universities (Kim, Ng & Kim, 2009; Jalilvand et al.,2017). Given that customers have different values and assess services differently, it ishighly probable that the same service or product will be perceived differently, thus wordof mouth is a great help when coming from ones friends and family.Based on references from previous studies, the following hypotheses are determined:H6 Customer Satisfaction has a significant effect on word of mouthBased on the description of developing hypotheses, the research model is as follows:Figure 1. Empirical research model to be tested3
African Journal of Hospitality, Tourism and Leisure, Volume 8 (2) - (2019) ISSN: 2223-814XCopyright: 2019 AJHTL /Author/s- Open Access- Online @ http//: www.ajhtl.comResearch methodsIn this study a survey method was used. Data collection was carried out using a conveniencesampling technique and an online questionnaire instrument for millennials between the agesof 18 and 38 years who live in the Greater Jakarta area. According to Hair, Black, Babin andAnderson (2014) general rules for the number of samples needed in quantitative research areat least five times the number of indicators and it would be better if you have a 10: 1 ratiobetween the sample and the number of indicators to be analyzed. This study uses 21indicators of the seven constructs to be tested, in distributing online questionnaires a dnreceived 285 responses so that they meet the requirements.The first part of the questionnaire is the respondent profile and the second part containsindicators relating to the variables to be tested namely: Price Promotion, Brand Image, FoodQuality, Perceived Value, Customer Satisfaction, Repurchase Intention and Word of Mouth.Indicators of Price Promotion are adapted from research (Huang et al., 2014), indicators fromBrand Image are adapted from research (Jin, Lee and Huffman, 2012), indicators from FoodQuality are adapted from research by Jalilvand et al., (2017) and also Huang et al., (2014).Indicators of perceived value are adapted from research by Itani, Kassar and Loureiro, (2019)and also Konuk, (2019). Indicators of Customer Satisfaction were adapted from various otherresearchers (Itani, Kassar & Loureiro, 2019; Hanaysha, 2016; Konuk, 2019). Indicators ofRepurchase Intention were adapted from research (Huang et al., 2014) and Word of MouthIndicators were adapted from research (Konuk, 2019). This study used a point Likert scalewith 1 Strongly Disagree, 2 Disagree, 3 Neutral, 4 Agree, and 5 Strongly Agree.Statistical analysis using the Partial Least Square Model (PLS-SEM) with Smart PLS 3.0software.Table 1. Profile of RespondentsAspectGenderMenWomanAge18-24 years old25-31 yearsold32-38 years oldStatusCollege studentPrivateEntrepreneurthe otherFrequency1-2 times3-4 times 4 timesSpending 50,000Rp.50,000-Rp100,000 Rp Source : 2020 processed dataFrequency8020525520Percentage28 . 171.989. 5710206508211526469198741391741412403. 572 . 317. 52. 87. 453 . 322 . 524 . 269. 5264. 531 . 92.51.449.50.714The total number of samples in this study was 285, an explanation of the profile of respondentswas as follows: 71.9% were female respondents and 28.1% were men. Respondents aged18-24 years comprised 89.5%, aged 25-31 years 7% and aged 32-38 years 3.5%. Judgingfrom the status of work, students were 72.3%, working in the private sector were 17.5%,4
African Journal of Hospitality, Tourism and Leisure, Volume 8 (2) - (2019) ISSN: 2223-814XCopyright: 2019 AJHTL /Author/s- Open Access- Online @ http//: www.ajhtl.comentrepreneur accounted for 2.8% and others 7.4%. Frequency of buying boba drinks withinthree months during the COVID pandemic 19: 1-2 times 53.3%, as many as 3-4 times 22.5%and more than 4 times as much as 24.2%, the amount of money spent personally to buy bobadrinks under Rp. 50,000 as much as 69.5%, Rp 50,000 - 100,000 as much as 26% and aboveRp 100,000 as much as 4.5%. regions buy boba drinks in Jakarta 31.9% Bogor, 2.5% Depok1.4% Tangerang, 49.5% Bekasi 0.7%. Other regions 14%.Measurement ModelsWe started by measuring the validity and reliability of all constructs and indicators by findingthe Average Variance Extracted (AVE) and outer loading values. The basis of the decisionused for the Average Variance Extracted (AVE) value and outer loading or factor loading valuewas a minimum of 0.5 and 0.7 (Hair et al., 2014). The next step in the validity test was to countdiscriminatory analysis with reference to the Fornell-Lacker criteria which states that theaverage (AVE) square value of each variable is greater than the correlation value betweenconstructs in the model.Table 2 shows that that instrument measurements are valid, AVE values range from 0.577 to0.961. while the indicator values of all constructs tested have a loading factor or outer loadingvalue ranging from 0.623 to 0.961. According to Hair et al (2014) the value of outer loadingbetween 0.4 to 0.7 can be maintained if it is able to make the AVE value increase. Accordingto Ghozali and Latan (2015), in reliability testing a composite reliability value must be sought,in this study CR values ranged from 0.801 to 0.971 which means it has exceeded the minimumvalue requirement of 0.7 (Hair et al., 2014)Table 2. Evaluation of Measurement ModelsConstructs and ItemsOuterLoadingBrand Image / BI (AVE 0.630, CR 0, 836)BI.1 I am very familiar brand of beverage boba which I bought0, 789BI.2 The boba brand that I bought is of good quality0, 851BI.3 Brand boba that I bought had the impression that fashionable and trendy.0, 737Customer Satisfaction / S (AVE 0.828, CR 0, 935)C S . 1 I like this boba drink0, 881C S . 2 This boba drink meets my expectations0, 925C S . 3 I am satisfied to buy this boba drink0, 923Food Quality / FQ (AVE 0.577, CR 0, 801)FQ.1 The taste of the drink is delicious and refreshing0, 879FQ.2 The quality of this boba is consistent0, 755FQ.3 Boba drinks are a choice of flavors0 , 623Perceived Value / PV (AVE 0, 716, CR 0, 883)PV.1 drink boba is according to the money that is paid0, 845PV.2 I get experience with drinking both of this boba0, 876PV.3 I will continue to buy this boba drink even though the price is a bit expensive0, 816Price Promotion / PP (AVE 0.717, CR 0, 883)PP.1 Get cash back when purchasing boba drinks0, 872PP.2 price promo at the end of the week0, 868PP.3 Buy one get one free0, 798Repurchase Intention (AVE 0,919, CR 0, 971)RI.1 I intend to buy this boba again0, 956RI.2 I most likely bought this boba drink again0, 961RI.3 I am willing to buy this boba drink again0 , 956Word of Mouth (AVE 0.848, CR 0, 943)WoM.1 I say something positive about this boba drink to others0, 899WoM.2 I recommend this boba drink to others0, 933WoM.3 I would say to friends and relatives to choose boba this .0, 930Note: AVE Average Variance Extracted ; CR Composite Reliability * significant (two-tailed test, ρ 0.05)Source: Processed Data Results (2020)5
African Journal of Hospitality, Tourism and Leisure, Volume 8 (2) - (2019) ISSN: 2223-814XCopyright: 2019 AJHTL /Author/s- Open Access- Online @ http//: www.ajhtl.comTable 3 demonstrates that the discriminant validity test was done to comply the root valueAVE is greater than the value of the correlation between variables.Table 3. Franer - Larcker 660.199.9580.6950.921Source: Processed Data Results (2020)Structural ModelStructural models are stages for calculating R², collinearity test and hypothesis testing. Thehigher the value of R², the better the prediction of exogenous constructs on endogenousconstructs. Table 4 describes that the Word of Mouth construct has an R² of 0.383 or 38.3%so that it can be said that the Word of Mouth construct is explained by the Customersatisfaction construct of 38.3% and the remaining 61.7% is explained by other constructs thatare not explained in this study. The construct of Customer satisfaction has an R² value of0.591 or 59.1% which means that the Customer Satisfaction construct is explained by theconstruct of Price Promotion, Brand Image, Food Quality and Perceived Value of theremaining 59.1% by 40.9% explained by other constructs that are not explained in this study.Finally, the Repurchase Intention construct with R² of 0.613 or 6.13%, means the CustomerSatisfaction construct explains the Repurchase Intention construct of 61.3% and the remaining38.7% is explained by other constructs not examined.Table 4. Evaluation of R2VariableWoMCSRIR²0, 3830, 5910, 613Source: Processed Data Results (2020 )The collinearity test aimed to find out whether the research model has a collinearitytendency. The basis for decision making for the limit value of collinearity, if VIF 5 meansthere were no symptoms of collinearity. If VIF is more than 5.0, then there is a tendencyof collinearity (Hair et al., 2014) Table 5 shows that the VIF value in the construct modelhas a value below 5.0, so it can be concluded that there is no collinearity in the modeltested.Table 5. Evaluation of CollinearityAs a predictor of CSConstructVIFBI1, 790FQ1, 926PV1, 672PP1, 132As a predictor of PIConstructVIFCS1, 00As a predictor of WoMConstructVIFCS1, 00Source: Processed Data Results (2020)The test done of hypotheses was to determine their influence between the constructs sothat decisions are taken and is supported or not supported. Hypothesis testing by taking intoaccount the t table limit is 1.65 ( level of significance 5%). The hypothesis of this study is6
African Journal of Hospitality, Tourism and Leisure, Volume 8 (2) - (2019) ISSN: 2223-814XCopyright: 2019 AJHTL /Author/s- Open Access- Online @ http//: www.ajhtl.comthat the hypothesisis not directed ( in directional hypothesis ). Therefore, hypothesis testingwas done with a two- tailed test . If the value of t counts more than 1. 65, it can be concludedthat the hypothesis is supported. Table 6 shows that the H1 Price Promotion effect has avalue of t count 0916 1.65 then H1 is not supported while the H2, H3, H4, H5 and H6 havea value of t count 1.65 and then the five hypotheses are supported this research .Table 6. Hypothesis Test ResultsHypothesisPath coefficientDecision-0, 040Tcount it0, 916H1: Price Promotion effect on Customer SatisfactionH2: Brand Image effect on Customer SatisfactionH3: Food Quality impact on Customer SatisfactionH4 : Perceived Value effect on Customer SatisfactionH5. CustomerSatisfaction effect on RepurchaseIntentionH6 Customer Satisfaction effect on Word of Mouth0, 2560, 2220, 4340, 7834, 3332, 6126, 63015 058supportedsupportedsupportedsupported0, 61910, 215supportednot supportedSource: Processed Data Results (2020 ).DiscussionThe results of the first hypothesis testing or H1, Price Promotion affects Customer Satisfactionis not supported. This is not in line with previous studies (Huang et al., 2014; Hanaysha, 2017;and Moslehi & Haeri, 2016). However, holders of boba beverage brands in Jakarta Indonesiasuch as Tiger Sugar, Xing Fu Tang, ONEZO, Quickly, Chatime and others should remainconsistent in packaging their promotional programs that intersect with promotional prices tocreate an atmosphere of competitive competition and gain new customers given the foodindustry and the very generic drinks.The results of the second hypothesis testing or H2, Brand Image affects Customer Satisfactionis supported. Boba customers are very concerned about the brand of the boba drink they buyconsidering each brand has a product superiority as a strength and competes with otherbrands. This makes the customer feel satisfied. This is in line with research conducted by AlHaddad, (2019), Jin, Lee and Huffman, (2012), and Song, Wang and Han, (2019). Customersassume that the brand is identical with a satisfying quality.The third hypothesis testing result or H3, Food Quality affects Customer Satisfaction issupported. The quality of boba beverage products from various brands sold in Jakarta havegood quality and can be accepted by the public, especially the millennial generation. This isin accordance with research that food quality plays an important role in a person's eatingexperience (Namkung & Jang, 2007). By providing quality food this will greatly affect customersatisfaction (Ha & Jang, 2010). Food Quality affects Customer Satisfaction in a restaurant (Jin,Lee & Huffman, 2012; Nicolaides, 2012). Although the quality of boba drinks is able to satisfycustomers, boba beverage brand holders should always maintain the quality of food byimplementing maximum QC and innovating it according to customer needs.The results of testing the fourth hypothesis or H4, Perceived Value affects CustomerSatisfaction is supported. The value given by the boba beverage brand holder in Jakarta isable to convince customers that the boba drink that is in line with expectations. This is in linewith research by Iglesias and Guillén, (2004). The importance of a Perceived Value is in theeyes of the customer as a reference in making choices in buying boba drinks. The highperceived value will make customers feel satisfied and loyal (Kuo et al., 2011).The results of the fifth hypothesis testing, or H5, Customer Satisfaction affecting RepurchaseIntention are supported. An experience of drinking boba drinks offered by the holders of bobabeverage brands does not only stop at the point of satisfaction but is able to arouse theintention of customers to re-purchase the boba drinks. This is in agreement with previous7
African Journal of Hospitality, Tourism and Leisure, Volume 8 (2) - (2019) ISSN: 2223-814XCopyright: 2019 AJHTL /Author/s- Open Access- Online @ http//: www.ajhtl.comresearch (Wang & Chang, 2016; Che, Lee and Mu, 2018), the desire to make a repurchase isa reflection of customer behaviour that expectations are met.The results of the sixth hypothesis testing or H6, Customer Satisfaction affects Word of Mouthis supported. The experience of consuming certain brands of boba drinks that meet customerexpectations will stimulate customers to give positive testimonials about the drinkingexperience they had. This is in line with previous research (Mensah & Dei Mensah, 2018;Kwun, Ellyn & Choi, 2013; Lai, 2020) because positive word of mouth will be very effective inobtaining new customers.ConclusionsCustomers tend to evaluate future purchase intentions based on the value gainedfrom preceding experiences and the relationship benefits. In addition, quality and customersatisfaction have long been understood to play a decisive role for business achievement andendurance in today's competitive marketplace. Customer retention has an important roleto play and if one is to meet customers' demands and expectations for the purpose ofcompeting in the market it is crucial to keep quality high. Based on the results of thehypotheses testing, it can be concluded that Price Promotion does not affect CustomerSatisfaction, Brand image influences Customer Satisfaction, Food Quality affects CustomerSatisfaction, Perceived Value affects Customer Satisfaction, Customer Satisfaction affectsRepurchase Intention and Customer Satisfaction affects Word of Mouth. Given these aspects,companies should trail customer's expectations, the perceived performance of boba drinksand customer satisfaction, and companies should also monitor’s their competitor’sperformance in the marketplace so as to improve their offerings,Word of mouth (WOM) advertisements play a key role in sustainable business and it helps.consumers become acquainted to new products and services on offer, as well as the qualityof services available. Repurchase intention then is critical as it refers to the consumerspropensity to buy products or services from the same business in the future. The limitations inthis study are the number of respondents 285, the majority of whom are students and not yetearning so that it will influence the opinions given. Suggestions for further research are tofocus more on respondents who have earned income and increase the number of respondentsand develop existing research models by testing the effect of the construct Price on theRepurchase Intention construct and one could examine the effect of the Perceived Valueconstruct on the Word of Mouth construct in the food and beverage industry. It is alsorecommended that future research can be based an increased sample so as to obtain moreaccurate results. Also along with service quality and satisfaction, future research shouldintegrate other factors and dimensions that can significantly forecast the consumersbehaviour, such as value, loyalty, and reasons for purchasing.ReferencesAbdullah, D. et al. (2018). Food quality, service quality, price fairness and restaurant repatronage intention: the mediating role of customer satisfaction, International Journal ofAcademic Research in Business and Social Sciences, 8(17), 211–226.Al-Haddad, A. (2019). ‘Social Identification, Brand Image and Customer Satisfaction asDeterminants of Brand Love’, in Creative Business and Social Innovations for a SustainableFuture. Springer, 255–262.Allcott, H. et al. (2020). ‘Polarization and Public Health: Partisan Differences in SocialDistancing during COVID-19’, Available at SSRN 3570274.Amato, G. et al. (2017). ‘Social media image recognition for food trend analysis’, inProceedings of the 40th international ACM SIGIR conference on research and development8
African Journal of Hospitality, Tourism and Leisure, Volume 8 (2) - (2019) ISSN: 2223-814XCopyright: 2019 AJHTL /Author/s- Open Access- Online @ http//: www.ajhtl.comin information retrieval, 1333–1336.Andaleeb, S. S. & Conway, C. (2006). Customer satisfaction in the restaurant industry: anexamination of the transaction‐specific model, Journal of services marketing. Emerald GroupPublishing Limited.Anderson, E.W. (1998). Customer satisfaction and word of mouth. Journal of ServiceResearch, 1, 5–17.Anwar, S. & Gulzar, A. (2011). Impact of perceived value on word of mouth endorsement andcustomer satisfaction: mediating role of repurchase intentions, International Journal ofEconomics and Management Sciences, 1(5), 46–54.Banerjee, S. & Singhania, S. (2018). Determinants of customer satisfaction, revisit intentionsand word of mouth in the restaurant industry–Study conducted in selective outlets of SouthKolkata, International Journal of Business and Management Invention (IJBM), 7(6), 63–72.Berliansyah, R. A. & Suroso, A. (2018). ‘The Influence of Food & Beverage Quality, ServiceQuality, Place, and Perceived Price to Customer Satisfaction and Repurchase Intention’,Journal of Research Management, 1(1).Cardello, A. V. (1995). Food quality: relativity, context and consumer expectations, Foodquality and preference, 6(3),163–170.Che, H., Lee, Y.-C. & Mu, H.-L. (2018). An Empirical Study on the Influencing Factors of O2OService Repurchase Intention: Evidence from Meituan Food Service in China, InternationalJournal of Pure and Applied Mathematics, 120(6), 5173–5184.Elam, C., Stratton, T. & Gibson, D. D. (2007). Welcoming a new generation to college: Themillennial students, Journal of College admission. ERIC, 195, 20–25.Espinosa, J. A. et al. (2018). I’ll have the usual: how restaurant brand image, loyalty, andsatisfaction keep customers coming back, Journal of Product & Brand Management. EmeraldPublishing Limited.Ghozali, I. & Latan, H. (2015). Partial Least Squares, konsep, teknik dan aplikasimenggunakan program Smartpls 3.0 untuk penelitian empiris, Semarang: Badan PenerbitUNDIP.Ha, J. & Jang, S. S. (2010). Effects of service quality and food quality: The moderating role ofatmospherics in an ethnic restaurant segment, International Journal of HospitalityManagement, 29(3), 520–529.Hair, J. et al. (2014). Exploratory factor analysis. Multivariate data analysis, 7th Pearson newinte
E. Relationship between Customer Satisfaction and Repurchase Intention The desire to repurchase a food or beverage product is a form of response from the customer of the experience of enjoying the product. Customer satisfaction affects repurchase intention in the coffee chain (Huang et al., 2014). Customer satisfaction has a positive influence on