Transcription
C ov er F e at u reStorytelling:The NextStep forVisualizationRobert Kosara and Jock Mackinlay, Tableau Software, SeattlePresentation—specifically, its use ofelements from storytelling—is the nextlogical step in visualization researchand should be a focus of at least equalimportance with exploration and analysis.Much of the early visualization research focusedon novel techniques, leading to questionsabout which one to use and for what task. Thisgave rise to evaluation papers that comparedtechniques and tried to ascertain the perceptualmechanisms behind them.Today, researchers have a good understanding of thevisualization design space, to the point where they can findsuitable techniques for most datasets and tasks. Althoughmore research is clearly needed in this area, the body ofexisting work provides useful ways of working with data.However, solid knowledge about the best ways to presentand communicate data is still lacking.Humans have always tied facts together into stories,effectively presenting information and making a pointin a memorable way. In addition to offering an incrediblypopular way of conserving data and passing it on, storiesalso provide the connective tissue between facts that makethem memorable.1 The use of elements from storytellingis therefore the next logical step in visualization research,specifically because storytelling can offer an effective wayto present data.44computerSTORY DEFINITION AND MODELSAt its essence, a story is an ordered sequence of steps,each of which can contain words, images, visualizations,video, or any combination thereof. Here, we focus onstories that primarily consist of visualization steps, whichcan include text and images but essentially are based ondata.In traditional stories, order roughly corresponds withtime, which is crucial for understanding causality: eventsthat happen earlier can influence later events, but not theother way around.1 Stories often are not told in a linearfashion, but rather use flashbacks and other literarydevices. However, within each segment, the order mustbe consistent—and the order of different segments clear—for the story to be comprehensible.This working model of story construction is the basis ofthe way journalists work. They collect information throughresearch and interviews, which gives them the key facts,and then they tie those facts together into a story. Becausethe goals and tasks during the research phase differ fromthose in the writing phase, so do the tools. For example,if the journalist works on a TV show, some of the materialfrom the research phase, such as pieces of video, mightend up in the final story, but most of the source materialonly serves as raw background information.Data analysts can use visualization for exploration,analysis, or presentation. However, the way they use thetechnology can differ, so the choice of technique will differ,as will how much and which data is shown. Althoughvisualization researchers often tacitly assume that thetools they use for analysis are suitable for presentationPublished by the IEEE Computer Society0018-9162/13/ 31.00 2013 IEEE
as well, this is a very limiting assumption. The goals andapproaches in analysis are different from the ones inpresentation, where the main objective is to get a pointacross or explain a finding.HISTORY OF STORYTELLING INVISUALIZATIONSome of visualization’s earliest examples aimed toshow and explain, not analyze. For example, FlorenceNightingale used charts not to analyze data about thecauses of death in the Crimean War, but to emphasize thesize of the problem to numerically illiterate politicians.Similarly, John Snow’s map of cholera cases in 1850sLondon was not intended to find the water pump that wasspreading the disease, but to present Snow’s evidenceafter he identified it using other means. 2 Likewise,Charles Minard’s map of Napoleon’s march on Moscowwas primarily a means of telling the story of the soldiers’plight and less an analytic tool for understanding complexrelated data.In modern visualization literature, the earliest workon storytelling that we could find describes the use ofstorytelling techniques to show the development of ahostage situation.3 But while the article makes interestingpoints about the power of storytelling, it did not describeactual visualization, perhaps because it was primarilybased on map views without numerical data. It did,however, describe the need to communicate the keyinformation about a situation clearly and concisely, andargued that stories are a good vehicle for this purpose.More recently, Edward Segel and Jeffrey Heer classifiedthe patterns and techniques that news media outlets useto tell stories visually.4 They identified commonly usedapproaches, including different layouts and semantic storystructures. One of the more interesting structures is whatthey called the martini glass, which starts with a broadintroduction, then narrows to make a particular point, andthen opens up interaction and exploration to the viewer.Jessica Hullman and Nick Diakopoulos explored the roleof rhetoric in narrative visualization and how it frames thepresented data.5 Specifically, they identified approachesfor communicating authority and data completeness,showing how these cues can help to prioritize particularinterpretations.On the evaluation side, George Robertson andcolleagues investigated the effectiveness of animation inpresentation and analysis—in particular, the type usedby Gapminder—and found that had limited effectiveness.6Still, Gapminder demonstrates that animated transitionsare useful for explaining visualizations and getting peopleinterested in data.Given that a presentation’s goal is generally to geta point across and to have the audience remember it,visualization’s effect on memory is important. Just likestories, embellishments add context to the presentedinformation. In a study of the effects of embellishmentson memory, embellished charts—similar to infographics—were easier to remember.7Data-based infographics are often considered badvisualization—and, when done for marketing purposes,they often are. However, visual journalism has a historyof incorporating informative and well-designed graphicsthat attract readers’ attention without distracting from thedata. Although little work has been done on understandingthese techniques from an academic perspective, interestin the area is growing.8Researchers can use stories not only tosupport discussion and decision makingbut also for process analysis.But storytelling is not limited to informationvisualization. Research into the role that storytelling shouldplay in scientific visualization reveals that it is valuablewhen illustrating findings gathered with complex tools.9In this case, storytelling features often include differentviews of the same data to make it easier to understand butare less concerned with overall story structure.Telling stories about data is a natural outcome whenvisualization is used in collaborative settings. Systems suchas Many Eyes and Tableau Public have long been used asvehicles for telling stories about the data being visualized.10In a more structured context, researchers can use storiesnot only to support discussion and decision making butalso for process analysis.11 Stories can thus serve as partof a finding’s provenance, similar to an event’s narratedhistory.TYPICAL STORYTELLING SCENARIOSVisualization researchers present information in avariety of settings in front of many diverse audiences. Eachof the following scenarios has requirements related to thetechniques used, the presentation structure, the amountof anticipated interaction, and so on.Self-running presentations for a large audienceMost news media presentations follow a similar style: apresentation is created once and then viewed by multiplepeople independently, without interaction between thepresenter and the audience. Some of these stories areentirely self-running—such as in a film clip—while othersrequire the user to click through a slideshow, but neitherinvolves any interaction beyond simple timeline control.The goal of such stories is similar to that of a writtenfeature: to get a point across and explain it in sufficientMay 201345
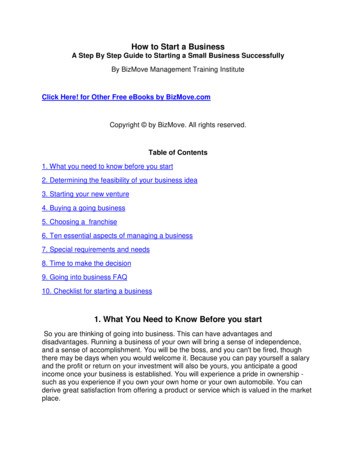
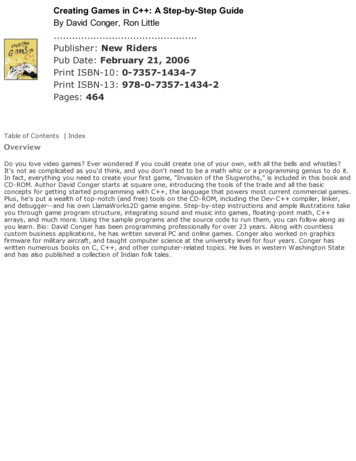
C ov er F e at u reFigure 1. Gapminder. This sequence transitions data from a stacked area chart to a scatterplot, explaining what to look for inthe visualization.detail for the viewer to both understand it and trust that itis based on real facts and data.A key concern with self-running presentations for largeaudiences is how to engage readers or viewers. To addressthis, many presentations offer a static view with a teaser andan information bite that does not require interaction. Thisis similar to including a catchy title and lede in a printedfeature, both of which are meant to pique the readers’curiosity and entice them to read the rest of the article.In addition to informing about an issue, a story oftentries to raise the readers’ or viewers’ awareness or generateinterest in a topic. To provide a deeper connection, the storyaims to get the reader or viewer closer to the data, or to atleast find out how it relates to them—one example is to provide a map that connects the viewer to the immediate area.Live presentationsMost business presentations employ live speakers infront of live audiences. A good example of this model isHans Rosling’s Gapminder presentation at the 2006 TEDconference (http://on.ted.com/s8BV). The main differencecompared to self-running presentations is that presenterscan respond to questions.A presentation based on a live visualization lets thepresenter pause the story and interact in response toquestions. The presentation can even adapt to changesmade at one point that carry forward through subsequentpresentation steps. In addition to the usual kinds ofinteractions used in visualization, the additional layerof annotation, highlighting, and so on can be especiallyuseful in this setting.46computerIndividual or small-group presentationsAlthough scenarios in which individuals or small groupsneed to present their research results might not seemdifferent from the previous scenario, they do potentiallyinvolve more interaction between the presenter and theaudience. This requires the presentation tool to be moreflexible than a simple slideshow so that the presentercan answer the multitude of questions that might comeup during the presentation. For example, in a discussionof quarterly results, questions about specific sales ormarketing measures might be asked that were not partof the story but are of interest to people in the audience.In addition to being able to ask and answer questions,it is often useful to record the kinds of questions asked sothey can be reviewed later. A well-presented story is likelyto lead to new questions for consideration when creatinga revision or that the presenter should follow up on. Inthis way, the presentation becomes a vehicle not only fordissemination of information but also for collecting andcondensing additional knowledge.CONCRETE EXAMPLESBoth self-running presentations and live presentationsin front of large audiences require making design choiceswhen preparing stories that use visualization.GapminderGapminder (http://gapminder.org) is a type of animatedpresentation that uses bubble charts, scatterplots withpoint size representing a value (such as population) toshow transitions over time. Although animated transitions
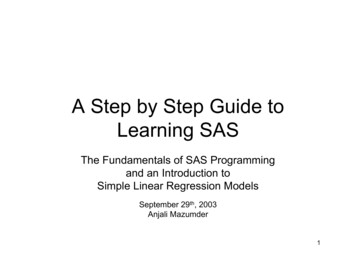
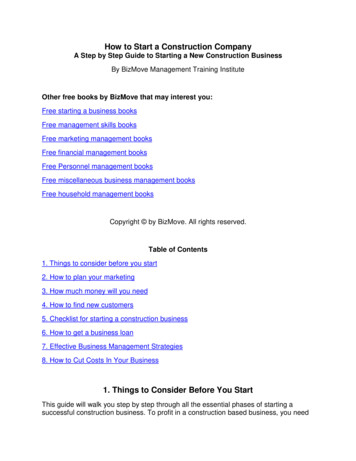
Figure 2. Excerpts from The New York Times slideshow “Copenhagen: Emissions, Treaties, and Impacts.” The controls let theuser move back and forth between steps, with content structured like a dialogue.have a slight detrimental effect on people’s ability to followtrends,6 they are both entertaining and captivating, andlend themselves well to live presentations in front of anaudience.In addition to transitions, Gapminder also demonstrates the effectiveness of building views up graduallyso the audience can follow along, even when thevisualization is relatively complex. Figure 1 shows anexample of the use of Gapminder, with several steps firstexplaining a distribution and percentiles, a stacked areachart, and a scatterplot. The entire transition is quitecomplex, but by breaking it up into small steps and usingentertaining but apt imagery, the audience can follow itwith relative ease.In the transition from the stacked area chart to thescatterplot and bubble chart, the differently coloredlayers—in this scenario, representing continents—turninto small circles or bubbles. The bubbles then slightlyrearrange to split off the Arabic countries from Africa andAsia. An x-axis that represents income determines theirhorizontal position, and the area chart also uses the sameaxis. Once the bubbles are explained, a vertical axis isunrolled, which the bubbles stick to. This animation verysimply but clearly explains the idea that bubble locationis determined not by just one value, but two—the secondone being a measure for health.A more thorough understanding of all the differentaspects of this presentation would be extremely usefulto guide further development of presentation tools usingvisualization. In particular, does engagement help peopleunderstand data or does it get in the way? Which kinds ofanimation are helpful, and which only distract? What is thetradeoff between distraction and engagement?SlideshowsAlthough the slideshow metaphor is simple, it facilitatestelling almost any story. For example, in a story about the2009 Copenhagen climate conference, The New York Timesused slideshow controls to provide a way of visualizingdata (http://nyti.ms/sFYztk).As Figure 2 shows, the content’s structure is compellingbecause it describes a relatively complex subject, withdifferent stakeholders who have different goals and ideasabout what should be done about climate change. Thepresentation walks the reader through those differencesand also shows the results of implementing the Kyotoprotocol in countries that have already agreed to it.The story is also of interest because its comparison ofthe metrics that lead to different interpretations mirrorsa common use case in business data. There are manyways to measure things that lead to clashing views ofthe same process. Understanding these differences andcreating a common view is a task that a well-constructedstory can support.Using a visualization such as a line chart also facilitatessimple interaction. For example, while the interaction inFigure 2 is limited to just highlighting grayed-out datavalues in some views, it is focused and keeps the userfrom straying too far from the point of the story. Thismakes it easy for the user to pick up the thread after anyinteractions, allowing the insertion of interaction points inmultiple places without making the story overly complex.May 201347
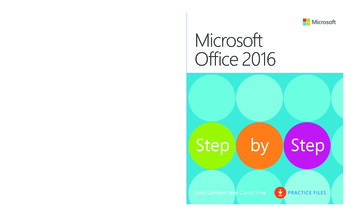
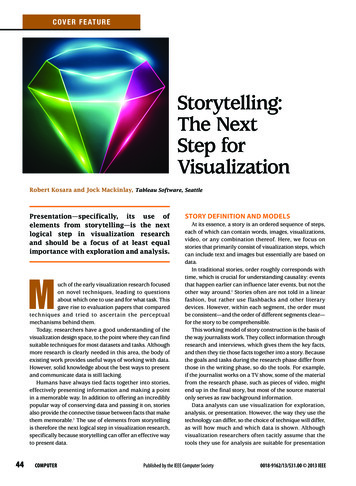
C ov er F e at u reFigure 3. Napoleon’s Russian campaign. Although Minard’s map is often cited as an example of visual storytelling, it does notinclude the typical elements of storytelling, such as progression through time.Other design choices exist, of course, but this focusedexample represents a pragmatic yet interesting take onthe visual storytelling design space.RESEARCH DIRECTIONSStorytelling research in visualization straddles theboundaries of several fields, including traditional computergraphics and visualization, cognitive psychology, and thesocial sciences.12Storytelling approaches and affordancesWhile Segel and Heer identified several genres andstrategies, their sample was limited to newspaper storiesand a particular presentation scenario.4 Developinga deeper understanding of storytelling strategies invisualization and examining a much broader sample ofpresentations will provide a richer library of approaches.It will also require a critical evaluation of the effectivenessof each of these stories.As a starting point, we propose the concept ofstorytelling affordances—features of a visualization thatprovide a narrative structure and guide the reader througha story. A fundamental feature of stories is that theyprovide a temporal structure, even if it is not necessarilylinear. Time is closely related to causality, so providingthe causal relationships between facts and events ties theindividual parts together in a cohesive structure.Figure 3 depicts Minard’s famous graphic trackingthe number of men Napoleon Bonaparte lost during hisill-fated march on Moscow, which offers a particularlyinteresting example to study. Specifically, the graphic48computerdepicts the size of Napoleon’s army at different stagesduring the campaign as the width of the tan and blackline. Drawn on top of a minimally styled map, the lineprovides both temporal and spatial information. Theleft-to-right direction is a natural one, making it easy forpeople to follow who are used to that reading direction.The connection with the temperature chart at the bottomalso provides a hint regarding the primary cause of thesoldiers’ deaths.In slideshows, affordances are typically obvious, butthere are cases where they are less so or even missing.Understanding these affordances will make it possible tocreate more effective stories that can be read effortlesslywhile providing ample information.EvaluationWhile there are undoubtedly many interesting storiesto be found in the news media, no clearly defined metricsor evaluation methods are available to measure theireffectiveness. Developing these methods will require thedefinition of—and agreement on—goals, such as what weexpect stories to achieve and how to measure that.Currently, many researchers evaluate visualizationsbased on the time it takes to complete a task and theresponse accuracy. However these metrics are not relevantfor understanding stories—meaningful story metricsinclude engagement and interest, ability to rememberkey points, information provided to make more informeddecisions, and so on.Controlled studies are often done in the lab, typicallywithin a relatively short time frame. Story evaluation will
require a very different approach to account for variousscenarios and to reflect real-world uses. The use ofcrowdsourcing platforms such as Amazon’s MechanicalTurk, for example, makes it possible for visualizationstudies to reach a wider and more diverse audience thanthe usual student population used in lab studies.Memory, context, and embellishmentsThe effects of visualization on memory have notbeen studied in much depth to date. Although this isunderstandable when it comes to analysis, effectivepresentations must create memories. Visualization tendsto be generic and minimalist: analysts prefer techniquesthat work with a wide range of datasets, and addingembellishments—so-called chart junk such as imagesor unusual color schemes—to visualizations is generallyverboten.However, the features that set a visualization apart areexactly the ones that make it memorable. Scott Batemanand colleagues’ study7 provided the first glimpse intothis topic, but the study’s design had flaws, the kinds ofvisualizations and infographics it used were limited, andit lacked interactivity.The space of possible questions to a sk a ndconfigurations to test is huge, so the results of studies inthis area will be of immediate use to many of the peopleworking with data.InteractionInteraction is one of the most important aspects ofvisualization. The ability not only to see the data but alsoto quickly change the view, add different data, and soon makes analyzing it much faster and more effective.Stories are traditionally told without interaction, andunlike analysis processes, are predefined and meant tobe delivered in their entirety.Among the attempts at interactive storytelling, computergames are perhaps the most interesting and certainly themost popular. However, it is debatable whether games arestories and not just worlds that the player can explore,similar to traditional data exploration or analysis.Clearly, there are uses for interaction in visualizationstories that do not interfere with the story arc. At thevery least, opening up a visualization for interaction atthe story’s end provides a convenient starting point forexploration and goes beyond a simple slideshow. Pausingthe story for interaction is another easy-to-imaginescenario, particularly in response to questions from theaudience when using visualization in a live presentation.There is a tradeoff between interaction and focus: theformer tends to distract from the story. Stories that respondto and change based on interaction, such as by selectinga particular part of the data or asking questions that theuser is interested in, are conceivable, but it is unclear howto do this without the interaction causing some form ofinterference.Annotations and highlightsVisualization is a powerful tool, but telling a storymight require augmentation through some other means ofcommunication, such as written text, audio, video, or linksto more information. Moreover, guiding the user throughthe story might require highlighting, arrows, or other tools.Most related research considers visualization to beentirely self-contained and independent of its use andsurroundings. To make it part of a story, the visualizationmust fit in with a presentation’s other elements. Thebalance between text and visualization becomes an issuewhen too much text takes away from the data but toolittle text leaves the viewer confused and unable to seethe connections. Where a visualization story might beplaced and how it is tied into a publication or website willinfluence the design decisions that go into building it.Opening up a visualization for interactionat the story’s end provides a convenientstarting point for exploration and goesbeyond a simple slideshow.Learning from other disciplinesStorytelling is practiced in many disciplines, offering ahuge opportunity to learn from other fields. Of particularinterest are ideas from the performing arts and film,especially those subdisciplines concerned with tellingstories: screenwriting, choreography, directing, and so on.Another relevant discipline is journalism, which continuesto increase its focus on integrated stories that contain text,images, audio, and video.In addition to providing access to a vast collection ofknowledge, interacting with other disciplines also opens upconsiderable opportunities for collaboration with artists,designers, filmmakers, and journalists.Techniques specific to storytellingAny visualization can be used as part of a story, butsome techniques lend themselves to storytelling betterthan others. For example, techniques such as theconnected scatterplot, in which the points are connectedwith a line in some order, or the slope graph, essentiallya single-axis pair from parallel coordinates, generally arenot very useful for analysis. However, they can be quiteeffective as storytelling devices for specific data. How wellthey work depends not only on the data structure but alsoon actual values. If the connected scatterplot results ina large number of tangled lines, it does not provide anyvalue, but if the values change relatively smoothly andMay 201349
C ov er F e at u rein slightly unexpected ways, the scatterplot provides thestarting point for a story.We are not aware of a systematic study of visualizationtechniques for their effectiveness as storytelling devices.Such studies could give a better understanding of thedesign space for visualization techniques that are usefulin storytelling.Storytelling promises to open entirely new avenuesof visualization research. Moving from explorationto analysis to presentation is a natural progression,mirrored by the research effort focused on these steps overtime. As the field becomes more mature, researchers mustfocus on presentation. This will prove even more crucial asvisualization is increasingly used for decision making.ReferencesStories and collaborationStorytelling is an inherently collaborative activity: thereis no point in creating a story if there is no audience. Littleresearch has been done on collaboration in visualization,and storytelling could provide an interesting starting pointfor more work in this area. As the small-group presentationscenario demonstrates, stories naturally lead to questions,which lead to discussions, which lead to deeper analysis.In addition to being a good way to present data, storiesalso offer an effective means of packaging informationand knowledge in a way that is easy for another personto understand. Perhaps visual data stories will becomethe way to preserve information about complex dataand processes and pass on knowledge in the future—notunlike they once were, before reading and writing becamecommon skills.IEEE Open Access1. M. Austin, Useful Fictions: Evolution, Anxiety, and theOrigins of Literature, Univ. Nebraska Press, 2011.2. S. Johnson, The Ghost Map, Riverhead Trade, 2007.3. N. Gershon and W. Page, “What Storytelling Can Do forInformation Visualization,” Comm. ACM, vol. 44, no. 8,2001, pp. 31-37.4. E. Segel and J. Heer, “Narrative Visualization: Telling Storieswith Data,” Trans. Visualization and Computer Graphics,vol. 16, no. 6, 2010, pp. 1139-1148.5. J. Hullman and N. Diakopoulos, “Visualization Rhetoric:Framing Effects in Narrative Visualization,” Trans.Visualization and Computer Graphics, vol. 17, no. 12, 2011,pp. 2231-2240.6. G. Robertson et al., “Effectiveness of Animation in TrendVisualization,” Trans. Visualization and Computer Graphics,vol. 14, no. 6, 2008, pp. 1325-1332.7. S. Bateman et al., “Useful Junk? The Effects of VisualEmbellishment on Comprehension and Memorability ofCharts,” Proc. ACM Conf. Human Factors in ComputingSystems (CHI 10), ACM, 2010, pp. 2573-2582.8. A. Cairo, The Functional Art, New Riders Press, 2012.9. K.-L. Ma et al., “Scientific Storytelling Using Visualization,”IEEE Computer Graphics and Applications, vol. 32, no. 1,2012, pp. 12-19.10. C.M. Danis et al., “Your Place or Mine? Visualization as aCommunity Component,” Proc. ACM Conf. Human Factorsin Computing Systems (CHI 08), ACM, 2008, pp. 275-284.11. W. Willett et al., “CommentSpace: Structured Support forCollaborative Visual Analysis,” Proc. ACM Conf. HumanFactors in Computing Systems (CHI 11), ACM, 2011,pp. 3131-3140.12. L. Zunshine, Why We Read Fiction: Theory of Mind and theNovel, Ohio State Univ. Press, 2012.Unrestricted access to today’s groundbreaking researchvia the IEEE Xplore digital libraryIEEE offers a variety of open access (OA) publications:Robert Kosara is a visual analytics researcher at TableauSoftware, Seattle, with a special interest in the communication of, and storytelling with, data. Kosara received a PhD incomputer science from the Vienna University of Technology.Contact him at rkosara@tableausoftware.com. Hybrid journals known for their established impact factors New fully open access journals in many technical areas A multidisciplinary open access mega journal spanning allIEEE fields of interestDiscover top-quality articles, chosen by the IEEE peer-reviewstandard of excellence.Learn more about IEEE Open AccessSelected CS articles and columns are availablefor free at -access5012-TA-0424-Open Access 3.25x4.75 Final .indd 1computerJock Mackinlay is vice president of visual analysis atTableau Software, Seattle. His research interests includeinformation visualization and human-computer interaction. Mackinlay received a PhD in computer sciencefrom Stanford University. He is a member of the IEEEComputer Society and ACM. Contact him at jmackinlay@tableausoftware.com.9/24/12 10:06 AM
However, visual journalism has a history of incorporating informative and well-designed graphics that attract readers’ attention without distracting from the data. Although little work has been done on understanding these techniques from an academic perspective, interest in the area is growing. 8 But