Transcription
Railway Safety in theEuropean UnionSafety overview 2017Report
Europe Direct is a service to help you find answersto your questions about the European Union.Freephone number (*):00 800 6 7 8 9 10 11(*) The information given is free, as are most calls(though some operators, phone boxes or hotels may charge you).Neither the Agency nor any person acting on behalf of the Agencyis responsible for the use which might be made of the following information.Luxembourg: Publications Office of the European Union, 2017PrintPDFISBN 978-92-9205-383-3ISBN 978-92-9205-384-0ISSN -17-101-EN-CTR-AG-17-101-EN-N European Union Agency for Railways, 2017Reproduction is authorised provided the source is acknowledged.For any use or reproduction of individual photos, permission must be sought directly from the copyright holders.
ContentsSafety overview 2A background note about the data and their collection 4Key figures 5Accident outcomes 5Trend analyses 7Accidents, fatalities and serious injuries 10Risk levels 12Intermodal comparison of risk 16Accident outcomes 17Significant accidents 17Accidents and incidents involving transport of dangerous goods 20Suicides on railway premises 21Casualties (fatalities and serious injuries) from significant accidents 25Precursors to accidents 27Accident costs 30Safety of infrastructure 31Traffic volumes 33Independent accident investigation 39Serious accidents in 2016 41Background information 44List of abbreviations 46List of country codes 47Contents 1
Safety overviewThis electronically published overview report complements the biennial report on railwaysafety performance in the European Union. It sets out the railway safety performance inthe European Union for the year 2015. The findings published here are from the commonsafety indicator (CSI) data for 2015, plus information on significant accidents from theEuropean Railway Accident Information Links (ERAIL) system covering 2016.We thank the Member States for their cooperation in ensuring that all the CSI data werereceived on time (30 September 2016).Overall, the CSI data demonstrated that railway safety in the EU-28 has continued to showa general improvement since 2010. Up to 2015 the number of fatalities and serious injurieswas down, as was the number of significant accidents. We are concerned, however, bya stagnation in the reduction of the number of fatalities to: level-crossing users, and employees.Neither of these indicators showed improvement in the 3 years from 2013 to 2015. In add ition, the number of precursor incidents rose sharply, principally driven by track buckles.There are several reasons why such precursors might have become more common, butwithout further data at EU level it is not possible to know with any certainty what thesemight be. We can only say at this stage that the trend reflects either: better or increased reporting of precursor incidents; an increase in railway safety risk; or a combination of the above.Without better safety management data, reporting systems and analysis we cannot beginto address the root causes and drivers of such changes. We hope to work with nationalsafety authorities to achieve better understanding and sharing of what is already collectednationally.Looking ahead to the data from 2016 on the Agency’s ERAIL system, it is a matter of deepconcern that we see an increase in each of the numbers of fatalities in train collisions andderailments and the number of accidents with five or more fatalities. This should serve asa call to action for us all to work harder to control risks and maintain a sustainable and saferailway system.European Union Agency for Railways13 July 20172 SAFETY OVERVIEW 2017
Safety overview 3
A background noteabout the data andtheir collectionWe are aware that some national safety authorities (NSAs) experienced problems in uploading their data to the European Railway Accident Information Links (ERAIL) (1) system(common safety indicator (CSI) section). The Agency is working to ensure these problemswill not arise again and, in parallel, we are exploring the options for and costs of a newIT solution as part of the common occurrence reporting project (2), which is intended todevelop wider reporting and data sharing over the next 5 years.In reporting the trends or the direction of trends (upwards or downwards) we have normally used the 2011-2015 period, sometimes with a comparison to the 2015 data. Occasionally we have used the 10-year period from 2006 to 2015. In previous reports the normwas to look back over the last 3 years. While, due to a lack of consistent data, this wasacceptable when the Agency first started to report, we now have between 6 and 10 yearsof indicator data supplied to us with consistent definitions. Where we have consistent datafor longer time periods we use these to illustrate the medium- and longer-term trends.(1) ERAIL: European Rail Accidents Information Links is a public database hosted by the Agency in order that thenational investigation bodies in each Member State can share information and recommendations relating to safetyoccurrences in the European railway system.(2) .aspx4 SAFETY OVERVIEW 2017
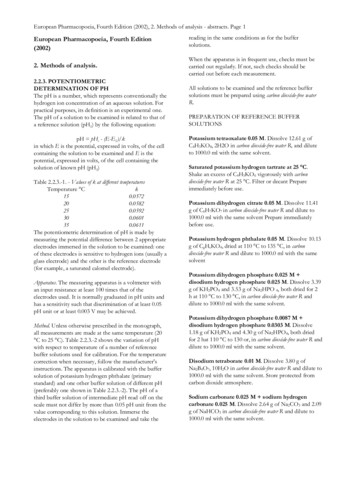
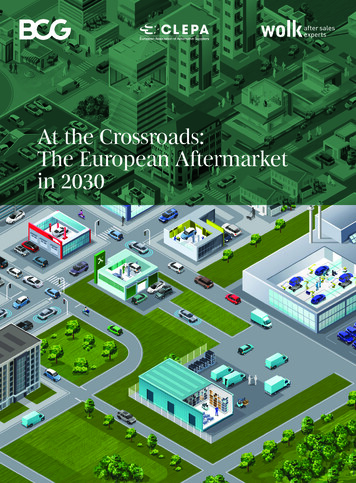
Key figuresAccident outcomesOver the last 4 reported years there have been on average just over 2 000 significant accidents each year on the railways of the EU Member States. Accidents to persons caused byrolling stock in motion and level-crossing accidents constitute more than three quartersof railway accidents, excluding suicides. In these accidents on average just under 1 100persons are killed and 900 persons seriously injured each year. There has been a long-termdownward trend in all these indicators.In 2015 all of these CSIs continued to improve across the EU, with 1 808 significant accidents resulting in 963 fatalities and 684 persons seriously injured. The year-to-year reduction between 2014 and 2015 is significant for accidents, fatalities and serious injury numbers. These main outcomes decreased over recent years (Figure 1).4 0003 5003 0002 5002 2921 3672 2242 0691 3802 0001 9802 0761 1041 2491 0501 8081 0151 5009118196841 0001 5171 4781 3831 27050002007*2008*2009*Fatalities2010Serious injuries1 2061 1351 1291 05496320112012201320142015Significant accidentsFigure 1: Significant accidents and resulting casualties (EU-28; 2010-2015)* Not all EU-27 Member States reported during the 2006-2009 period.In addition to collating and reporting the CSIs from the NSAs, the relevant national investigation bodies (NIBs) report serious and catastrophic accident investigations in the ERAILsystem. In 2014 we were able to report, for the first time since the Agency’s inception, thatKey figures 5
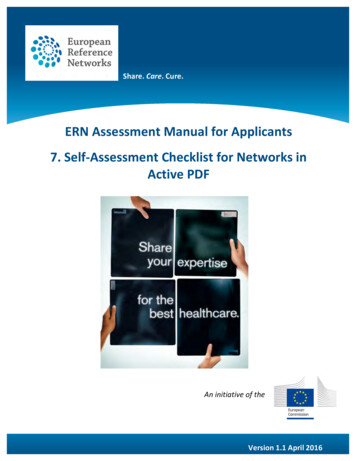
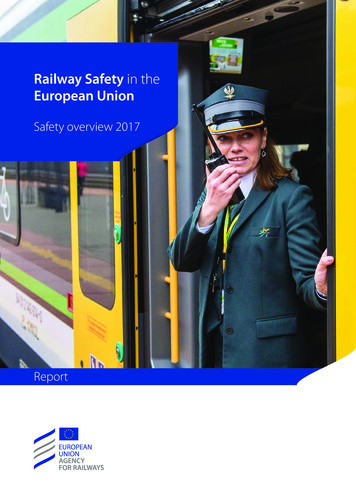
there had been no catastrophic railway accidents (3) in the Member States. However, therewere two catastrophic collisions or derailments on EU railways in 2015 and three in 2016.It should be noted that the 2015 data exclude the accident at Eckwersheim (France). Thisaccident took place on 14 November 2015, during the testing phase for a new high-speedline, and involved the derailment of a test train. The Bureau d’enquêtes sur les accidentsde transport terrestre (BEA-TT — the French NIB) reported the occurrence in ERAIL (underthe category ‘Other’). In October 2016 the Établissement public de sécurité ferroviaire(EPSF — the French NSA) informed us that they considered the accident outside of thescope of the railway safety directive (4) for the purposes of reporting. The final report onthe accident was published by BEA-TT on 23 May 2017 (5). There are clearly lessons tobe learnt from this accident and a judicial inquiry is still in progress, therefore we haverefrained from including this occurrence in the safety statistical reporting.Although the 2015 and 2016 catastrophic accident outcomes are below the averagenumber of accidents in this category recorded over the past decade, they are neverthelessa deterioration in comparison to the result achieved in 2014 and in the 2010-2014 period(see Figure 2).The trend in the accident rate per billion train-kilometres for accidents resulting in five ormore fatalities is downward over the 1980-2016 period.The data in Figures 2 and 3 come from the historical archive of railway accidents maintained by the Agency; they show the number of major accidents and resulting fatalities forthe 37 years covering the 1980-2016 period. This historical archive includes not only traincollisions and derailments with five or more fatalities, but also major level-crossing accidents, train fires and accidents involving groups of persons struck by rolling stock inmotion. Figure 2 is a composite graph showing the numbers of railway accidents resultingin more than five fatalities and the total number of fatalities per year. Such accidents aresometimes described as catastrophic due to the size of their impact on society and on therailway sector, although this term is not defined by 1685429897868066 715233 3764464640 3652563830681006817 22 18288394238500 101013 1420 2019819 0819 1819 28319819 4819 58619819 78819819 9919 0919 1919 29319919 4919 5919 6919 7919 89920020 00120020 20320020 4020 5020 60720020 8020 91020120 112098Fatalities17410020120 516Accidents ( five fatalities)227Figure 2: Railway accidents with five or more fatalities (1980-2016) (6)(3) A catastrophic accident can be described as one with more than five fatalities, but it should be noted that this termis not defined by legislation.(4) Directive 2004/49/EC of the European Parliament and of the Council of 29 April 2004 on safety on the Community’srailways and amending Council Directive 95/18/EC on the licensing of railway undertakings and Directive 2001/14/EC on the allocation of railway infrastructure capacity and the levying of charges for the use of railway infrastructureand safety certification (railway safety directive).5( ) See G/pdf/rapport beatt 2015-016.pdf(6) All EU Member States, plus Norway and Switzerland, excluding Romania for the 1980-1989 period. Accidents onrailway mainlines not covered by the railway safety directive are also included.6 SAFETY OVERVIEW 2017
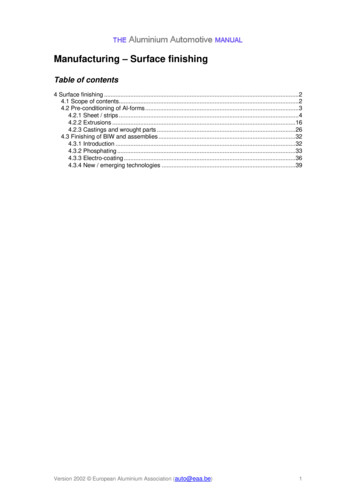
While the long-term trend is downwards, the number of accidents with multiple fatalitieshas risen since 2014. This negative trend is of concern to the Agency and others engagedwith the oversight of railway safety. While the change in the number of accidents is notstatistically significant, this is not true for the change in the number of fatalities occurringin 2016, therefore we consider that robust conclusions can be drawn from this worryingupward trend.256.05.0192020 ents174.01050Accidents / billion train-km5-year moving 993199219910.01990Fatal train collisions and derailments per billion train-kmThe overall level of railway safety in the EU, as measured by fatal train collisions and derailments per billion train-kilometres, has also gradually improved since 1990, although thereis considerable scatter from year to year.AccidentsFigure 3: F atal train collisions and derailments per billion train-kilometres (EU-28,Norway and Switzerland (7); 1990-2016 — train-kilometres for 2016 arean estimate based on 2015 data)The analysis of trends, illustrated in Figure 3, shows a reduction in the accident rate ofbetween 5.7 % (using the 5-year moving average rate of change) and 6.52 % (accidentrate for individual years 1980 and 2015) per year. This gives a fall of 75 % from 1990 to 2015.Despite this long-term trend, the Agency is concerned to see that in 2016 there was a stat istically significant increase in these combined indicators.For further information regarding fatal train collisions and derailments in 2016 see thesection on serious accidents — Table 4.Trend analysesThe Agency was set up in 2004. For the majority of Member States in the European UnionCSI data now exist for the 10 years from 2006 to 2015. We note that three Member States(Greece, Hungary — possibly related to the migrant crisis — and the Netherlands) andthe Channel Tunnel had 2015 outcomes for all fatalities that went against the three 5-yearglobal trend averages or the 10-year global trend, and that one Member State, Austria,had a 2015 outcome that was worse than the three 5-year means. The trend analyses areshown in Figure 4.(7) Figure courtesy of Andrew W. Evans (Imperial College and University College London), based on own database offatal train accidents and collisions and on the train-kilometre data from ERA, Eurostat and the Union internationaledes chemins de fer.Key figures 7
8 SAFETY OVERVIEW 201720152011 - 20152010 - 20142009 - 20132006 - 2015These data are flagged with red and orange markers, the red indicating an individual Member State’s performance in 2015 moving against the downward trend for both the 5- and10-year averages and the orange indicating performance against the trend for only the 5-year averages.Figure 4: Railway fatalities per million train-kilometres (EU-28, Norway and Switzerland; 2015, 5-year means and 10-year mean — order is based on 2015 performance)0.00.20.40.60.81.01.21.41.61.82.0
Key figures 9BEBGCHCTTotal number of significant accidentsATCZDKEEELESFIFRHRHUIETotal number of persons killed (excluding suicides) in all accidentsDEITLULVNLNOPLPTROSESISKUKTotal number of persons seriously injured (excluding attempted suicides) in all accidentsLTFigure 5: Number of significant accidents, total fatalities (including unauthorised persons but excluding suicides) and total seriously injured (including unauthorised persons,excluding attempted suicides) on railways (EU-28, Norway and Switzerland; 2015)050100150200250300
Figure 4 illustrates the detection of trends, both negative and positive, in railway safety. Thissuggests that further improvement in safety performance is possible. We discussed abovethe negative trends illustrated in the report, but we can also see positive improvements ina number of priority Member States, along with others that had previously exhibitedlower levels of railway safety. By looking at the data and statistics in a different way we maybe able to help to identify problem areas and, ultimately, drive further improvement inrailway safety. These trend analyses are designed to help Member States in their trackingof continuous safety improvement set out in Article 4(1)(a) of Directive (EU) 2016/798.Accidents, fatalities and serious injuriesThe number one strategic objective of the European Union Agency for Railways (ERA) is tomake the EU the world leader in railway safety. Although comparative data are not readilyavailable, we believe that to achieve this the number of accidents, fatalities and seriousinjuries still has to be reduced. We have so far focused our efforts on achieving improvement in those Member States not yet performing to the current EU average, where therate of accidents, passenger fatalities and serious injuries is normalised either by usage orby operational or network parameters (see the report Railway safety performance in theEuropean Union 2016 (8)).This reduction in the variance of performance would support the wider strategic objectiveof creating a single European railway area. It is also a striking fact that, based upon the2011-2015 indicators, if all Member States were to achieve this normalised EU average theactual number of fatalities would have been reduced from 5 487 to 3 151 — more than450 fewer fatalities per year.Normalising the data in this way allows an assessment of performance relative to risk exposure, or an understanding of the rate at which the railways in Member States are moving passengers and goods without harm. Although undoubtedly a useful form of analysis,this can create a distorted picture of rail safety if used by itself.As the Member States previously identified for support (9) on the basis of normalised dataimprove, additional improvement may be found by targeting those Member States withthe highest absolute numbers of accidents, as shown in Figure 5.(8) http://erail.era.europa.eu/documents/SPR.pdf(9) The priority countries programme.10 SAFETY OVERVIEW 2017
Key figures 11
One important area in which improvement has not been seen is in the number of workerfatalities (Figure 946442829342002006*2007*2008*2009*2010Worker fatalities20112012201320142015Worker serious injuriesFigure 6: Fatalities and serious injuries to railway workers (EU-28; 2006-2015)* Excludes Croatia prior to 2010.We have analysed the number of fatalities and serious injuries to railway workers over the10-year period from 2006 to 2015. While the number of workers seriously injured fell from126 in 2006 to 49 in 2015 (a fall of over 60 %), the number of fatalities fell from 38 in 2006to 34 in 2015 (just over a 10 % fall). The trend over the 3 years from 2013 saw an increasein the number of worker fatalities of more than 20 % from 28 in 2013 to 34 in 2015. Hadthe worker fatality outcome trend followed that for worker serious injuries, we would haveexpected only 15 worker fatalities in 2015, i.e. 19 fewer fatalities than were reported.Risk levelsAccident risk is expressed as the number of outcomes per exposure. Considering all railway fatalities (excluding suicides), the fatality risk per million train-kilometres in the 20112015 period was 0.27 fatalities per million train-kilometres in the EU Member States. Thefigure for 2015 alone is lower at 0.23 fatalities per million train-kilometres. Values of riskvary greatly between Member States, with a more than 30-fold difference between Member State safety outcomes. The distribution of Member States’ accident risk, expressed asthe fatality risk per million train-kilometres over the 5 years from 2011 to 2015, is shownin Figure 7.12 SAFETY OVERVIEW 2017
Figure 7: R ailway accident fatality risk on EU railways: fatalities per million trainkilometres (2011-2015)Personal risk for railway passengers can be expressed in terms of passenger fatalities perpassenger-kilometre. For the EU-28 over the 5 years from 2011 to 2015 and 2015 alone, thefatality risk range was between 0 and 0.085 fatalities per 100 billion passenger-kilometresrespectively. Figure 8 maps the passenger fatality risk over the 5 years from 2011 to 2015by Member State.Key figures 13
Figure 8: M ap of personal risk on railways: passenger fatalities per 100 billionpassenger-kilometres (EU-28, Norway and Switzerland; 2011-2015)In the last safety overview report (covering the 2006-2013 period) we reported that sixMember States and the Channel Tunnel had recorded no passenger fatalities in the reviewperiod, thus their passenger fatality risk is zero. In this report we look further into thisaspect. We observe an increase in the number of Member States reporting zero passengerfatality risk per year (see Figures 8 and 9).14 SAFETY OVERVIEW 2017
0820092010201320142015Figure 9: N umber of EU Member States with one or more years (continuous) withzero passenger fatalitiesSo far, year on year, we have seen only growth and stability in the numbers of MemberStates with zero continuous passenger fatality risk. If a Member State has a passengerfatality, they would be excluded at the next analysis — this will actually happen to at leastone, if not more, of these Member States in the reporting period for 2016 due to accidentsduring that year. This will be seen in the 2018 safety performance report.Within our 10-year reporting period (2006-2015) three Member States reported zero passenger fatality risk for the full period — Ireland, Lithuania and Slovenia. It may be evenlonger than this for some of these Member States — Lithuania’s official statistics portalgives zero passenger fatalities for all years back to 2004 (10).Within the data reported to the Agency the Channel Tunnel had zero passenger risk for9 years of CSI reporting and Luxembourg for 7 years (due to their entry dates into thereporting system). Other Member States reporting over the full 10 years, but with a lowernumber of years with zero passenger fatalities, include the United Kingdom with 8 years,Latvia with 6 years and Belgium, Greece and Croatia with 5 years.There are certain limitations in these benchmarking indicators: they rely on the numbersof fatalities only, since serious injury data are not believed to be fully comparable betweencountries, and the period considered is not of the same length because of the limitedcompatibility of certain data before 2009.Similarly, one can show the levels of risk for different types of persons and different expos ure. This is done within the framework of common safety targets (CSTs) and national reference values (11), where the values exist for six categories of person and sometimes for twotypes of exposure.(10) See lize?id 2037&status A(11) See Report — 2017 assessment of achievement of safety targets mmon%20Safety%20Targets.pdf ).Key figures 15
Intermodal comparison of riskComparisons of fatality risks for travelling passengers (occupants) reveals that rail is oneof the safest modes of transport. The fatality risk for an average passenger is about 0.10fatalities per billion passenger-kilometres, comparable with the risk of commercial flightpassengers of 0.06 fatalities per billion passenger-kilometres. The fatality risk for a trainpassenger is lower than the risk for a bus/coach passenger.Transport mode used byuserFatalities per billion passenger-kilometresAirline passenger (on EUterritory)0.06Railway passenger0.10Bus/coach occupant (note: figuresrelate to the 2010-2014 period not2011-2015)0.19Maritime vessel passenger0.27Car occupant2.67Car driver1.82Car passenger0.85Powered two-wheelers37.80Table 1: Fatality risk of passengers using different modes of transport (EU-27;2011-2015) (12)(12) Sources: European Commission, DG Mobility and Transport, Statistical pocketbook 2016 — EU transport in figures, 2016;Eurostat, extracts from various transport statistics taken in April 2017, n Maritime Safety Agency, Annual overview of marine casualties and incidents 2016. Also note, air and sea: onlydomestic and intra-EU-28 transport. Data concerning bus and coach occupants for 2015 are not yet available andhence the previous figures covering the 5 years from 2010 to 2014 are used instead.16 SAFETY OVERVIEW 2017
Accident outcomesSignificant accidentsThe lowest number of significant accidents for the 2011-2015 period was recorded in 2015.Three categories of accidents decreased, i.e. accidents to persons, level-crossing accidentsand derailments of trains (see Figure 10). However, there were increases in the numbersof collisions of trains, fires in rolling stock and all other types of accidents. Using standardstatistical methods, these decreases in accidents to persons, level-crossing accidents andderailments of trains are statistically significant (13), however the increases relating to collisions of trains, fires in rolling stock and other accidents are not. Table 2 below indicates thenumber of accidents by category in 2015 compared with the mean number of accidentsper year over the 5 years from 2011 to 2015, the difference between the actual number in2015 and the mean, and whether or not the change was statistically significant.Number ofaccidents 2015Mean numberof accidents peryear 2011-2015 /– compared tothe meanStatisticallysignificant at the5 % levelCollisions of trains1239627NoDerailments of trains7799– 22YesLevel-crossing accidentsAccidents to persons469540– 71Yes1 0241 282– 258YesFires in rolling stock30219NoOther accidents8590–5No1 8082 128– 320YesAll accidentsTable 2: Comparison of significant accidents in 2015 compared to the 5-year mean(2011-2015) and whether the change observed in 2015 was statisticallysignificant or not(13) Savage, I., The economics of railroad safety, Kluwer Academic Publishers, Dordrecht, 2014, p. 178. The test examinedwhether there was a greater than 5 % probability that the decreases did not occur at random at the 95 % significancelevel for all the accident subclassifications. By using the 5 % probability level we assessed whether such changescould occur at random once in 20 years. See http://faculty.wcas.northwestern.edu/ ipsavage/103-manuscript.pdfAccident outcomes 17
18 SAFETY OVERVIEW 2017073Collisionsof trains124 12397 101108 104Derailmentsof trains91 9777573510506 4692011Level-crossingaccidents517Figure 10: Significant accidents per type of accident (EU-28; 2011-2015)5001 0001 5002 0002 5002012Accidentsto persons20131 0241 1551 2071 2111 4512014Fires inrolling stock16 14 30 31 302015Other accidents100 8576 81 76All accidents1 8082 069 2 0761 9802 224
Accidents to persons represent 60 % of significant accidents, and together with level-crossingaccidents, but excluding suicide events, account for 85 % of all accidents. Collisions andderailments together account for 10 % of all accidents (Figure 11).1%5%5%Accidents to persons4%Level-crossing accidentsCollisions25 %Derailments60 %Other accidentsFires in rolling stock2%5%4%Accidents to persons7%Level-crossing accidentsCollisionsDerailments26 %57 %Other accidentsFires in rolling stockFigures 11a and 11b: B reakdown of significant accidents per type (EU-28; 20112015 and 2015)In 2015 the proportions of accidents in each category were broadly similar when compared to the 2011-2015 period, though with slightly higher proportions of accidents in thecat egories of level-crossing accidents, collisions, fires in rolling stock and other accidents,and with lower proportions in the categories of accidents to persons and derailments.Accident outcomes 19
Accidents and incidents involving transport ofdangerous goodsWhen a railway accident involves dangerous goods, whether they are being transportedor not, it must be reported under a separate category of accident: accidents involvingdangerous goods. Depending on the type and consequences, an accident involving dangerous goods may also be reported in duplicate as a significant accident. In 2015 MemberStates reported a total of 14 accidents involving dangerous goods, of which seven involvedthe release during the accident of the dangerous goods being transported (Table 3). The14 accidents involving dangerous goods occurred in eight EU Member States.20112012201320142015Number of accidents involving at least one railway vehicletransporting dangerous goods in which dangerous goodswere NOT released19139157Number of accidents involving at least one railway vehicletransporting dangerous goods in which dangerous goodsWERE released91011167Total number of accidents involving at least one railwayvehicle transporting dangerous goods2823203114Table 3: Railway accidents involving dangerous goods (EU-28; 2011-2015)The reporting of accidents involving the transport of dangerous goods is governed by theRID (14) and notably means that not only accidents but also incidents could be eligible for reporting under CSI data (
safety indicator (CSI) data for 2015, plus information on significant accidents from the European Railway Accident Information Links (ERAIL) system covering 2016. We thank the Member States for their cooperation in ensuring that all the CSI data we