Transcription
Australia’s genderequality scorecardKey findings from the Workplace GenderEquality Agency’s 2017-18 reporting dataNovember 2018
About the Workplace GenderEquality Agency’s datasetThe Workplace Gender Equality Agency (WGEA, the Agency) is an Australian Government statutoryagency charged with promoting and improving gender equality in Australian workplaces in accordancewith the Workplace Gender Equality Act 2012 (the Act). The Agency’s vision is for women and men to beequally represented, valued and rewarded in the workplace.Under the Act, non-public sector employers with 100 or more employees must submit a report annuallyagainst six gender equality indicators:GEI 1:gender composition of the workforceGEI 2:gender composition of governing bodies of relevant employersGEI 3:equal remuneration between women and menGEI 4: availability and utility of employment terms, conditions and practices relating to flexibleworking arrangements for employees and to working arrangements supporting employeeswith family or caring responsibilitiesGEI 5:consultation with employees on issues concerning gender equality in the workplaceGEI 6:sex-based harassment and discrimination.The Agency’s dataset is based on 4,644 reports submitted in accordance with the Act for the reportingperiod 1 April 2017 to 31 March 2018. Over four million employees across Australia are covered, whichaccounts for more than 40% of employees in Australia. Findings from the full dataset were released on13 November 2018.WGEA datasetSince 2013-14, there has beenan increase of 264,440 employeescovered in our dataset.4.1 millionemployees (4,156,340)The Agency’s dataset covers over 40% of employees in Australia and comprises:Full-time employees53.7%Part-time employees21.6%Casual employees24.7%50.1%Women49.9%Men
Progress updateInsights from five years of dataThis year marks the fifth year of reportingon data collected from Australian employersin the private sector. The results of ourlatest dataset emphasise the importanceof measuring workplace gender equality.Our data shows that change is happeningin Australian workplaces. In some areas, it ishappening quickly. In others, it is far too slow.The gender pay gap continued its downward trend, which isgreat. However, men still out-earn women, on average, by 21.3%.Pay gaps persist in every industry, occupation and manager category.Our data also shows clear evidence that employer action has deliveredreal results. There were increases in the number of employers analysingtheir remuneration data for pay gaps and embracing policies or strategiesto improve gender equality in areas such as succession planning, talentidentification, retention, promotions and linking manager KPIs to genderequality outcomes. The strong pipeline of women into management hasstrengthened and over seven in ten employers now have either a policyor strategy in place to support gender equality or promote flexible work.It is gratifying to report such positive outcomes but the Agency’s dataalso shows that more effort is still required in some areas.Last year, our data identified an "action gap". Organisations have policiesand strategies in place, but they are not making managers accountablefor embedding them in their workplaces. Regrettably, this gap has notnarrowed. Although more employers are analysing their pay data, over40% of those who did took no action.There are a few other problem areas. Access to parental leave has groundto a halt. Although the proportion of women in management has increased,most senior roles, especially at the CEO level, are still dominated by men.Again this year, there is virtually no improvement in the number of womenaround Australia’s boardroom tables. Just over 35% of the boards andgoverning bodies in our dataset have no female members.Despite this frustrating lack of progress in some areas, the manypositive trends in our data make me ever hopeful and optimistic aboutthe increasing momentum for gender equality in Australia’s workplaces.This 2018 gender equality scorecard offers Australia a snapshot of our2017-18 data. I encourage you to explore this unique national resourcefurther by visiting data.wgea.gov.au. It will be well worth your visit!ContentsData snapshot .2Gender pay gaps.4Base salary .4Total remuneration.4Manager and non-manager .5Industry .6Average pay gaps by industry .7Employer action on gender equality.8Action on pay equity .8Gender equality strategies.9Flexible working . 10Parental leave and support for caring . 11Workforce composition.12Women in leadership. 12Women on governing bodies. 13Occupational segregation . 13Women in management by industry. 14Industry segregation. 15Where women and men work . 16Employment status . 17Advice and assistanceFor further advice and assistance, please contact:Workplace Gender Equality AgencyLevel 7, 309 Kent StreetSydney NSW 2000E: wgea@wgea.gov.auwww.wgea.gov.auFollow us on social media@WGEAgency@wgeagencyLibby LyonsDirectorwww.wgea.gov.au I Workplace Gender Equality AgencySearch Workplace GenderEquality Agency@wgeagency1
WGEA 2017-18Data SnapshotOver 25k gender pay gapLargest single-year drop in the gender pay gapfor five years (down 1.1pp to 21.3%). Menstill take home 25,717 a year more thanwomen on average.29.4% 25kpay gap inconstructionConstructionpay gap increasesAt 29.4%, Construction saw a 2.0ppincrease in the gender pay gap. Financialand Insurance Services still has the highestpay gap (30.3%) although it has declinedsteadily over the five-year dataset.Health pay gapincreases againGender pay gap in favour ofmen increases for the second yearrunning in Australia's mostfemale-dominated industry(up 1.4pp from 14.7% in2015-16 to 16.1% in wgea.gov.au I Workplace Gender Equality Agency
Women’s promotionscontinue to riseWomen now comprise 39.1% of allmanagers, with 43.3% of managerappointments in 2017-18 going to women.Gender balance remainsstatic at the topFemale CEOs increased slightly by 0.6pp to17.1% and female representation on boardscrept up by 0.9pp to 25.8%.70.7%2.4pp4ppEmployers supportingflexible workMore employers have a policy or strategy forflexible working (up 2.4pp to 70.7%), but only5.2% have set targets for employee engagement.Pay equity analysison the riseThere was a 4 percentage point increasein organisations analysing pay data(up to 41.6%). However, over 40% of thoseemployers took no action to close the gap.Employer focus ongender equality increasesAlmost 75% of employers have an overall genderequality strategy or policy (up 2.8pp). However,only 31.4% have implemented KPIs formanagers relating to gender equality outcomes.www.wgea.gov.au I Workplace Gender Equality Agency3
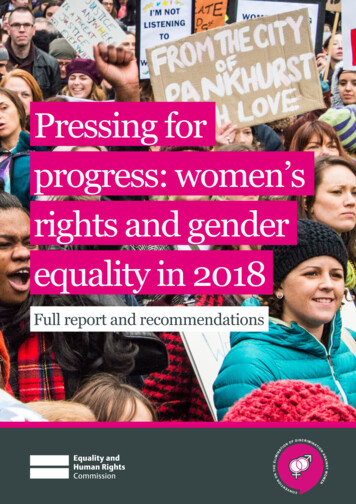
Gender pay gapA gender pay gap is the difference between women’s and men’s average weekly full-time equivalent earnings, expressed as apercentage of men’s earnings.The WGEA dataset includes gender pay gaps by industry and by manager category and non-manager occupation. It includessuperannuation, bonuses and other additional payments. Gender pay gaps across the WGEA dataset are an indicator of women’soverall position in the workforce and do not compare like-for-like roles.Gender pay gaps are influenced by a number of factors including discrimination and bias, women and men working in differentindustries and jobs, women’s disproportionate share of unpaid caring and domestic work, the under-representation of women insenior roles, the lack of workplace flexibility and greater time out of the workforce by women. All gender pay gaps are based onfull-time employees only, excluding CEOs.Base salary gender pay gapTotal remuneration gender pay gapWomen’s average full-time base salary across allindustries and occupations is 16.2% less than men’s( 15,457 p.a.).Women’s’ average full-time total remuneration acrossall industries and occupations is 21.3% less than men’s( 25,717 p.a.).16.2%21.3%( 15,457 p.a.)( 25,717 p.a.)Gender pay gaps continue downward trendBase salary and total remuneration gender pay gaps have declined year-on-year since 2013-14. The 2017-18 period saw thelargest single-year drop in the total remuneration gender pay gap since the WGEA started collecting data.Chart 130Change in full-time base salaryand total remuneration genderpay gaps (GPG)25Total remunerationGPGBase salary ea.gov.au I Workplace Gender Equality Agency
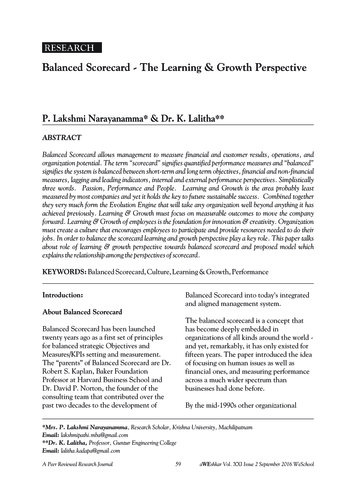
Gender pay gapsGender pay gaps by manager category and non-manager occupationGender pay gaps favour men across all levels of the workforceThere continues to be a gender pay gap in every industry and occupation. Every manager category and non-manager occupationalso shows a gender pay gap favouring men for full-time employees.Gender pay gaps are influenced by a range of factors including non-salary benefits such as bonuses at senior levels, relianceon awards and collective agreements in some occupations and concentration of women and men in different industries.The gender pay gap has declined in all manager categories over the past 12 months with the the largest decrease at the seniormanagement level. There has also been a decrease in every non-manager occupation with the exception of Community andpersonal services which saw a slight increase of 0.4pp. The occupation with the largest fall in its gender pay gap this year wasLabourers with a 2.8pp decrease.Chart 2Full-time total remuneration gender pay gap by manager category and non-manager occupationManagersDifferencefrom 201617 (pp)Non-managers22.0%Other executives / general managers-2.018.8%Senior managers-2.321.6%Other managers-1.3-0.419.0%Professionals26.4%Technicians and tradesCommunity andpersonal servicesClerical and administrative-0.18.3%-0.223.7%14.3%Machinery operators and drivers-0.618.3%Labourers510-0.3 0.49.5%Sales0-0.624.3%Key management personnel1520-2.82530Total remuneration GPG%www.wgea.gov.au I Workplace Gender Equality Agency5
Gender pay gapsGender pay gaps by industryAll industries have a gender pay gap in favour of menFinancial and Insurance Services remains the industry with the highest total remuneration gender pay gap at 30.3%.However, it has decreased year-on-year since 2013-14.Construction has now replaced Rental, Hiring and Real Estate Services as the industry with the second-highest gender pay gapat 29.4%. There was a 5.1pp decline in the gender pay gap in Rental, Hiring and Real Estate Services to 26.3% - the largest singledrop of any industry sector.The female-dominated industry of Health Care and Social Assistance saw its second annual increase in its gender pay gap(up 1.4pp from 14.7% in 2015-16 to 16.1% in 2017-18).Table 1Total remuneration gender pay gap by industry, ranked from highest to lowest2013-142014 - 152015 - 162016-172017-18*Financial and Insurance Services36.135.033.531.930.3 Construction25.426.328.027.429.4 Rental, Hiring andReal Estate Services25.628.429.331.426.3 Agriculture, Forestry and Fishing21.620.921.825.723.7 Professional, Scientific andTechnical Services27.927.327.525.423.7 Information Media andTelecommunications25.423.323.522.721.8 Other Services17.318.314.815.719.9 Transport, Postal and Warehousing22.621.421.921.819.5 Arts and Recreation Services22.821.021.120.519.0 Electricity, Gas, Water andWaste Services19.321.520.018.716.1 Health Care and Social Assistance16.418.114.715.716.1 Retail Trade17.615.516.216.315.5 Mining17.217.615.814.714.0 Manufacturing14.914.114.213.913.8 Administrative andSupport Services23.020.714.815.913.7 Accommodation and Food Services11.710.911.411.912.4 9.69.39.410.69.7 11.610.510.09.88.5 9.18.710.59.24.9 24.724.023.122.421.3 IndustryEducation and TrainingWholesale TradePublic Administration and SafetyANZSIC (All)*Movement since 2016-176www.wgea.gov.au I Workplace Gender Equality Agency
Gender pay gapsGender pay gaps by industry – average amountsAll industries have a gender pay gap in favour of menAlthough all industries have gender pay gaps in favour of men, the actual dollar amounts vary widely between industries.The large differences between the total remuneration and base salary gender pay gap in the Financial and InsuranceServices, Construction and Rental, Hiring and Real Estate Services industries suggest additional payments such asbonuses and commissions are a factor.Table 2Pay gaps by industry, ranked from highest to lowest by the difference in average total remuneration ( )Base salaryGPG (%)Differencein averagebase salaryTotalremunerationGPG (%)Difference inaverage totalremunerationFinancial and Insurance Services23.1 27,35330.3 48,884Construction24.3 26,45429.4 39,950Rental, Hiring and Real Estate Services17.8 17,67326.3 35,474Professional, Scientific and Technical Services20.1 22,73823.7 32,289Information Media and Telecommunications19.1 20,54821.8 29,451Agriculture, Forestry and Fishing20.7 16,60823.7 23,564Mining10.6 12,99314.0 23,465Electricity, Gas, Water and Waste Services11.4 12,66116.1 22,633Transport, Postal and Warehousing15.9 13,75319.5 21,923Other Services13.9 11,80419.9 21,070Arts and Recreation Services17.7 15,45219.0 18,946Health Care and Social Assistance14.4 12,50916.1 16,4279.8 8,19213.8 14,54110.3 6,95615.5 12,9587.9 8,0659.7 11,650Administrative and Support Services14.5 10,28113.7 11,530Accommodation and Food Services11.5 7,90612.4 9,840Wholesale Trade5.2 4,1118.5 8,501Public Administration and Safety1.2 8424.9 4,40716.2 15,45621.3 25,716IndustryManufacturingRetail TradeEducation and TrainingANZSIC (All)www.wgea.gov.au I Workplace Gender Equality Agency7
Employer actionon gender equalityAction on pay equityMore organisations analyse gender pay gapsThere was solid growth in the number of employers analysing their payroll data for gender pay gaps (up 3.9pp to 41.6%).Of these, almost six in ten reported taking action as a result of their pay gap analysis (up 3.8pp to 58.5%).However, an action gap remains, with 41.5% of employers who did a pay gap analysis taking no action, although not all ofthese organisations identified a pay gap.The industries most likely to take action after completing their analysis are Mining (up 14.1pp to 75.9%), Information Mediaand Telecommunications (up 16.5pp to 73.6%) and Financial and Insurance Services (up only 0.3pp to 71.6%).The female-dominated Retail Trade industry was one of the industries where employers were least likely to take action aftertheir pay gap analysis (37.1%, down 4.4pp).Chart 3Percentage of organisations that took action as a result of their gender pay gap %403020102013-142014-15The most common actionsfollowing a pay gap analysiswere identifying the cause/sof the gap (35.9%); reportingpay equity metrics to theexecutive (29.4%) and reviewingremuneration decision-makingprocesses (27.2%).2017-18More organisations with formal strategies for pay equityThe number of organisations implementing formal policies and/or strategies on remuneration with specific pay equity objectivesis increasing. 61.6% of organisations report that they have a formal policy and/or strategy on remuneration, an increase of 3.2percentage points in the past year. Of these organisations, 40% now have pay equity objectives in their remuneration policyand/or strategy.Chart 4Organisations with pay equity objectives in their remuneration policy and/or 82014-152015-162016-17The most common pay equityobjective is ‘To ensure no genderbias occurs at any point in theremuneration review process’,which increased 1.6pp in thepast year to 84.9%.2017-18www.wgea.gov.au I Workplace Gender Equality Agency
Employer action on gender equalityGender equality strategiesEmployers focus on gender equalityThe data continues to show substantial improvements in employer focus on workplace gender equality across a numberof areas over the past 12 months.Nearly 75% of the organisations reporting to the Agency now have an overall gender equality strategy and/or policy(up 2.8pp to 74.3%).There have also been large gains in the number of employers with targeted policies and/or strategies in place to supportgender equality in succession planning, talent identification, retention and promotions.The proportion of employers with KPIs for managers relating to gender equality has increased by 3.0pp over the past12 months, but it is still just over three in ten of all employers so there is plenty of room for improvement.Chart 5Percentage of organisations with policies and/or strategies to support genderequality in specific human resource 172017-18PromotionsTalent identificationRetentionSuccession planningKPIs for managerswww.wgea.gov.au I Workplace Gender Equality Agency9
Employer action on gender equalityFlexible workingMore organisations promote flexible workingThe 2017-18 data shows a 2.4pp increase in the number of organisations reporting they have a formal flexibility policyand/or strategy in place.Chart 6Percentage of organisations with a policy and/or strategy for flexible 7%50402013-142016-172017-18 Electricity, Gas, Water and Waste Services overtook Financial and Insurance Services with a 4.0pp increase to becomethe industry with the highest proportion of organisations with a formal policy and/or strategy on flexible workingarrangements (87.0%). The strongest improvements were in Transport, Postal and Warehousing (up 9.9pp to 64.7%) and Information,Media and Telecommunications (up 4.4pp to 80.1%).Agriculture, Forestry and Fishing remains the industry with the lowest proportion (up 2.1pp to 51.0%).Flexibility strategiesEmployers have a range of measures in place to support their flexible working strategies. Two of the strongest growth areas overthe past 12 months were ‘flexible working is promoted throughout the organisation’ (up 4.1pp) and ‘leaders are visible role models’(up 4.5pp).Just over one in four organisations with a flexible working strategy provide manager training on flexible work, just one in 20 settargets for employee engagement in flexible work and less than two in 100 have set targets for men's engagement in flexible work.Chart 7Percentage of organisations with flexibility strategies that include the following %Flexible workingis promotedthroughout theorganisationEmployees surveyedon flexibility meetingtheir needsManager training isprovided throughoutthe organisation10Leaders are visiblerole modelsLeaders are heldaccountable forworkplace flexibilityTargets have beenset for engagementin flexible workBusiness caseestablishedand endorsedEmployee training isprovided throughoutthe organisationTargets have been setfor men’s engagementin flexible workwww.wgea.gov.au I Workplace Gender Equality Agency
Employer action on gender equalityParental leave and support for caringLittle movement on access to paid parental leaveMore than 50% of employers provide no access to paid primary carer's leave, in addition to the government scheme.Access to paid parental leave is highly dependent on the size and industry of the employer.In 2017-18, the number of employers offering paid parental leave for primary carers increased by 1.8pp to 47.8%. Primary carer’s leave is most commonly offered in Education and Training (79.0%) and Financial andInsurance Services (73.2%). Electricity, Gas, Water and Waste Services remains in the top three (71.7%) despite a 7.0pp drop since 2016-17. Primary carer’s leave is least frequent in Accommodation and Food Services (21.2%) and Retail Trade (21.0%). Primary carer’s leave is most commonly available in large organisations: 74.0% of organisations with 5000 employees offer it, compared with 42.2% of organisations with fewer than 250 employees. Average length of paid primary carer's leave offered is 10.3 weeks.41.8% of employers offered paid parental leave for secondary carers – an increase of 2.5pp. Average length of paid secondary carer’s leave offered is 1.6 weeks.Women account for 94.9% of all primary carer’s leave utilised with men accounting for only 5.1%.Overall, women account for 72.2% of all carer’s leave while men comprise the remaining 27.8%.Improved results on support for caringThere is solid growth in organisations reporting they have a formal policy and/or strategy to support employees with familyor caring responsibilities (up 2.3pp to 64.3%).For the first time in three years, the proportion of employers offering non-leave based measures to support employees withcaring responsibilities has increased (up 1.8pp to 53.7%).Domestic violenceMore organisations support employees experiencing domestic violenceThere was an increase in the number of employers who have a formal policy or strategy to support employees who areexperiencing family or domestic violence, up 3.8pp to 46.9%. The industries with the strongest increase were Electricity, Gas,Water and Waste Services (up 16.2pp to 63.0%) and Health Care and Social Assistance (up 7.7pp to 59.4%)The number of employers offering other forms of support for employees experiencing family or domestic violence increasedby 3.5pp to 85.4%.Chart 8Percentage of organisations with the following domestic violence support mechanisms85.4%67.5%66.1%60.8%40.9%35.7%Support mechanismsin place to supportemployeesexperiencing familyor domestic violenceFlexible workingarrangementsAccess tounpaid leaveConfidentiality ofmatters disclosedReferral tosupport servicesProtection fromadverse actionor discriminationwww.wgea.gov.au I Workplace Gender Equality Agency11
Workforce compositionWorkforce compositionWomen in leadershipThe most senior roles are heavily male-dominatedThe representation of women declines with seniority. However, the representation of women acrossall manager categories has grown consistently since 2013-14.Chart 9Proportion of women by management categoryMenWomenCEO /Head ofBusiness17.1%2017-2018Key managementpersonnel (KMP)Other executive /general 2014-152013–1435.2%Senior 62014-152013–1442.6%Other 62014-152013–1450.1%Australian 162014-152013–1450.0%49.7%48.8%48.5%Female managers overall 39.1%(up from 35.9% in 2013-14)6.4% of all managers are employed on a part-time basisProportion of women appointed to manager roles(including promotions) remained static this year at 43.3%12www.wgea.gov.au I Workplace Gender Equality Agency
Workforce compositionWomen’s representation on governing bodiesThe growth in the number of women appointed to boards and governing bodies remains slow.The proportion of female directors in 2017-18 was 25.8% (up 0.9pp from 2016-17)The proportion of female chairs in 2017-18 remained at 13.7% (no real change from the previous year)35.2% of boards and governing bodies have no female directors. By contrast, only 0.9% had no male directors.Chart 10Percentage of boards without either women or men5040% no women% no 152015-162016-172017-180Occupational segregationNon-manager roles segregated by occupationWomen comprise 51.4% of all non-manager roles and are concentrated in traditionally female occupations including Communityand personal service and Clerical and administrative.Chart 11Percentage of women in non-management occupationsWomen74.1%71.7%59.9%53.3%Clerical andadministrativeCommunityand bourersTechniciansand tradeMachineryoperatorsand driverswww.wgea.gov.au I Workplace Gender Equality Agency13
Workforce compositionWomen in management by industryIncreases in women managers across most industriesWomen’s management representation has increased in most industries, with only four sectors recording lower proportions offemale managers this year.The biggest industry increases in female representation among managers were in Financial and Insurance Services (up 2.3pp to40.7%), Administrative and Support Services (up 1.9pp to 46.6%) and Arts and Recreation Services (up 1.6pp to 36.7%).Table 3Proportion of women in management by industry, from highest to ealth Care and Social Assistance69.370.370.270.370.2Education and Training48.449.249.751.252.1Retail Trade46.347.047.948.148.5Administrativeand Support Services49.849.243.144.746.6Accommodation and Food Services47.744.444.345.044.5Financial and Insurance Services37.337.937.838.540.7Other Services39.538.838.438.039.4Arts and Recreation Services32.233.533.835.136.7Professional, Scientificand Technical Services30.931.632.533.334.1Rental, Hiring andReal Estate Services32.532.632.933.833.8Information Media , Postal and Warehousing23.723.724.625.625.9Wholesale 23.023.5Electricity, Gas, Waterand Waste Services19.821.522.222.222.9Public Administration and .2Agriculture, Forestry and 912.012.114www.wgea.gov.au I Workplace Gender Equality Agency
Workforce compositionIndustry segregationAustralia’s workforce remains highly gender segregatedAcross the workforce, women and men are concentrated in different industries. Of the 19 industries, just seven have at least 40%women and men. Women are concentrated in Health Care and Social Assistance and Education and Training and least representedin Construction and Mining.Mining and Administrative and Support Services are the only industries where women are not under-represented in managementcompared to their representation across the industry. All other industries, even female-dominated ones, have a lower proportion ofwomen in management compared to women in the workforce. Agriculture, Forestry and Fishing (17.9pp), Financial and InsuranceServices (14.2pp), Arts and Recreation Services (13.9pp) and Wholesale Trade (12.3pp) have the biggest gap between therepresentation of women in the workforce and the representation of women in management.Table 4Proportion of women employees and representation of women in management by industry80.0%70.2%Health Care andSocial Assistance63.6%52.1%Education and Training57.7%48.5%Retail TradeFinancial andInsurance Services54.9%40.7%Accommodation andFood Services52.0%44.5%50.6%36.7%Arts and Recreation Services46.2%39.4%Other ServicesAdministrative andSupport Services44.4%46.6%Rental, Hiring andReal Estate Services41.3%33.8%Professional, Scientific andTechnical Services40.9%34.1%Information Media andTelecommunications38.9%32.9%36.3%24.3%Wholesale TradeAgriculture, Forestryand Fishing34.8%16.9%Transport, Postal ctricity, Gas, Water andWaste Services% Women24.8%22.9%% Women managers20.6%20.3%Public Administrationand 9.1%All industries01020304050607080% of Female Representationwww.wgea.gov.au I Workplace Gender Equality Agency15
Workforce compositionWhere women and men workWomen’s workforce participation is concentrated in a few large industries. Health Care and Social Assistance is byfar the largest employer of women, followed by Education and Training and then Retail Trade.Men are more evenly spread across the workforce than women, although they have low representation in thehighly-feminised industry of Health Care and Social Assistance.Table 5Gender composition by industryIndustry%womenHealth Care and Social Assistance80.0Education and Training63.6Retail Trade57.7Financial and Insurance Services54.9Accommodation and Food Services52.0Arts and Recreation Services50.6Other Services46.2Administrative and Support Services44.4Rental, Hiring and Real Estate Services41.3Professional, Scientific and Technical Services40.9Information Media and Telecommunications38.9Wholesale Trade36.3Agriculture, Forestry and Fishing34.8Transport, Postal and Warehousing26.4Manufacturing26.3Electricity, Gas, Water and Waste Services24.8Public Administration and Safety20.6Construction17.0Mining16.7All industries50.1% Women16% Menwww.wgea.gov.au I Workplace Gender Equality Agency
Workforce compositionAustralian workforce by employment statusWomen and men work differentlyChart 12Chart 13Female employees by employment statusMale employees by employment status40.0%21.8%32.4%Casual maleCasual femaleFull-timefemale67.5%27.6%10.7%Part-time maleFull-time malePart-timefemaleGrowth in casual jobs for both women and menThe Agency’s 2017-18 dataset covers 4,156,340 employees in total – an additional 104,235 employees comparedwith 2016-17.Representation of women in the dataset has increased, exceeding the 50% mark (50.1%) for the first time.Retail Trade continues to be the largest industry represented, closely followed by Health Care and Social Assistance whichrecorded another strong year-on-year growth in employee numbers. Administrative and Support Services also saw a strongincrease in employees.Comp
positive trends in our data make me ever hopeful and optimistic about the increasing momentum for gender equality in Australia's workplaces. This 2018 gender equality scorecard offers Australia a snapshot of our 2017-18 data. I encourage you to explore this unique national resource further by visiting data.wgea.gov.au. It will be well worth .