Transcription
CHAPTERSHominid BrainEvolutionP Thomas SchoenemannINTRODUCTIONU nderstanding brain evolution involves identifying both the physical changes thatoccurred, as well as understanding the reasons for these changes. There are two waysin which inferences about evolutionary changes are made. By comparing a species ofinterest against other modern species, one can determine what exactly is different, andin what way it is different. By studying the fossil record , one assesses the time-courseof evolutio nary changes. Both of these approaches have strengths and weaknesses.Significantly more data are available from modern forms, both in terms of the numberof species one can assess and the specific details and subtleties of the adaptations studied, parts of the brain, connectivity between regions, neurotransmitter systems, cytoarchitecture, integrated functioning, and so fortl1 . However, one cannot unequivocallyreconstruct the common ancestral states with tl1is method because modern forms arethemselves tl1e end-products of separate evolutionary lineages. In some cases it appearsthat many lineages have evolved in parallel from a commo n ancestor different fromany living species. In addition, one cannot determine the time-course of evolutionarychange from a comparative analysis of the anatomy alone. For this, one needs thefossil record . The time-course may hold clues abo ut tl1e functional significance ofbrain evolution, depending on the timing and sequence of other features or factorstl1at might be related to brain evolution (e.g., climate, technological, and biologicalchanges). However, fossil data on brain evolution are limited, since brains tl1emselvesdo not fossilize, leaving us vitl1 only their surrounding braincases (if we are even thatlucky) . Thus, botl1 approaches, comparing modern species and assessing fossilevidence, are essential. Since tl1ere was one actual evolutionary history, our inferencesabout what happened - however derived- should all point towards tl1e same conclusions if we are truly on tl1e right track (Vincent Sarich, personal communication).A Companion to Paleoanthropology, First Edition . Edited by David R. Begun. 2013 Blackwell Publishing Ltd. Published 2013 by Blackwell Publishing Ltd.
HOMINID BIWN EVOLUTION137BRAIN SCALINGThe earliest comparative studies of brain and body size revealed that bigger-bodiedspecies tended to have bigger brains. T he relationship approxi mates a power fu nctionof the form: [brain] k[body]' . Log transfo rm ing both variables resu lts in a (reasonably) straight line: [log brain ] [log k] a[ log body]. Thus, the slope of the linedescribing the relationship between log brain and log body represents the exponentof the power fu nction . Empirical studies of mammals show that the relationship isstatistically very strong (e.g. , 1' 0·95; Martin 1981 ). Nevertheless, the 95 percentconfidence intervals for mammals encompass at least a 10-fold range in possible brainsizes at a given body size (Schoenemann 2006). This indicates that whatever influencebody size might have on brain size, it is actually relatively weak. This is consistent withexperiments showing that selection on body weight causes very little change in brainweight, which should not be the case if there really were a strong intrinsic developmental constraint tying brain size with body size (Atchley 1984; Riska et al. 1984).Empirically, the power fu nction exponent describing brain/body scaling appears tobe close to 0·76 (Martin 1981 ), significantly less than 1 (isometry). There are twomajor explanations that have been offered for this pattern. Jerison (1973) suggeststhat brains serve to create a model of tl1e external world, based on the array of sensoryinputs they obtain . H e believes the most important inputs for this arc somatosensory(touch, pain, heat, body position), which correspond to information from the bodysurface. Since surface area scales to the two-thirds power of vol ume, brains shouldscale at the two-thirds power of body size. H e later refined this model to argue thatonly the cortex (which is devoted to modeling the external world) should scale withbody surface area, not the whole brain (Jcrison 1988 ). Further, since cortical thickness also increases with brain size (at about the 0·17 power), brain size would actuallybe expected to increase at greater than the two-thirds power of body size (Jerison1988). By combining known empirical scaling estimates for both brain-to-body size(0·76; Martin 1981 ), and brain-to-cortical surface area (0·91; Jerison 1982 ), one candirectly predict how cortical surface area should scale with body size:If:[cortical surface area] k1 [brain size]0' 9 1[brain size] lz2 [body sizet76T hen:[cortical surface area] It, [I [body sizet76t 91 I [body size t 69This exponent (0·69) is very close to the two-thirds exponent predicted by Jerison .One problem witl1 this model is that cross-sectional area of tl1e spinal cord , whichis as good a proxy as any for the number of afferent and efferent fibers connecting thebrain witl1 the body surface, actually scales much lower than the two-thirds power ofbody size (Fox and Wilczynski 1986). T he model also requires tl1at tl1e there be asimple, isometric relationship between cortical volume and the complexity of processing done on th ese sensory inputs. Exactly how this type of processing is accomplishedat the neural level is unknown at present, however.
138P. THOMAS SCH OENEMANNT he other explanation for the 0·76 power scaling of brain-to-body size is related tothe fact that total metabolic resources also scale with body size at the 0·76 power inmammals. Since brain tissue is particularly metabolically expensive (Hofi11an 1983;Aiello and Wheeler 1995), total metabolic resources would be an important upperconstraint on brain size (M artin 198 1; Armstrong 198 3). Because of various types ofevolutionary cognitive "arms races" , species may be expected to tend towards largerbrain sizes generally, but the most adaptive brain size for a given species would behighly niche-dependent. This model is consistent with th e fi ndi ng of a substantialdegree of variation in brain size at a given body size .1Because both of these hypotheses predict approximately the same scali ng relationship between brain and body size, it is not possible, based on the scaling relationshipitself, to judge which is more li kely (Deacon 1990 ). From a theoretical perspective,however, it is unclear why the degree of complexity of an organ ism's model o f theworld should necessari ly scale with its body surface area, whereas th e metabolic costsof large brains are obvio us. It may be that the association ben:veen cortex size andbody surface area is accidental.Regardless of why it occurs, the empirical relationship ben:veen brain and body sizehas led to an emphasis on contro lling fo r body size when compari ng brain sizeben:veen species . The most widely used is probably Jerison's (1973) EncephalizationQ uotient (EQ ), which is simply th e actual brain size of a species divided by the(empirically-derived ) esti mate o f the average brain size fo r a mammal of that bodysize. Human E Qs are in the 5-7 range (depending on the exact slope of the empiri calli ne derived for mammals). T he behavioral relevance of EQ over absolute brain size ishighly questionable, however (see below).COMPARATIVE PERSPECTIVES ON BRAIN EVOLUTIONMost co mparative studies have primarily focused on how humans differ fro m ex pectatio ns based on primate trends, tho ugh ape disproportions have also been highlightedwhen found. These stud ies have clearly shovvn that the human brain is not simply anenlarged version of a chimpanzee brain (Deacon 1992; Rilling 2006). Some of thedifferences appear to be allometric (i.e., the result of predictable scaling patternsben:veen parts), while others do not. Both types of differences probably have nontrivial behavioral implications (contrary to what is often assumed ).An example of an important diffe rence explained by allometry is the size of theneocortex. In humans, it accounts for over 80 percent of the entire size o f the brain ,compared with less than half in some pri mates (Schoenemann 2009 ). T his appears tobe mostly a predictable result o f brain size increase: humans have about as much neocor tex as one vvould predict given a primate brain of our brai n size. Another suchpattern involves the proportion of the cortex that is made up of white matter (primarily connective axons) vs. gray matter (primarily dendrites and neuron cell bod ies).Mo re t han 4 0 percent o f the human cerebral cortex is white matter compared witho nly 21 percent of macaque (M acaca mttlatta) brains. This turns out to be a fu nctionof cerebral cortex size (H ofman 1985 ). Interestingly, the empirical relationship suggests that white matter does not actually increase fast enough to keep areas as directlyinterconnected with one another in larger brains. This means that there is an inherent
HOMINID BRAIN EVOLUTION139stru ctural bias towards increasing cortical specialization as brains increase in size.Based on published diagrams of currently- mapped , cytoarchitecturally-defined cortical areas for 19 mam mal species, C hangizi and Shimojo (2005 ) showed that the number of distinct cortical areas appears to be a function of increasing brain size. U singthe equation derived fi·om all mammals, humans sho uld have approximately 150 cortical areas, compared with o nly approximately 100 in chimpanzees and approxim ately75 in the largest- brained mo nkeys (e.g., Papio papio). Although data for only threeprimates were available ( Callithrix) Aottts) Macaca), they all had g reater estimatedtotal num bers of cortical areas tl1an tl1e general mammal predi ction, suggesting thatamong mam mals primates m ig ht be particularly biased towards cortical specialization.I n any case, even though the trend towards increasing cortical specialization is'explained ' by allometry, it nevertheless has fundamentally impo rtant behavioralimplicatio ns (Schoenemann 2009).Within the neocortex itself, the size of functio nal areas appear to be relativelyunconstrained by allometry. T he relative size of particular neocortical areas in mammals is predicted by the behavio ral specializati o ns o f a given species. About half of theneocortex of the echo -locatin g Ghost Bat (Mac1'odermagigas) is involved in processing auditory info rmation, for example (Krubitzer 1995). In humans, at least threeneocorti cal areas appea r to be sig nificantl y smaller tha n expected, given a primatebrain our size (calculated from Blinkov and Glezer 1968; Stephan et al. 1981):primary motor cortex (approximately 33 percent as large as predicted ), premotor(approximately 60 percent as large), and primary visual (V1; approximately 60 percentas large). Since o ur neocortex as a whole is not smaller than expected, some otherparts m ust therefore be larger. T he human fronta l cortex is not larger o verall(Scmendefe ri et a!. 2002 ), but because two of its subdivisio ns are sig nifican tly smallerthan expected (premotor and primary motor ), the remainder must be significantlylarger. Most empirical studies, dating back to Brodmann's initial cytoarchitecturalstudies (Brodmann 1909), seem to suppo rt this view (see review in Schoenemann2006). T he temporal lobe also appears to be somewhat larger than predicted , tho ug happarently not by as much as the prefrontal (Ri lling and Seligman 2002). Althoug hcomparative studies of the pa rietal lobe area arc lacki ng, morphometric studies ofendocranial surfaces suggest sig nificant changes in this area as well (Bruner 2004 ).Some non-neocortical areas also show interesting patterns . T he olfactor y bulb(sense of smell ) is o nly approximately 31 percent as large as predicted (data fromStephan et al. 1981). The cerebell um, though slig htl y smaller than expected for aprimate brain size as large as ours, is sti ll almost three times larger than expected basedo n body size (Rilling and I nsel 1998; MacLeod et al. 2003). Apes as a g ro up appearto have undergone a grade shift in cerebellar proportions. Compared with monkeys,their cerebellar hemispheres are 2·7 times larger than expected for their cerebellarvermis sizes (MacLeod et al. 2003). With respect to body size, apes have cerebellarhemispheres approximately 2·4 times large r than monkeys, and humans 5·8 timeslarger (MacLeod et al. 2003). T his is intrig uing because the cerebellum has long beenknown to play a major role in moderating motor control, and as such would beexpected to scale o nly with body size.As with the cerebellum , the basal ganglia in humans are o nly approximately 65percent as large as predi cted for a primate brai n o ur size (Stephan et al. 1981;Schoenemann 1997), but about twice as large with respect to body size. T he basal
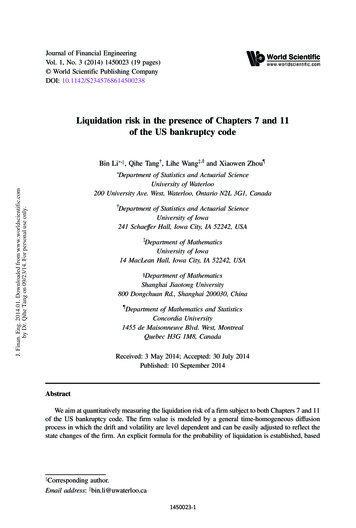
140P. THOMASSCHOENEMANNganglia are known to be involved in a variety o f m otor functions, but they have alsobeen implicated in lang uage processing (H ochstadt et al. 2006), suggesting that theincrease over body size predictions might have important behavioral consequences.Potentially independent of gross anato mical changes, there are important suggestions of differences in the existence, elaboration, and/or o rganizatio n of neuronal celltypes, which is currently tl1e focus of much study ( Preuss 2006; Sherwood and Hof2007). In apes and humans, unique patterns are fo und in anterior cing ulate cortex(attentional and emotio nal processing), primary motor cortex (mo to r control ), andfro ntoinsular cortex (involved in social cognition) (Sherwood and H of 2007). O neparticular type of neuron (CR-ir pyramidal) is fo und in the primary motor and anterior cingu late cortices of botl1 apes and humans, but only humans appear to havethem in tl1e anterior paracingulate cortex (Sherwood and H of 2007). There alsoappea rs to have been a change in the visual pathway in humans, particularly tl1e fibersthat carry informatio n about motion and luminance contrast (Preuss and Coleman2002 ). The behavio ral sig nificance of tl1ese uniquely human attributes - if any - aredifficult to establish at present.FOSSIL REcoRD OF BRAIN EVOLUTIONLarger brains appear to have evolved independently several times in many differentanimal lineages. Birds, for example, are more encephalized than their reptile ancesto rs. The earliest mammals were significantly less encephalized than modern mammals (Jerison 1973). Delphinids (dolphins and killer whales) have some of the largestrelative brain sizes amon g all living mammals, yet tl1eir closest relatives among terrestrial mammals are relatively small-brained artiodactyls (Jerison 1973; Murphy et al.2004). Relative brain size in botl1 carnivores and ungulates have increased since thePaleogene, with carnivore relative brain size o utpacing tl1at of ungu lates in each majo rgeologic time period (Jerison 1973), presumably representing some sort of cognitiveevolutio nary arms race.T he earliest primates resemble modern prosimians, and date back to the earlyEocene (approximately 55-50 Ma; Fleagle 1999; see Silcox, this volume, C hapter18). There are three species from tl1is time period for which brain size and body sizehas been estimated, Tetonius homunculus, Sntilodectes gracilis and Adapis pa1·isiensis(Radinsky 1977). At 1-5 cc, Tetonius homunculus had a brain slig htly smaller than thatof the smallest-brained living primate, the mouse lemur (Microcebtts mm·inus), eventllo ug h it probably weighed about tl1ree times as much (Radinsky 1977; Stephanet al. 1981 ). Both Smilodectesgracilis and Adapis parisiensis had brains within therange of m odern primates, but appeared to have had sig nificantly larger body sizesthan any living primate with similar sized brains (Figure 8.1a, Table 8.1). These EarlyEocene primate specimens thus had lower EQs than any modern primate (about halfthe size of modern mammals). Thus, it appears that brain size increased sig nificantlyin the primate lineage as a \.vhole over tl1e past 50-55 Ma. Witl1 respect to brainmorphology, these early primates appear similar to early mammals in having only tl1elateral sulcus (or Sylvian fissure; Radinsky 1977; Szalay 1969).Relative brain size appears to have further increased in botl1 platyrrhines (New Worldmo nkeys) and catarrhines (Old World mo nkeys, apes and humans) independently.
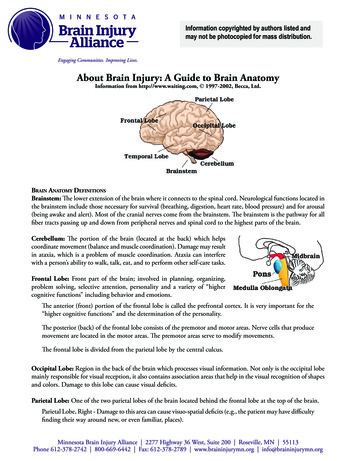
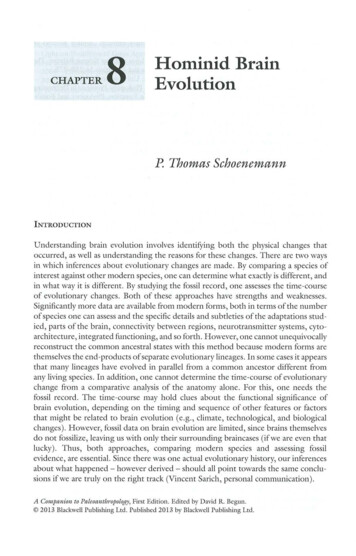
.,:.(a) .,.1000fo.lt.Rudapithecus . . 10 Homo sapiens sapiensHomo sapiens neanderthalensisHomo heidelbergensisHomo erectuso Homo ergastero Homo rudolfensiso Homo habilis. Gracile australopithecine"' Robust australopithecine"' Ardipithecus ramidus Oreopithecus Rudapithecus Proconsulo Aegyptopithecus zeuxisc Parapithecus grangerio Fossil prosimiano Extant Homo sapiens Extant hominoid Extant cercopithecoido Extant Platyrrhinio Extant Prosimii- Average primate-- Average mammal1 ------------------ ---------------------10100010010000100000Body size (g)(b)1800. l. g!qa . -s: . . . . c . . ·:. .li"'. 00160000 0o0140001200 i!'·u 1000()·c: (.). . . ., 00 , . "'a."'(ij0A 800600 0400sA" 4 '\0ao"adla0 a ai ()D 0 . 00D0Paranthropus boise/0Australopithecus alricanus006D 0. ."'a."'n;&/ 0 c.li"'06 0.500Millions of years agoHomohabilisParsnthropus robustusParanthropus aethiopicuso Australopithecus garhioi · 5.000.Homo sapiens sapiensHomo sapiens ldaftuHomo sapiens neanderthalensisHomo soloenslsHomo heidelbsrgensisHomo antecessorHomo erectusHomo georgicusHomo rudolfensisHomo ergaster6DAustrafopithecus afarensisArdipilhecus ramidus 200050.000.0.0500.005A0Kenyanthropus p/atyopsSahelanthropus tchadensis0Oreopithecus06Audapithe :usProconsul Aegyptopithecus zeuxis Parapithecus grangerix Homo floresiensis- Extant Homo sapiens- Extant Gorilla- Exta nt PongoExtant Pan- Extant Hylobates- Extant cercoptthecokf- Extant PlatyrrhlniExta nt Prosimii- Best-fit thlrd-order polynomialFigure 8.1 Evolutio n of cranial capacity. (a) Cranial capacity vs. body size in modern andfossil primates. Data from Table 8. 1. Average mammal: cranial capacity (cc) 0059(body massg)0 76 (based on Martin 1981 ); average primate: cranial capacity (cc) 0087( body mass g)0 77(data from Stephan et al. 198 1). (b) Evolution of primate cranial capacity. Data from Table 8 .2.Best-fit third -order polynomial of anthropoids through Homo sapiens sapiem, excluding robustaustralopithecines (Pamnthropus aethiopictts, P. boisei, and P. robustus) and immature specimens:cranial capacity (cc) 76 814(1og Ma )3 - 53 694(1og Ma)2 - 68144(1og Ma) 863 31 ( 1J. 0 90,N 183).
Table 8.1Estimated cranial capacities and body weights for primate fossils.SpecimenPutative taxonLocationAge e"SattrcesAMNH4194YPM 12152 & USNM 17997BM 20192 & AMNH 11045Cambridge M.538YPM 18302UT 40688-7Tetonius homtt1lCttlusSmilodectesgracilisAdapis parisiensisAdapis parisiensisNecrolemur tmtiqttusRooneyia viejaensisUnited StatesUnited StatesFranceFranceFranceUnited States5552-552-552-537-5331-59 -59-08-84-47-51602540254020003005001; date: 21311CGM 40237CGM 85785Aegyptopithecus zettxisEgyptEgypt29-521-26403body: 4; brain: 529-514-62512DPC 18651KNM-RU 7290RUD77RUD 200BAC-208TM 266- 01 -060-1ARA-VP-6/500KNM-Wf 40000Parapithecus cusSahelanthropus tchadensisArdipithecus ramidttsKenyanthropus Kenya33189 -859-8586-54-43-5AL 162-28AL 288-1AL 333-105AL 333-45AL444-2Dikika l-1Australopithecus afarensisAttstralopithecus afarensisAttstralopithews afarensisAttstralopithecus afarensisAttstralopithectts afarensisAttstralopithecus 400-450400387400492550275-300KNM-Wf 17000KNM-ER406KNM-ER407Paranthropus aethiopicusKenyaKenyaKenya2-54 1037,6661-5l-8550051069,843Aegyptopithecus zettxisParamhropus boiseiParanthropus boiseilbody: 4; brain: 5299516,00025,45021,10015,000674; date: 84; date: 8450,000910; 1112juvenile12
KNM-ER732KNM-WT 13750Konso (KGA-10-525 )OH5SK54SK859SK 1585Paranthropus boiseiPat·anthropus boiseiParanthropus boiseiParanthropus -41·847554552057,603Paranthropus robustusParanthropus robustusParanthropus robustusSouth AfricaSouth AfricaSouth Africa1·51·51·5500450530MLD 1MLD 37/38Sts 5Sts 19/ 58Sts 60Sts 71Stw 505TaungType 2Bouri (Bou-VP-12/130 )A ustralopithecus africanusAustralopithecus africanusA ustralopithecus africanttSAustralopithecus africamtsAustralopithecus africanusAustralopithecus africanttsAttstralopithecus africanusA ustratopithecus africanttsAustralopithecus africanusSouth AfricaSouth AfricaSouth AfricaSouth AfricaSouth AfricaSouth AfricaSouth AfricaSouth 0KNM-ER 1805KNM-ER1813OH7OH 13OH 16OH24Homo habilisHomo habilisHomo habilisHomo habilisHomo habilisHomo NM -ER3733KNM-ER3883KNM -ER1470KNM -ER 1590Homo ergasterHomo ewasterHomo ewasterKenyaKenyaKenya1-881·781-57750848804Homo rztdolfensisHomo 27,85026,638juvenjJe34,88330,28659,20057,45845 ,597(continued)
Table 8.1(cont)d)SpecimenPutative taxonDmanisi D2280Homo gem;gicusDmanisi D2282Homo georgiettsDmanisi D2700Homo geo1:!JiettsBuia (UA 31)Daka (Bou-VP-2/66)HexianKNM-ER 42700 (IIIeret)KNM-WT 15000(Nariokotome Boy)Lantian (Gongwang 1)Nanjing (Hulu Cave) 1NarmadaNgawiOH 12OH9SaleSambungmacan 1Sambw1gmacan 3Sambungmacan 4Sangiran 2Sangiran 3Sangiran 4Sangiran 10Sangiran 12Sangiran 17Sangiran IXTrinil 2HomoHomoHomoHomoHomoLocationAge (Ma)Cranialcapacity(cc)Bod)'mass (g)"Developmentalagt!'Smtrce.fRepublic ofGeorgiaRepublic ofGeorgiaRepublic ·78- 1-01·00-4121-551· 5750-800995102569190013H omo erectttsH omo erectusHomo erectusH omo erectusHomo erectusHomo erectusHomo erectusH omo erectusH omo erectusH omo erectusHomo erectusH omo erectusHomo erectusH omo erectusHomo erectusHomo erectusHomo erectttsHomo 0- 0908855105910048459400 ·78- 1·21·40-240·80-40·81·51·01·61-21·11· 31-1-1-40-91459,93915immaturedate: 13date: 13date: 1376,062date:date:date:date:1313131313
Yunxian (1 and 2 )Zhoukoudian (Z 11)Zhoukoudian I, L (Z 10)Zhoukoudian III, E (Z 2)Zhoukoudian III, L (Z 12)Zhoukoudian VHomo erectusHomo erectusHomo erectusHomo erectusHomo erectusHomo 580-420-312001015122591510301140Atapuerca (Sima de losHuesos) 4Atapuerca (Sima de losHuesos) 5Atapuerca (Sima de losHuesos) 6Homo antecessorSpain0-530- 0-6001390date: 13date: 13date: 13date: 1313date: 16Homo antecessorSpain0-530- 0-6001125date: 16Homo antecessorSpain0-530- 0-6001140date: 16Ngandong (Solo IX)Ngandong 1 (Solo I)Ngandong 6 (Solo V)Ngandong 7 (Solo VI)Ngandong 13 (Solo X)Ngandong 14 (Solo XI )Arago 21BiacheBodoCepranoDali 1EhringsdorfJinniushanKabwe (Broken Hill )Le LazaretNdutuPetralonaHomo soloensisHomo soloensisHomo soloensisHomo soloensisHomo soloensisHomo soloensisHomo heidelbewensisHomo heidelbewensisHomo heidelbergensisHomo heidelbergensisHomo heidelbewensisHomo heidelbewensisHomo heidelbcwensisHomo heidelbergensisHomo heidelbergensisHomo heidelbergensisHomo reece0-143-0-5460-143- 0-5460-143- 0-5460-143-0-5460-143- 0-5460-143- :51,79665,649202020202020date: 12117,236taxon: 13taxon: 13118,890child12(continued)
Table 8 .1(com d)SpecimenPutative taxonLocationAge (Ma)Cranialcapacity(cc)ReilingenSaldanha (Elandsfontein)SaleSteinheimSwanscombeHomo heidelbergensisHomo heidelbergensisHomo heidelbergensisHomo heidelbergensisHomo heidelbergensisGermanySouth 1430122588012001325Amud 1Dederiyeh 1Dederiyeh 2Engis 2FeldhoferGanovceGibraltar (Devil's Tower)Gibraltar (Forbc's Quarry)Jebel Irhoud 1Jebel Irhoud 2Krapina 3 (Cranium C)Krapina 6 (Cranium E)Krapina BLa Chapelle aux SaintsLa FerrassieLa Quina 18La Quina 5Le MoustierMonte Circco (Guattari 1)NeanderthalHomo sapiens neanderthalcnsisHomo sapiens neanderthalensisHomo sapiens neanderthalcnsisHomo sapiens neanderthalensisHomo sapiens neanderthalensisHomo sapiens neanderthalcmisHomo sapiens neanderthalensisHomo sapiens neanderthalensisHomo sapiens neanderthalensisHomo sapiens neanderthalensisHomo sapiens neanderthalcmisHomo sapiens neanderthalensisHomo sapiens neanderthalensisHomo sapiens neandeHhalensisHomo sapietH neanderthalensisHomo sapiens neanderthalemisHomo sapiens neanderthalensisHomo sapiens neanderthalmsisHomo sapiens neanderthalensisHomo sapiens 01255120514501625164012001172156513601525Bodymass (g) Developmentalagi!'Sources 1260,51384,481infantinfantchild121212date: 12child93,43280,481100,23799,507child81,190
Pech de L'AzcRoc de MarsalSaccopastore 1Saccopastore 2Shanidar 1Shanidar 5Skhul1Skhul4Skhul 5Skhu l 9Spy ISpy IITabun 1Teshik- TashHomo sapiens neanderthalensisH omo sapiens neanderthalmsisHomo sapiens neanderthalensisHomo sapiens neanderthalensisH omo sapiens neanderthalensisHomo sapiens neandcrthalensisH omo sapiens neanderthalensisH omo sapiens neanderthalensisHomo sapiens neanderthalensisH omo sapiens neanderthalensisH omo sapiens neanderthalensisHomo sapiens neanderthalensisHomo sapiens neanderthalensisH omo sapiem elIsraelIsraelIsraelBelgiumBelgiumIsraelUzbekistan 0·103 0·0680·070- 0·0800 5312711525Herro l/16Abri Pataud 1Arcnc Candide 1Homo sapiens idaltuHomo sapiens sapiensHo mo sapiens sapimsEthiopiaFranceFrance0·160 ·0220·023145013801414Arcne Candide 2Homo sapiens sapiensFrance0·0231424Arenc Candide 4Homo sapiens sapimsFrance0·0231520Arene Candide 5Homo sapiens sapiensFrance0·0231661Border CaveBrnoiBrnoiiBrno IIIBruniquel 2Homo sapiens sapiensHomo sapiens sapiensHomo sapims sapimsHomo sapiens sapiensHomo sapiens sapimsSouth AfricaCzech RepublicCzech RepublicCzech 3041555juvelineinfant121266,57370,166date: 12childdate: 12date: 12; cranialcapacity: 17date: 12; cranialcapacity: 17date: 12; cranialcapacity: 17date: 12; cranialcapacity: 1779,551(continued)
Table 8.1(cont)d)SpecimenCap Blanc 1ChanceladeCombe CapelleCoobol CreekCro-Magnon lCro-Magnon 3Dolni Vestonice 3Dolni Vestonice 14Dolni Vestonice 18Dolni Vestonice 20Dolni Vestonice 21Grone des Infants(Grimaldi) 4Grotte des Infants(Grimaldi ) 5Grone des Infants(Grimaldi ) 6KeilorKNM-ES 11693 (EliyeSprings)Kostenki 14Kostenki 2Laetoli 18LiujiangMinatogawa 1Minatogawa 2Minatogawa 4Putative taxonLocationAge il'Sot rces Homo sapiens sapiemHomo sapiens sapiensHomo sapiens sapiensHomo sapiens sapiensHomo sapiens sapiensHomo sapiens sapiensHomo sapiens sapiensHomo sapiens sapiensHomo sapiens sapiensHomo sapiens sapiensH omo sapiens sapiensHomo sapiens h RepublicCzech RepublicCzech RepublicCzech RepublicCzech 90128515381481154713781775Homo sapiens sapiensItaly/France0-0281375H omo sapiens sapiensItaly/France0-0281580date: 17Homo sapims sapiensHomo sapiens sapiensAustraliaKenya0-0120-20-0-301497 13001218H omo sapiens sapiensHomo sapiens sapiensHomo sapiens sapiensHomo sapiens sapiensHomo sapiens sapiensHomo sapiens sapiensHomo sapiens 90date: 121259,407date: 1740,405date: 17taxon: 12
Mladec 1Mladec 2Mladec 5Nazlet Khater 2Obercassel 1Obercassel 2Omo 2 (Kibbish)Pavlov 1Predmosti 3Predmosti 4Predmosti 9Predmosti 10Qafzeh 6Qafzeh 9Qafzeh 11San Teodoro 1San Teodoro 2San Teodoro 3San Teodoro 5San Teodoro 7Singa 1St. Germain-la-RivieSungir 1Sungir 2Sungir 3Sw1gir 5Veyrier 1Wadjak 1Wadjak 2Homo sapiens sapiensHomo sapiens sapiensHomo sapiens sapiensHomo sapiens sapiensHomo sapiens sapiensHomo sapiens sapiensHomo sapiens sapiensHomo sapiens sapiensHomo sapiens sapiensHomo sapiens sapiensHomo sapiens sapiensHomo sapiens sapiensHomo sapiens sapiensHomo sapiens sapiensHomo sapiens sapiensHomo sapiens sapiensHomo sapiens sapiensHomo sapiens sapiensHomo sapiens sapiensHomo sapiens sapiensHomo sapiens sapiensHomo sapiens sapiensHomo sapiens sapiensHomo sapiens sapiensHomo sapiens sapiensHomo sapiens sapiensHomo sapiens sapiensHomo sapiens sapiensHomo sapiens sapiensCzech RepublicCzech RepublicCzech RepublicEgyptGermanyGermanyEthiopiaCzech RepublicCzech RepublicCzech RepublicCzech RepublicCzech RepublicIsraelIsraelIsraelItalyItalyItalyItalyI 391650date: 12date: 1275,3 1364,625adolescent12date: 17date: 17date: 17date: 1717date: 17date: 171717(continued)
Table 8.1(cont d)SpecimenPuta
Hominid Brain Evolution P Thomas Schoenemann Understanding brain evolution involves identifying both the physical changes that occurred, as well as understanding the reasons for these changes. There are two ways in which inferences about evolutionary changes are made. . itself, to judge w