Transcription
Chapter 5Subcritical MultiplicationRyan Schow
OBJECTIVES1. Define subcritical multiplication.2. Describe primary and secondary neutron sources,critical loading experiment, and addition of a neutronsource to a critical reactor.3. Plot inverse multiplication versus keff or fuel mass andexplain the possible curve shapes.4. Solve problems involving subcritical count rates, corereactivity, and rod worth.4. Explain how doubling count rate during a startup canbe used by the operator to predict criticality.
NEUTRON ICINSTALLED -n -n S.F. Primary Secondary
PHOTO-NEUTRON REACTION H H 2100 11H H 2121*10n H n1110
ALPHA-NEUTRON REACTION42He O Ne n188211010 O Ne n42188211010
INTRINSIC NEUTRON SOURCERELATIVE STRENGHTSImmediately following a reactor shutdown:1.Photo-Neutron Sources2.Alpha-Neutron (Transuranic) Sources3.Spontaneous Fission SourcesSeveral weeks following shutdown:1.Alpha-Neutron (Transuranic) Sources2.Spontaneous Fission Sources3.Photo-Neutron Sources
INSTALLEDNEUTRON SOURCES1235112451Sb 01 n 12451 Sb 12452Sb Te 0-1 94 Be 84 Be 10 ne
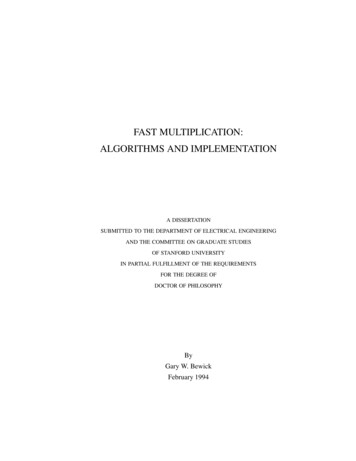
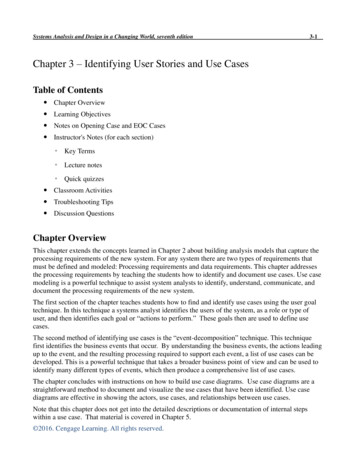
NUMBER OF NEUTRONSSUBCRITICAL MULTIPLICATIONkeff 0.9520001500keff 0.901000keff 0.85666500keff 0.803173100139GENERATIONS200274300
SUBCRITICAL MULTIPLICATIONWITH keff 0.80Generation Neutrons SourcefromFission 64319510029551423610033641-----n4001005000
SUBCRITICAL MULTIPLICATIONWITH keff 0.85Generation Neutrons SourcefromFission 54621346410056418447910057915-----n5661006660
SUBCRITICAL MULTIPLICATIONWITH keff 0.90Generation Neutrons SourcefromFission 73030365710075727468110078124-----n9001001,0000
NEUTRON POPULATION 1 k eff n Nn So 1 keff 1 Nt So 1 k eff Where:Nn number of neutrons present after n generationsSo source strength in neutrons per generationkeff effective multiplication factornnumber of generations Nt the total number of neutrons present at equilibrium
Assume keff becomes insignificant when keff is equal to0.001. Determine the number of generations required forkeffn to equal 0.001 when keff is 0.85 and 0.95:k eff 0.001nn ln k eff ln 0.001 (Take natural log of both sides)ln 0.001n ln k effWhen keff 0.85ln 0.001n 43 generation sln 0.85When keff 0.95ln 0.001n 135 generation sln 0.95
EQUATIONS0 (1- k eff ) NSoN 1 k eff
ROLE OF SOURCE NEUTRONSNeutronslost in cycle(1-keff)NNeutron LifeCycleNeutronsat Beginning of CycleSourceStrengthNeutron from Fissionat End of Cycle
Assume that Reactor A has a keff 0.8 and a neutron sourcestrength of 100 neutrons/ generation. Reactor B, which alsohas a keff 0.8, has a neutron source strength of 200neutrons/generation. Of the two reactors described, which onehas the larger equilibrium neutron population?Solution:Nt A 1 Nt So 1 k eff 1 100 500 1 0.8 1 Nt B 200 1,000 1 0.8
EQUATIONS0 (1- k eff ) Nt
A nuclear power plant that has been operating at rated powerfor two months experiences a reactor scram. Two months afterthe reactor scram, with all control rods still fully inserted, astable count rate of 20 cps is indicated on the source rangenuclear instruments.The majority of the source range detector output is beingcaused by the interaction of with the detector.A.intrinsic source neutronsB.fission gammas from previous power operationC.fission neutrons from subcritical multiplicationD.delayed fission neutrons from previous power operation
Solution:This question is intended to mislead the student into thinkingthat the different neutron source must be considered. After areactor trip, the keff of the core is still greater than 0.5. Thismeans that more than half of the neutrons in the core, andtherefore those interacting with the Source Range NI’s willhave come from fission of fuel.C. is the correct answer.
COUNT RATECR Nt hCR neutron count rate indicated on the detector meterNt actual neutron count in the coreh detector efficiency 1 hCR So 1 k eff
COUNT RATE RATIO 1 h1S1 1 k eff 1 CR1 CR2 1 h2S 2 1 k eff 2
COUNT RATE RATIO (cont’d.) 1 CR1 1 k ef f1 CR2 1 1 k ef f2 CR1 1 1 k ef f2 CR2 1 k ef f1 1 CR1 1 k ef f2 CR2 1 k ef f1
COUNT RATE RATIOCR1 1 k eff1 CR2 1 k eff 2 On NRC Equation sheet
Given an initial count rate of 100 cps and a keff 0.9,the operator pulls control rods and establishes a finalcount rate of 200 cps. Determine the new keff.Solution:CR 2 1 k eff1 CR1 1 k eff 2200 1 0.9 100 1 k eff 2200(1 k eff 2 ) 100 1 0.9 1 k eff 210 200k eff 2 1 0.05k eff 2 0.95
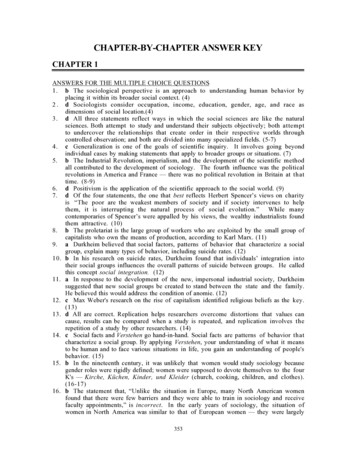
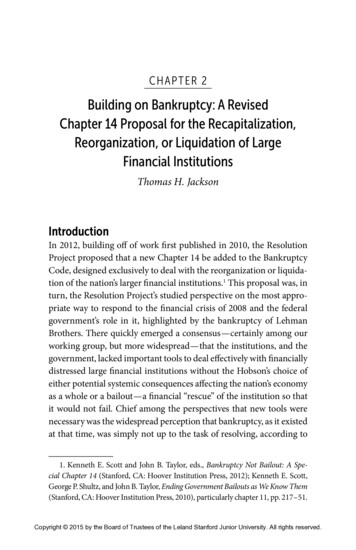
COUNTS VS keff DURING STARTUP400300200100.9.925.95keff.9751
THUMB RULES"HALVING the DISTANCE to CRITICALITYDOUBLES the COUNTS"When reactivity is added to a subcritical reactor in anamount equal to the amount associated with1/2 (1-keff), the count rate will double.
THUMB RULES"CRITICALITY in 5 to 7 DOUBLINGS"When the initial count rate at the beginning of astartup has doubled 5 - 7 times, the reactorwill be at or near critical.
THUMB RULES“FIXED REACTIVITY ADDITIONSversusCOUNT RATE DOUBLING"When enough reactivity is added to the reactorto double the count rate,if the same amount of reactivity is added to thereactor again, the reactor will be supercritical.
A reactor startup is initiated with an initial count rate of100 cps and keff of 0.9.After pulling the control rod bank a total of 200 steps,the count rate has doubled to 200 counts.Assume each step of control rod motion adds the sameamount of reactivity.What would happen if the rods were pulled an additional200 steps?Solution:Reactivity associated with keff 0.9 o k eff 1k eff0.9 1.0 o 0.1111 k / k0.9
After pulling the control rod bank a total of 200 steps:Recall the thumb rule “HALVING the distance toCRITICALITY DOUBLES the COUNTS” can also be seen as“doubling the count rate will half the distance to criticality.”Therefore we can now say that since the count rate wasdoubled we are halfway to criticality.Halfway between 0.9 and 1.0 is 0.95.Reactivity associated with keff 0.95 1 k eff 1k eff0.95 1.0 0.0526 k / k0.95Reactivity added: 1 – o -0.0526 - (-0.1111) 0.0585 k/k
After the rods were pulled an additional 200 steps:Second rod pull adds the same amount ofreactivity, 0.0585 k/k. 2 – 1 2 1 2 0.0585 (-0.0526) 0.0059 k/kk ef f1 1 k ef f1 1.0061 0.0059 k / kThe reactor is supercritical!
A reactor startup is being commenced with initial source(startup) range count rate stable at 20 cps. After a periodof control rod withdrawal, count rate stabilizes at 80 cps.If the total reactivity added by the above control rodwithdrawal is 4.5 % k/k, how much additional positivereactivity must be inserted to make the reactor critical?A.1.5 % k/kB.2.0 % k/kC.2.5 % k/kD.3.0 % k/k
Solution:The easiest way to solve this problem is to use thethumb rule regarding count doublings. We see thatthere have been 2 doublings, from 20 cps to 40 cps andthen to 80 cps.We do not know the amount of reactivity that was initiallynecessary to bring the reactor critical, so we will call that“x”.The first doubling must have added one-half of x. Thesecond doubling added half again as much reactivity(x/4). Thus the total reactivity added to that point is 3x/4.
This means that 4.5 % k/k is ¾ of x.Therefore, quick algebra shows us that x must havebeen 4/3 times 4.5% or 6.0 % k/k.So, we needed 6.0 % k/k but we have already added4.5 % k/k, so the net remaining to be added is:ANSWER 1.5 % k/k.
INVERSE MULTIPLICATIONCRnM CRoWhere:CRn Cro some count rate at a condition “n”initial count rate
RELATIONSHIP OFkeff TO 1/MCR 2 1 k eff1 CR1 1 k eff2k eff1 1 M
INVERSE MULTIPLICATION PLOTCR 2M CR11 CR1 M CR 21 So 100 n / sec 1.0M Nt 100 n / secWhere:So source count rateNt neutrons per second counted at aparticular time
1/M PLOT FOR A FUEL LOADINGA1.0.9B.8.7C.61/M.5D.4.3INVERSE MULTIPLICATION PLOT.2EF.1G0010203040NUMBER OF FUEL ASSEMBLIES LOADED50
1/M PLOT1.01/M0.80.60.40.2100200300400CONTROL ROD NOTCHES WITHDRAWN500
1/M PLOT DURING FUELINGINCORRECT DETECTOR LOCATION1.00.81/M0.60.4OCCURS WHEN:1. FUEL LOADED TOWARD DETECTOR2. DETECTOR INITIALLY TOO FAR FROM CORE3. DETECTOR TOO CLOSE TO SOURCE0.20.002468FUEL ASSEMBLIES LOADED10
1/M PLOT FOR DETECTORTOO FAR FROM SOURCEDETECTOR TOO FAR AWAY FROM SOURCE1.00.81/M0.60.40.20.002468FUEL ASSEMBLIES LOADED10
1/M PLOT FOR APPROACH 4080120 160 200 228B040 80 120 160 200 228C040 80 120 160 200 228D040 80 120 160 200 228ROD HEIGHT (STEPS)
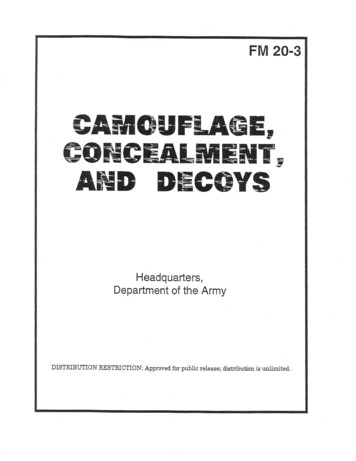
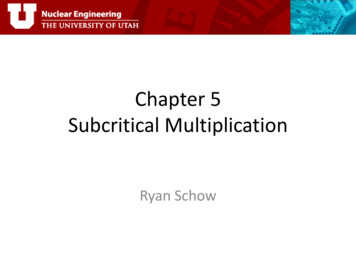
A reactor is taken critical. The data for the approach tocriticality is shown below. Using this data, create a 1/M (orICRR) plot. After you have plotted your graph, refer to thegraphical solution to compare the results.Rod PositionCount Rate0400 cps50500 cps100890 cps1301,290 cps1601,905 cps1803,333 cps2008,000 cps1/M (ICRR)
EXAMPLE 80.450.310.210.120.050.50.40.30.20.10050100150ROD POSITION200230
A reactor startup is initiated with an initial count rate of 100 cps and k eff of 0.9. After pulling the control rod bank a total of 200 steps, the count rate has doubled to 200 counts. Assume each step