Transcription
Analytics
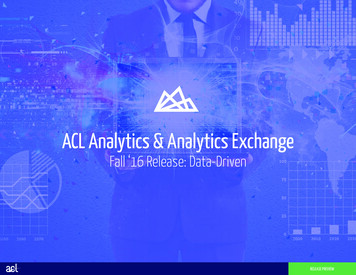
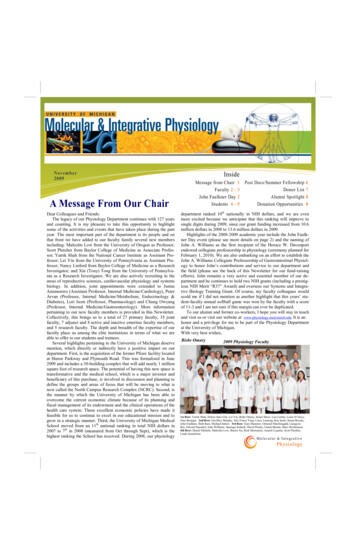
Our global reachmeans you’llhave a globalcareer.112,900 7,700 EMEIAJapan69,700 Americas40,500 Asia-Pacific150countries250kpeople 31.4brevenueFORTUNE’S100 BestCompaniesto Work For 18 yearsPage 2
A better workingworld starts inour service lines: Advisory Assurance Tax TransactionAdvisoryServices (TAS)Page 3Page 3
We are set upto meet ourclients’challenges. CompetenciesPerformance Improvement CustomerFinanceIT AdvisoryPeople & Organizational ChangeProgram ManagementStrategySupply Chain & Operations We focus on a variety of industries, including, but not limitedto:Risk Actuarial ServicesFinancial Services Risk ManagementInformation SecurityInternal AuditRisk AssuranceRisk TransformationSectorsAdditionally, we have built a dominant position and focus onfinancial services through our Financial Services Office (FSO). Automotive Mining & Metals Banking & Capital Markets Cleantech Oil & Gas Wealth & Asset Management Consumer Products Power & Utilities Insurance Government & Public Sector Private Equity Health Care Real Estate Life Sciences Technology Media & Entertainment Telecommunications
EY’s Analytics PracticeAround 400 Analytics practitioners in the US in 40 different offices around the country.DnA PracticeAnalyticsAdvanced analyticsAdvanced techniques, models and statisticalmethods to drive improvementDataInformation managementOur Analytics competency group helps clientsmanage and use data, statistical and quantitativeanalysis, explanatory and predictive models andfact-based management to help improve businessperformance, drive better business decisions andproactively manage risk.Page 5DigitalCollect, protect anddistribute structured and unstructureddataHolistic approach to digital transformation buildingcapabilities as well as technologies.Example service offerings: Analytics and big data strategy Information infrastructure Information management Analytics governance
Analytics
Driving performance improvement, value generation & executionexcellenceDoing analytics on what matters Business led – starting with questions that matterManaging analytics as a portfolio as opposed to discrete projectsMaking connections between and within functional silosFostering unity, clarity and efficiency between the business and ITImproving business performance Illuminating key performance drivers to align strategy and executionCreating more insight to drive execution, with less need to view detailUsing agile delivery for clearer focus on end user requirements and fasterdeliveryShaping a culture of fact-based decision making Page 7Applying leading practices and models to solve business issuesIncreasing innovation and value additionOptimizing information and tools that already existEncouraging collaboration through the change
Strategic FocusWe combine what is technically possible with the commercial ‘know how’ to create valueRules/AlgorithmsFocus of many companies Many of analytics companies in the marketplace todayare dominated by data warehousing, dashboard &reporting solutions.Many clients are not realizing the full value of analyticsas they struggle to systematically integrate analyticsinto operational decisionsPage 8EY’s strategic focus Our focus is on becoming the leader in “value-drivenanalytics” We fully appreciate the importance of changemanagement and are well positioned to help our clientsmore effectively use analytics to create value.
Analytics DefinedAnalytics, is NOT just ReportsAnalytics isthe use of data, statistical andquantitative analysis, explanatoryand predictive models, and factbased management to drivedecisions and actions within anorganization to create strategicvalue.And it is not just a Data WarehouseAnalytics is business driven and technology enabledPage 9
Analytics SpectrumAdvanced analyticsPage 10
Legacy practices in financial forecasting are not meeting the needs oftoday’s CFOsLegacy practicesToday’s needs Heavy use of spreadsheets to collect forecast data Improved forecast accuracy and timeliness Dozens or even hundreds of analysts providingforecast assumptions at a detailed/granular level Ability to rapidly change assumptions (what-if modeling) Ability to respond quickly to management requestsTime-consuming processes to change forecastassumptions for what-if modeling Removing human bias from the forecast Forecasts influenced by personal and organizationalbiases Ability to incorporate diverse data sources for a moreholistic view of the business (e.g., social media) Reliance on a limited number of internal data sourcesas inputs to the forecast Visibility into the causes (drivers) of variances Forecast horizons not extending past fiscal year end Rolling forecasts with up to an 18 month time horizonPage 111
Analytics can address the inherent biases and limitations in traditionalforecastsAn analytics-drivenapproach toforecastingeliminates thebiases inherent inmanual forecasts,while minimizingforecast errors andprocessinefficiencies. Inaddition, the richnessof the forecast modelcan be enhanced byincorporating diversedata sources,includingunstructured andexternal data.Page 12ImprovedaccuracyImprovedefficiencyFewer peoplerequired toinput forecastassumptionsPre-populationwith machinelearning allowspeople to focuson exceptionsQuicklyidentifies ssumptionscan be doneinstantaneously1
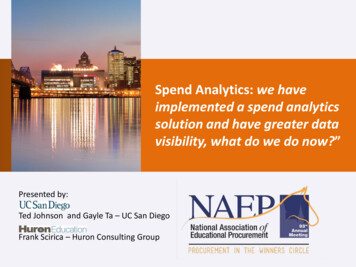
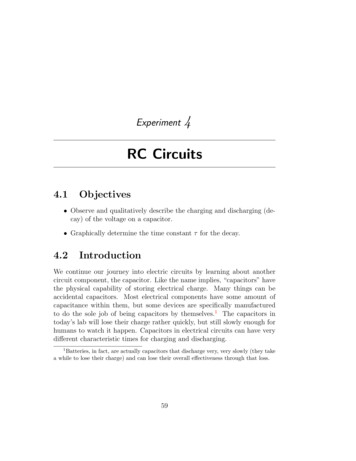
EY assisted a Truck OEM to improve their revenue forecast accuracy and timing bycoupling advanced statistical forecasting models with process expertise Actual units for fiscal years 2012 through 2015 at a business unit level were used to develop the predictive forecastmodelThe objective of the predictive forecast model was to forecast revenue units on a rolling 6 month basisIn order to test its accuracy, the model was used to estimate monthly revenue units throughout fiscal year 2016Objective: Improve AccuracyForecast ComparisonUnitsForecastAverage MonthlyAbsolute ErrorCurrent Forecast25%26%Predictive Forecast2%8%Error is defined as (forecast – actual) / actual MonthObjective: Enhance TimingJFM AMJJASOND FST1FST2 Period ForecastedPage 13AverageMonthly ErrorForecast Model Timing – requiresprior month actualsThe predictive forecast model reduced forecast bias, bringing theaverage error down from 25% to 2% for the company total revenueforecastFurther, the predictive model significantly reduced the absoluteerror, proving the reliability of the model on a month-to-monthbasisThe predictive forecasting model can generate a forecast as soonas prior month actuals are obtainedThe forecast model was developed to enable a rolling forecast, notconstrained by the fiscal yearCoupled with process enhancements, EY was able to identify up to3 weeks in cycle time reduction1
Dealer Risk Management Case Study2Predicting fraudulent transactionsSituation: INTERNAL AUDIT was interested in improving theefficiency and effectiveness of their dealership audits byleveraging advanced analytics and predictive modeling to focusefforts on high risk dealerships and transactions.Value Delivered Improved the exception identification rate by 4x through predictivemodeling techniquesDelivered over 80% accuracy in the aggregated percentage ofprojected to actual recoveriesNear real-time analysis and reporting allowed for rapid identification ofemerging issuesIdentified opportunities to deliver value to the business throughmarketing effectiveness of incentive programs and warranty costreductionEnabled business to assess risk for 100% of all claims vs. randomsampling approach that typically covered 1% of populationApproach & Description: Bringa team of EY Advanced Analytics and Risk professionals togetherto co-develop the solution with IA SMRs Rather than a rules based approach, focus on behavioral indicators thatwould identify transaction abnormalities based on numerousdimensions including local demographics, peer-group comparisons, andproduct comparisons Develop predictive model using historical audit results (pass/fail) toenable scoring of 100% of transactions Focus on-site dealership audits to those dealerships with the highestaggregated risk and cost/benefit of audit. Leverage mail audits forothers to cover 100% of identified high risk transactions. Validate modeling approach and accuracy with CLIENT to assist inchange management and adoption Perform root cause analysis on audit findings and work with Sales &Marketing as well as Warranty Management to reduce CLIENT Risk &Exposure and refine processesPredictiveModeling and DataVisualizationHelped PlanDealership AuditsPage 14Identify SpecificBehaviors at EachDealership DrivingIncreased Risk Scoresin Predictive ModelEY Confidential - For Discussion Purposes Only
A department desired to improve their resource planning process and alignwith company wide strategic changesProblem ComplicationsResource planning was subjective and not programspecific, leading to large error in program estimatesResource planning: Current resource estimate wasbased off of a fixed percentage of total company budgetFacility planning: To estimate facility needs, facilitymanagers attempted to obtain estimates of asset needsfrom individual program managers Limited data points were available due to the longproject completion time (2-5 years)Program attributes change over time and aremaintained in disparate spreadsheets andSharePoint sitesLarge variation in program durations and attributesInconsistencies in time keeping practices acrossregionsSolutionA physicals based model was developed to estimate and calendarize total program Headcount and Facility needs for an individual program Resource planning: A total resource model was developed using linear regression techniques. The total resource needs are thenplanned for over a predicted program calendar curve Facility planning: Total facility occupancy model was developed to estimate asset utilization needs. A dynamic calendar curve that relieson behaviors of prior period activities was developedPage 153
The resource planning model produced unique program estimates basedon the programs physical attributesModel ApproachSolution Overview Total resource hours needed over thelife of the program can be estimatedbased on program physicalsThe output of this model is thendistributed across resource roles,geographies, etc. and is distributedover the predictied life of the program To account for the small samplesize available an ensemblelinear regression model wasused to estimate total headcountDecision trees and linearregression models were used todetermine the shape of thecalendar curveResource RoleAllocation andCalendarizationActual Program HoursPage 16 This model resulted in a unique calendarcurve for each program and accounted forthe differences in roles, responsibilities, andtime keeping practices between regionsThe model improved portfolio accuracy by10x (from 17% to 1.7%) and reduced theaverage absolute error per program by - 27,000 hoursProgram Lifetime EstimateTotal Resource ModelPredicted Program Hours Outcome3
AnalyticsCareers
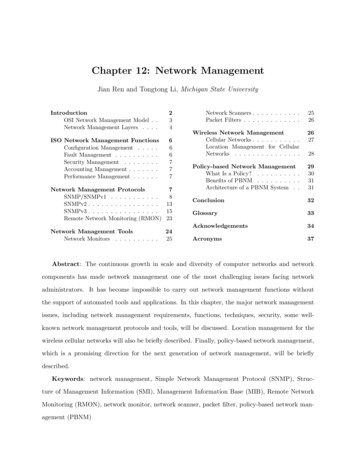
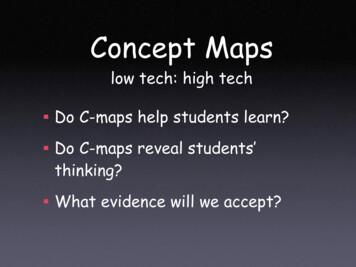
Why go into a career in Analytics? DataScientist / Analytics Role #1 Job in AmericaIn a survey by Glassdoor, thedata scientist/analytics role wasvoted the best job in Americafor 2016Page 18Analytics is more popular now thanever before, hence we are seeingsignificant investments being madeinto this space by leading fortune 500clients2007 – 2011 saw rapid increase insearches related to Analytics, post2012 the searches have consistentlyplateaued due to continued demand
High Demand for AnalyticsGlobal Analytics Survey – EY & Forbes did a joint survey across F500 companiesPercentage of global companiesthat agree Big Data & Analyticsare changing the nature ofcompetitive advantage?78%Percentage of global companiesthat are investing 5m inanalytics?66%Percentage of organizations thatdescribe their analytics maturity asleading?12%*Forbes Insights and EYPage 19
Roles driving contemporary analytics capabilitiesDrive innovation and incubation of business questionsStrengths ActivitiesStorytelling (new possibilities)Very strong communicationsStrong understanding ofanalytics (descriptive, diagnostic,predictive and prescriptive) Data Wrangling (bringing togetherdisparate sets of data)Data MiningProgrammingStatistics / Mathematics Storytelling (visualizing the future)Data VisualizationData WranglingStrong communications Lead workshops to facilitate the art of the possibleBuild the analytics portfolioConnect dots across initiativesBuild relationships with key stakeholdersDrive the cultural transformationAnalytics Evangelist Pull together data from disparate systemsSolve business problems / hypotheses with data and advancedanalytical capabilitiesLeverage technology to semi-automate capabilitiesDrive data discovery effortsData Scientist Data DesignerPage 20Pull together data from disparate systemsSolve business problems / hypotheses with data andvisualization capabilitiesHold design sessions with the businessConstruct intuitive visual representations
Roles driving traditional IT analysis/delivery capabilitiesDrive industrialization and sustainment of IT solutionsStrengths ActivitiesStrong communication skillsDeep understanding ofbusiness processesRequirements gathering Data VisualizationData ProfilingDatabase queryingFunctional knowledge Collaborate with the business on functional requirementsAdvocate for the business during development cyclesPerform testingDriving change management and training effortsBusiness Analyst Data Analyst Data IntegrationMaster Data Management orGovernance Conduct profiling, standardization and harmonization to collectbusiness rulesQuery data to identify patterns and/or anomaliesPerform triage to questions and/or issuesSupport testing effortsDrive data integration, data management and data qualityinitiativesLead governance frameworkLeverage technology to cre
EY’s Analytics Practice Our Analytics competency group helps clients manage and use data, statistical and quantitative analysis, explanatory and predictive models and fact-based management to help improve business performance, drive better business decisions and proactively manage risk. Example service offerings: Analytics and big data strategy