Transcription
MHSPHP Metrics ForumACG and Health Services
Overview What is ACGACG RUB and ACG IBIUnderstanding PHDR reportsHow to use the PHDR reports with populationmanagement How to use the Health Services report tointerpret PHDR data Questions2
What is this ACGstuff anyway?3
Background Grew out of Dr. Barbara Starfield’s research hypothesis:Clustering of morbidity is a better predictor of health servicesresource use than the presence of specific disease Conceptual Basis:Assessing the appropriateness of care needs to be based onpatterns of morbidity rather than on specific diagnoses–––––Developed by the Johns Hopkins School of Public HealthA ‘person-focused’ comprehensive family of measurement toolsAdopted by 200 healthcare organizations world-wideCase-mix adjust more than 20 million covered livesMost widely used & tested population-based risk-adjustment system4
ComponentsDiagnosis-based markersPatientDataPharmacy-based markersHospital dominantconditionsMedicalServicesACGToolsFrailty markersPredictive modelingPharmacyDataCare coordination markersPharmacy adherencemarkersData AnalysisInput5Output
ACG: Adjusted Clinical GroupsManagement applications for population-basedcase-mix adjustment require that patients begrouped into single, mutually exclusivecategories. The ACG methodology uses abranching algorithm to place people into one of93 discrete categories based on their assignedADGs, their age and their sex. The result is thatindividuals within a given ACG have experienceda similar pattern of morbidity and resourceconsumption over the course of a given year.
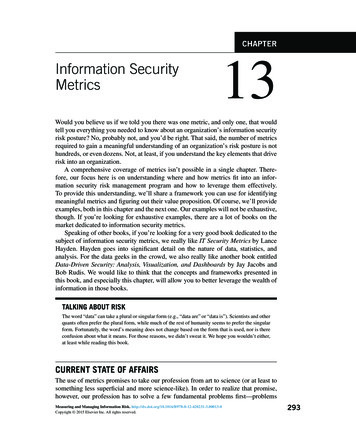
Diagnosis-based markers:Morbidity viewBased on Duration Severity Diagnostic Certainty Etiology Specialty Care Frequentlyoccurringcombinations ofCADGs Based onpatterns of CADGHigh expected resource use ADGs: Pediatric AdultCollapsed based on: Likelihood of persistence /recurrence Severity Types of healthcare services required16ICD-9 20,000MajorADGADGCADG32Based on: Age Sex Specific ADG # of major ADG # of ADG 100ACGMACIndividuals with similar: Needs for healthcareresources ClinicalcharacteristicsOne value per person2612ADGICD-9Major ADG (Adult)ACGTime limited: majorAppendicitisTime limited: majorAcute minor / likely to recur, age 6 , w/o allergyLikely to recur: discreteGout, BackacheLikely to recur: progressivePregnancy, 2-3 ADGs, no major ADGsLikely to recur: progressiveDKAChronic medical: unstable4-5 other ADG combinations, age 45 , 2 major ADGsChronic medical: stableDM, HTNChronic specialty: stable - ENT6-9 other ADG combinations, male, age , no major ADGsChronic medical: unstableHTN renal diseasePsychosocial: persistent/recurrent,Infants: 0-5 ADGs, no major ADGs, low birth weightInjuries/adverse effects: majorIntracranial injuryMalignancyChronic specialty: stable7
ADG:Aggregated Diagnosis GroupPts may be assigned to Multiple ADGs
Diagnosis-based markers:Morbidity viewBased on Duration Severity Diagnostic Certainty Etiology Specialty Care Frequentlyoccurringcombinations ofCADGs Based onpatterns of CADGHigh expected resource use ADGs: Pediatric AdultCollapsed based on: Likelihood of persistence /recurrence Severity Types of healthcare services required16ICD-9 20,000MajorADGADGCADG32Based on: Age Sex Specific ADG # of major ADG # of ADG 100ACGMACIndividuals with similar: Needs for healthcareresources ClinicalcharacteristicsOne value per person2612ADGICD-9Major ADG (Adult)ACGTime limited: majorAppendicitisTime limited: majorAcute minor / likely to recur, age 6 , w/o allergyLikely to recur: discreteGout, BackacheLikely to recur: progressivePregnancy, 2-3 ADGs, no major ADGsLikely to recur: progressiveDKAChronic medical: unstable4-5 other ADG combinations, age 45 , 2 major ADGsChronic medical: stableDM, HTNChronic specialty: stable - ENT6-9 other ADG combinations, male, age , no major ADGsChronic medical: unstableHTN renal diseasePsychosocial: persistent/recurrent,Infants: 0-5 ADGs, no major ADGs, low birth weightInjuries/adverse effects: majorIntracranial injuryMalignancyChronic specialty: stable9
Major ADGs Identify ADGs that have very high expectedresource use
Diagnosis-based markers:Morbidity viewBased on Duration Severity Diagnostic Certainty Etiology Specialty Care Frequentlyoccurringcombinations ofCADGs Based onpatterns of CADGHigh expected resource use ADGs: Pediatric AdultCollapsed based on: Likelihood of persistence /recurrence Severity Types of healthcare services required16ICD-9 20,000MajorADGADGCADG32Based on: Age Sex Specific ADG # of major ADG # of ADG 100ACGMACIndividuals with similar: Needs for healthcareresources ClinicalcharacteristicsOne value per person2612ADGICD-9Major ADG (Adult)ACGTime limited: majorAppendicitisTime limited: majorAcute minor / likely to recur, age 6 , w/o allergyLikely to recur: discreteGout, BackacheLikely to recur: progressivePregnancy, 2-3 ADGs, no major ADGsLikely to recur: progressiveDKAChronic medical: unstable4-5 other ADG combinations, age 45 , 2 major ADGsChronic medical: stableDM, HTNChronic specialty: stable - ENT6-9 other ADG combinations, male, age , no major ADGsChronic medical: unstableHTN renal diseasePsychosocial: persistent/recurrent,Infants: 0-5 ADGs, no major ADGs, low birth weightInjuries/adverse effects: majorIntracranial injuryMalignancyChronic specialty: stable11
Collapsed ADGs 4.3 billion possible combinations of ADGs So to make it more manageable to get to thatunique grouping for a patient, grouped ADGsinto collapsed ADGs based on– Likelihood of persistence or recurrence– Severity– Types of healthcare services required Pts can still be assigned to more than 1
CADGs
Diagnosis-based markers:Morbidity viewBased on Duration Severity Diagnostic Certainty Etiology Specialty Care Frequentlyoccurringcombinations ofCADGs Based onpatterns of CADGHigh expected resource use ADGs: Pediatric AdultCollapsed based on: Likelihood of persistence /recurrence Severity Types of healthcare services required16ICD-9 20,000MajorADGADGCADG3212Based on: Age Sex Specific ADG # of major ADG # of ADG 100ACGMACIndividuals with similar: Needs for healthcareresources ClinicalcharacteristicsOne value per person26 MACs are mutually exclusive grouping so of CADGs The MACs are then split into ACGs to identify groups ofindividuals with similar needs for healthcare resources who alsoshare similar clinical characteristics. The variables taken into consideration include: age, sex,presence of specific ADGs, number of major ADGs, and totalnumber of ADGs.14
MACs
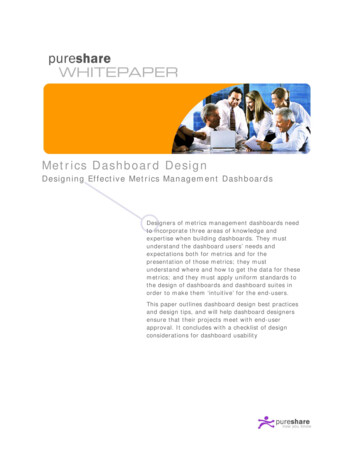
Diagnosis-based markers:ACG - Concurrent Weight - RUBACGConcurrentNumericalACG-weightsAdjusted Clinical GroupCategoricalAssessment ofrelative resource useMean cost of all pt in anACG divided by meancost of all pt in thepopulation ACG with higher weightuses more healthcareresource LocalACGweightsACGDescriptionCompared tolocal population 0 Non-User1 Healthy User2 Low3 Moderate4 High5 Very High16ReferenceACG-weights“IBI”Compared toUS populationRUB(Resource UtilizationBand)One valueper ACG
RUB Categories and ACG dates “No Data” means the pt was notenrolled for the full measurement year. Measurement year ended 3 monthsprior to MHSPHP metrics date; about4.5 months prior to ACG run date toallow maturity of claims data Metrics as of date: 30 Oct 14 ACG date: mid Dec 14 (date ACG datawas run) ACG data range: 1-Sep-2013 thru 31 Jul2014 0 Non-User1 Healthy User2 Low3 Moderate4 High5 Very High
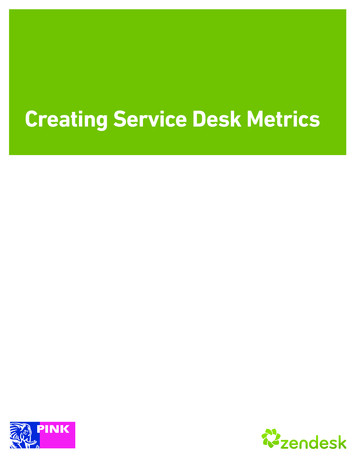
Examples of IBI andRUBReference Concurrent WeightACGRUBCommercial(0-64)Medicare( 65)Acute Minor, Age 6 0.160.101Chronic medical: stable0.350.1522-3 Other ADG combinations, age 1-170.500.152Acute major/Likely to recur0.530.24310 Other ADG combinations, age 18 , 0-1major ADG3.321.0646-9 Other ADG combinations, age 35 , 3major ADGs6.891.87518
What can ACG do for rofilingACGProviderProfilingCaseManagement19
Population profilingResource Utilization Band by MTF%Resource Utilization Band (RUB)20
PHDR On top of Announcements page are other reports Click on Adjusted Clinical Group Report
ACG Report Column Headers
PCM Provider Type Filter Drag Provider type toLeft of Service ontable Right click on dataarea and select Filterand Rank Set provider typefilter on and selectprovider type theclick arrow. Whendone click ok
Service Comparison ofProvider types Result of previous slidefilter Next, right click in the dataand filter on your MTF
Drilling into your ACG data Click on the drill down arrow todisplay provider groups Drag PROVIDER TYPE to right ofMTF name to compare providertypes within a prov group Look for outliers– Do panels need balancing?
Group by Provider type 1.0 is average across DoD, but it is higher than all the familyphysicians at this MTF
Drill down to name level Don’t compare(TOTALS)withoutconsideringpatient countand IBICan get more details in the RUB tables
RUB tables
DOD ACG RUBSummary
Balancing EnrollmentRUB 0RUB 1RUB 2RUB 3RUB 4RUB 5 On this team, internist has same IBI as FP and PA isclose behind. PA has high percentage of RUB5compared to service peers and MTF Consider moving RUB5 pts to Internist and some RUB1-2 pts to PA. Of course must consider uniqueness of site/providers(ie new provider, internal med specialty PA)
Drill further Click & drag in Age band to table. Depending on PA skill level, considermoving RUB 5 over 65 to internist and RUB 1-2 35-54 yr olds to PA
What can ACG do for rofilingACGProviderProfilingCaseManagement32
ACG and Appt List
ACG and Appt List Teams: Find High and Very High RUB patients withappts today and next week If appt in primary care, is it with PCM?– These pts benefit most from continuity Do they need a longer appt time? Can you rearrange schedule to accommodate? As a PCM, where are your high RUB pts being seen?Would they benefit from case manager or PCM RNcontact with that appt? Do they need follow-upfrom an ER visit?
Appt List High Filter
High Utilizers Look for patients with RUB healthy or low– Why are they such high utilizers if disease complexity notthere Isolated acute injury or illness with lots of follow-up Behavioral/social support referral for “needy” pt Patients with high IBI– Try to ensure PCM continuity– May need Case management referral either with TRICAREcontractor or MTF depending on majority of care
Health Services Registry (HSR) ACG report data at the patient level Contains entire list of patients who wereenrolled at least 11 of the 12 month ACGmeasurement period
Other than IBI and RUB .
Frailty
Frailty and Risk of InjuryHospitalization
Pharmacy and Total Cost
Coordination of Care Markers
Hospital Dominant Conditions(Samples)
HSR Columns (1)
HSR Columns (2)
HSR Columns (3)
PCM team and casemanagement Review at risk patients for referral to casemanagement or care coordination– Frailty Flag– Probability of injury– Probability of hospitalization– Care Coordination risk– Hospital dominant conditions– Have they seen their PCM? Do they have the bestlevel provider for their level of complexity?
Utilization Management High number of visits or high costSort HSR by clicking on the columnHow many specialties?How many ER visits?Has pt seen generalist ( is PCM a source ofcontinuity)? Probability of high pharmacy or total costs? Would pt benefit from CM referral? Review encounters in patient details
Disease Management Resource allocation—if can’t manage allpatients with a specific condition, focus on themost complex:– ACG IBI– Risk of hospitalization– Number of hospital dominant conditions– Likely Coordination Issue– Projected costs
FAQ: Why do we have 9-10outpt visits per provider? Export HSR without PII and made pivot 93961001051091161261421701751811912680
FAQ: How could the pt have268 encounters in one year? Outpatient visits include network and MTFencounters No T-CONS Does include:– Primary care– Specialty care– Urgent care– Physical, Speech, Occupational, behavior therapies– Mental Health counseling
498 visits and not LCI?
498 visits explained
Expanded Diagnostic Clusters
Public Queries Queries released to all to help begin yourjourney into this data Select My Filters at top of page and click RUNto load the query and search the data
Questions?Contact: judith.rosen.1.ctr@us.af.mil56
(Resource Utilization Band) 0 Non-User 1 Healthy User 2 Low 3 Moderate 4 High 5 Very High Mean cost of all pt in an ACG divided by mean cost of all pt in the population ACG with higher weight uses more healthcare resource Assessment of relative