Transcription
Economy OverviewNortheast Iowa: Allamakee-ClaytonElectric & MiEnergy ServiceTerritories (Allamakee, Bremer,Chickasaw, Clayton, Dubuque,Faye e, Howard & WinneshiekCoun es) (Report provided courtesyof the 7 Rivers Alliance)Emsi Q1 2019 Data Set www.economicmodeling.com
Economy OverviewContents. . . . . . . . . OverviewEconomy.1.Historic. . . . . . .&. .Projected. . . . . . . . .Trends.3.Popula. . . . . . .on. . .Characteris. . . . . . . . . . .cs.7.Industry. . . . . . . Characteris. . . . . . . . . . . .cs. . . . . . . . . . . . . . . . . . . . . . . . . . . . . . . . . . . . . . . . . . . . . . . . . . . . . . . . . . . . . . . . . . . . . . . . . . . . . . 8.Business. . . . . . . .Characteris. . . . . . . . . . . cs. . . . . . . . . . . . . . . . . . . . . . . . . . . . . . . . . . . . . . . . . . . . . . . . . . . . . . . . . . . . . . . . . . . . . . . . . . . . . 15.Workforce. . . . . . . . . . .Characteris. . . . . . . . . . .cs. . . . . . . . . . . . . . . . . . . . . . . . . . . . . . . . . . . . . . . . . . . . . . . . . . . . . . . . . . . . . . . . . . . . . . . . . . . 17. . . . . . . onal. . . . Pipeline. . . . . . . . . . . . . . . . . . . . . . . . . . . . . . . . . . . . . . . . . . . . . . . . . . . . . . . . . . . . . . . . . . . . . . . . . . . . . . . . . . . . . . 24.EducaEmsi Q1 2019 Data Set www.economicmodeling.com
Economy OverviewEconomy Overview214,627121,798 49.4KPopula on (2018)Jobs (2018)Avg. Earnings Per Job (2018)Popula on decreased by 715over the last 5 years and isprojected to decrease by 334over the next 5 years.Jobs grew by 1,526 over the last5 years and are projected to growby 6,052 over the next 5 years.Regional average earnings per jobare 15.7K below the na onalaverage earnings of 65.1K perjob.RegionStateNa onPopula on(2018)Labor Force(2018)Jobs (2018)Cost ofLivingGRPImportsExports214,627119,727121,79897.6 12.42B 15.34B 15.48B3,158,5991,697,1501,730,57297.7 194.90B 189.73B 229.50B328,038,851162,722,799162,139,168100.0 19.94T 0 8.59TEmsi Q1 2019 Data Set www.economicmodeling.com1
Economy OverviewEconomy Overview - Cont.2018 Labor Force BreakdownPopula onA214,627Popula onTotal Working Age Popula onANot in Labor Force (15 )ALabor 6812,046Under 1539,791Educa onal A ainmentConcerning educa onal a ainment, 16.4% of the selected regions' residents possess a Bachelor's Degree (2.2% below thena onal average), and 10.8% hold an Associate's Degree (2.7% above the na onal average).% of Popula onPopula onALess Than 9th Grade3.9%5,662A9th Grade to 12th Grade4.4%6,397AHigh School Diploma37.7%54,768ASome College19.4%28,270AAssociate's Degree10.8%15,651ABachelor's Degree16.4%23,814AGraduate Degree and Higher7.5%10,903Emsi Q1 2019 Data Set www.economicmodeling.com2
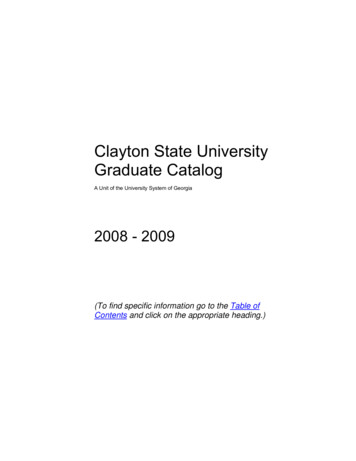
Economy OverviewHistoric & Projected TrendsPopula on TrendsAs of 2018 the region's popula on declined by 0.3% since 2013, falling by 715. Popula on is expected to decrease by 0.2%between 2018 and 2023, losing 334.TimeframePopula 02022214,3512023214,293Emsi Q1 2019 Data Set www.economicmodeling.com3
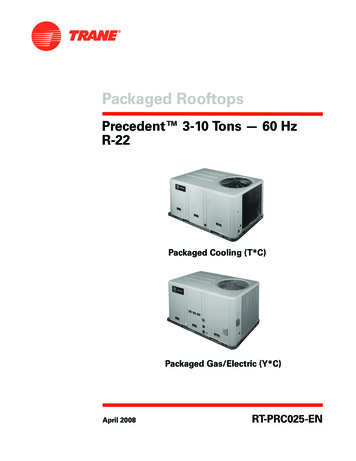
Economy OverviewHistoric & Projected Trends - Cont.Job TrendsFrom 2013 to 2018, jobs increased by 1.3% in Northeast Iowa: Allamakee-Clayton Electric & MiEnergy Service Territories(Allamakee, Bremer, Chickasaw, Clayton, Dubuque, Faye e, Howard & Winneshiek Coun es) (Report provided courtesy of the7 Rivers Alliance) from 120,272 to 121,798. This change fell short of the na onal growth rate of 7.8% by 24,9092021126,1212022127,1722023127,850Emsi Q1 2019 Data Set www.economicmodeling.com4
Economy OverviewHistoric & Projected Trends - Cont.Labor Force Par cipa on Rate TrendsTimeframeLabor Force Par cipa on .31%January - July 201867.91%August 201866.90%September 201867.82%October 201868.48%Emsi Q1 2019 Data Set www.economicmodeling.com5
Economy OverviewHistoric & Projected Trends - Cont.Unemployment Rate TrendsYour areas had an October 2018 unemployment rate of 1.71%, decreasing from 4.76% 5 years before.TimeframeUnemployment anuary - July 20183.04%August 20182.19%September 20181.91%October 20181.71%Emsi Q1 2019 Data Set www.economicmodeling.com6
Economy OverviewPopula on Characteris cs38,90572,33715,274MillennialsRe ring SoonRacial DiversityYour area has 38,905 millennialsRe rement risk is high in yourRacial diversity is low in your area.(ages 20-34). The na onal averagearea. The na onal average for anThe na onal average for an areafor an area this size is 44,467.area this size is 61,205 people 55this size is 84,317 racially diverseor older, while there are 72,337people, while there are sViolent CrimeProperty CrimeYour area has 13,823 veterans.Your area has 1.76 violent crimesYour area has 13.75 propertyThe na onal average for an areaper 1,000 people. The na onalcrimes per 1,000 people. Thethis size is 12,484.rate is 3.75 per 1,000 people.na onal rate is 24.21 per 1,000people.Emsi Q1 2019 Data Set www.economicmodeling.com7
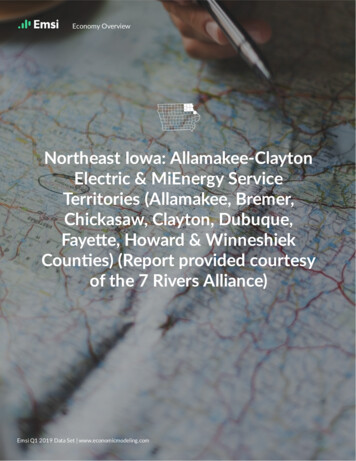
Economy OverviewIndustry Characteris csLargest IndustriesIndustry JobsNa onal AverageManufacturingHealth Care and Social AssistanceGovernmentRetail TradeAccommoda on and Food ServicesFinance and InsuranceEduca onal ServicesConstruc onOther Services (except Public Administra on)Wholesale TradeAgriculture, Forestry, Fishing and Hun ngTransporta on and WarehousingProfessional, Scien fic, and Technical ServicesAdministra ve and Support and Waste Management andRemedia on ServicesArts, Entertainment, and Recrea onInforma onManagement of Companies and EnterprisesReal Estate and Rental and LeasingMining, Quarrying, and Oil and Gas Extrac onU li es0Emsi Q1 2019 Data Set www.economicmodeling.com5,00010,00015,0008
Economy OverviewIndustry Characteris cs - Cont.Top Growing IndustriesIndustry Jobs GrowthFinance and InsuranceManufacturingHealth Care and Social AssistanceTransporta on and WarehousingConstruc onMining, Quarrying, and Oil and Gas Extrac onOther Services (except Public Administra on)Retail TradeAccommoda on and Food ServicesReal Estate and Rental and LeasingManagement of Companies and Enterprises0Emsi Q1 2019 Data Set www.economicmodeling.com2004006008001,0009
Economy OverviewIndustry Characteris cs - Cont.Top Industry LQIndustry LQAgriculture, Forestry, Fishing and Hun ngEduca onal ServicesManufacturingFinance and InsuranceWholesale TradeOther Services (except Public Administra on)Mining, Quarrying, and Oil and Gas Extrac onRetail TradeArts, Entertainment, and Recrea onHealth Care and Social AssistanceConstruc onTransporta on and WarehousingU li esGovernmentAccommoda on and Food ServicesManagement of Companies and EnterprisesInforma onProfessional, Scien fic, and Technical ServicesReal Estate and Rental and Leasinga ve and Support and Waste Management and Remedia on Services0.00Emsi Q1 2019 Data Set www.economicmodeling.com1.002.0010
Economy OverviewIndustry Characteris cs - Cont.Top Industry GRP2018 Gross Regional ProductManufacturingFinance and InsuranceWholesale TradeHealth Care and Social AssistanceGovernmentRetail TradeAgriculture, Forestry, Fishing and Hun ngConstruc onProfessional, Scien fic, and Technical ServicesTransporta on and WarehousingEduca onal ServicesInforma onReal Estate and Rental and LeasingAccommoda on and Food ServicesOther Services (except Public Administra on)U li esArts, Entertainment, and Recrea ona ve and Support and Waste Management and Remedia on ServicesMining, Quarrying, and Oil and Gas Extrac onManagement of Companies and Enterprises 0.000Emsi Q1 2019 Data Set www.economicmodeling.com 500.0M 1.000B 1.500B 2.000B11
Economy OverviewIndustry Characteris cs - Cont.Top Industry Earnings2018 Earnings Per WorkerU li esManagement of Companies and EnterprisesMining, Quarrying, and Oil and Gas Extrac onFinance and InsuranceProfessional, Scien fic, and Technical ServicesManufacturingInforma onWholesale TradeTransporta on and WarehousingConstruc onGovernmentHealth Care and Social AssistanceReal Estate and Rental and Leasinga ve and Support and Waste Management and Remedia on ServicesAgriculture, Forestry, Fishing and Hun ngEduca onal ServicesRetail TradeArts, Entertainment, and Recrea onOther Services (except Public Administra on)Accommoda on and Food Services 0Emsi Q1 2019 Data Set www.economicmodeling.com 20,000 40,000 60,000 80,000 100,000 120,00012
Economy OverviewIndustry Characteris cs - Cont.Change in Jobs%Changein Jobs2018LQ2018 EarningsPer Worker2018 GRP18,011719 4%1.88 69,064 2.45B14,88815,566678 5%1.01 48,801 923.61MGovernment14,75314,638-115-1%0.80 54,206 901.39MRetail Trade12,81112,90897 1%1.04 31,160 761.55MAccommoda on and FoodServices7,4987,59294 1%0.73 16,198 222.74MFinance and Insurance5,9046,9981,094 19%1.42 74,887 1.18BEduca onal Services7,0906,762-328-5%2.17 33,083 303.34MConstruc on6,5326,706174 3%0.99 54,336 565.79MOther Services (except PublicAdministra on)6,1296,240111 2%1.07 24,756 216.56MWholesale Trade5,8185,352-466-8%1.19 63,604 974.94MAgriculture, Forestry, Fishing andHun ng4,1184,063-55-1%2.83 34,476 577.35MTransporta on and Warehousing3,2363,671435 13%0.84 57,139 319.60MProfessional, Scien fic, andTechnical Services4,2233,592-631-15%0.46 69,468 375.98MAdministra ve and Support andWaste Management andRemedia on Services3,5513,201-350-10%0.42 37,935 175.51MArts, Entertainment, andRecrea on2,2462,183-63-3%1.03 28,812 195.03MInforma on1,5121,407-105-7%0.63 63,766 292.32MManagement of Companies andEnterprises1,0531,12976 7%0.65 84,306 107.63MReal Estate and Rental and Leasing82190180 10%0.44 39,008 276.08MMining, Quarrying, and Oil andGas Extrac on378524146 39%1.05 78,892 113.17M2013Jobs2018JobsManufacturing17,292Health Care and Social AssistanceIndustryEmsi Q1 2019 Data Set www.economicmodeling.com13
Economy OverviewIndustry Characteris cs - Cont.Industry2013 Jobs2018 JobsChange in Jobs% Change in Jobs2018 LQ2018 EarningsPer Worker2018 GRPU li es417354-63-15%0.84 126,210 214.90MEmsi Q1 2019 Data Set www.economicmodeling.com14
Economy OverviewBusiness Characteris cs9,483 Companies Employ Your WorkersOnline profiles for your workers men on 9,483 companies as employers, with the top 10 appearing below. In the last 12months, 3,852 companies in your area posted job pos ngs, with the top 10 appearing below.Top CompaniesProfilesDeere & Company846Top Companies Pos ngUnique Pos ngsCRST Interna onal, Inc.4,243Interna onal Business Machines Corpora437onKoch Trucking, Inc.1,558Dubuque Community School District 317Amling Construc on1,155McGraw Hill Financial, Inc.286C.R. England, Inc.1,008University of Dubuque278USA Truck, Inc.Co ngham & Butler, Inc.258Pla num Supplemental Insurance, Inc. 766Loras College240Express Services Inc758Sedgwick Claims Management Services, 194Inc.Tutree, Inc.581Wartburg College192Teach For America, Inc.577Northeast Iowa Community College 190U. S. Xpress, Inc.456Emsi Q1 2019 Data Set www.economicmodeling.com81215
Economy OverviewBusiness Characteris cs - Cont.Business SizePercentageBusiness CountA1 to 4 employees39.1%3,968A5 to 9 employees26.2%2,660A10 to 19 employees18.2%1,849A20 to 49 employees11.3%1,150A50 to 99 employees3.0%309A100 to 249 employees1.4%139A250 to 499 employees0.4%45A500 employees0.2%16*Business Data by DatabaseUSA.com is third-party data provided by Emsi to its customers as a convenience, and Emsi does not endorse or warrant itsaccuracy or consistency with other published Emsi data. In most cases, the Business Count will not match total companies with profiles on the summary tab.Emsi Q1 2019 Data Set www.economicmodeling.com16
Economy OverviewWorkforce Characteris csLargest Occupa onsOccupa on JobsNa onal AverageOffice and Administra ve SupportProduc onSales and RelatedFood Prepara on and Serving RelatedTransporta on and Material MovingEduca on, Training, and LibraryManagementHealthcare Praconers and TechnicalConstruc on and Extrac onInstalla on, Maintenance, and RepairPersonal Care and ServiceBusiness and Financial Opera onsBuilding and Grounds Cleaning and MaintenanceHealthcare SupportCommunity and Social ServiceComputer and Mathema calArts, Design, Entertainment, Sports, and MediaFarming, Fishing, and ForestryProtec ve ServiceArchitecture and EngineeringLife, Physical, and Social ScienceLegalMilitary-only0Emsi Q1 2019 Data Set www.economicmodeling.com5,00010,00015,00017
Economy OverviewWorkforce Characteris cs - Cont.Top Growing Occupa onsOccupa on Jobs GrowthHealthcare Praconers and TechnicalBusiness and Financial Opera onsFood Prepara on and Serving RelatedTransporta on and Material MovingPersonal Care and ServiceFarming, Fishing, and ForestryInstalla on, Maintenance, and RepairConstruc on and Extrac onArchitecture and EngineeringEduca on, Training, and LibraryCommunity and Social ServiceLife, Physical, and Social ScienceArts, Design, Entertainment, Sports, and MediaManagementProduc on0Emsi Q1 2019 Data Set www.economicmodeling.com10020030040050018
Economy OverviewWorkforce Characteris cs - Cont.Top Occupa on LQOccupa on LQFarming, Fishing, and ForestryProduc onManagementEduca on, Training, and LibraryCommunity and Social ServiceInstalla on, Maintenance, and RepairConstruc on and Extrac onPersonal Care and ServiceTransporta on and Material MovingHealthcare SupportHealthcare Praconers and TechnicalSales and RelatedFood Prepara on and Serving RelatedOffice and Administra ve SupportArts, Design, Entertainment, Sports, and MediaBuilding and Grounds Cleaning and MaintenanceBusiness and Financial Opera onsArchitecture and EngineeringComputer and Mathema calProtec ve ServiceLife, Physical, and Social ScienceMilitary-onlyLegal0.00Emsi Q1 2019 Data Set www.economicmodeling.com1.002.0019
Economy OverviewWorkforce Characteris cs - Cont.Top Occupa on Earnings2017 Median Hourly EarningsComputer and Mathema calArchitecture and EngineeringManagementBusiness and Financial Opera onsLegalHealthcare Praconers and TechnicalLife, Physical, and Social ScienceEduca on, Training, and LibraryInstalla on, Maintenance, and RepairMilitary-onlyConstruc on and Extrac onCommunity and Social ServiceProduc onProtec ve ServiceTransporta on and Material MovingOffice and Administra ve SupportArts, Design, Entertainment, Sports, and MediaFarming, Fishing, and ForestryHealthcare SupportSales and RelatedBuilding and Grounds Cleaning and MaintenancePersonal Care and ServiceFood Prepara on and Serving Related 0.00Emsi Q1 2019 Data Set www.economicmodeling.com 5.00 10.00 15.00 20.00 25.00 30.0020
Economy OverviewWorkforce Characteris cs - Cont.Top Posted Occupa onsUnique Average Monthly Pos ngsTransporta on and Material MovingSales and RelatedHealthcare Praconers and TechnicalOffice and Administra ve SupportFood Prepara on and Serving RelatedProduc onEduca on, Training, and LibraryManagementInstalla on, Maintenance, and RepairBusiness and Financial Opera onsComputer and Mathema calArchitecture and EngineeringHealthcare SupportPersonal Care and ServiceCommunity and Social ServiceBuilding and Grounds Cleaning and MaintenanceArts, Design, Entertainment, Sports, and MediaConstruc on and Extrac onProtec ve ServiceLife, Physical, and Social ScienceLegalFarming, Fishing, and Forestry0Emsi Q1 2019 Data Set www.economicmodeling.com1,0002,0003,00021
Economy OverviewWorkforce Characteris cs - Cont.Change in Jobs%Changein Jobs2018LQ2017 MedianHourlyEarningsMar 2018 - Feb 2019Unique AverageMonthly Pos ngs16,267-755-4%0.91 15.3673512,84312,85815 0%1.80 16.7644511,90211,604-298-3%0.96 12.581,095Food Prepara on andServing Related9,2999,662363 4%0.95 9.45451Transporta on andMaterial Moving7,8148,152338 4%0.98 16.513,626Educa on, Training, andLibrary7,8057,923118 2%1.15 19.02419Management7,7647,83066 1%1.15 28.313975,9646,548584 10%0.97 25.30957Construc on andExtrac on5,9296,081152 3%1.09 18.27125Installa on,Maintenance, andRepair5,0915,303212 4%1.11 18.78351Personal Care andService4,8915,190299 6%0.99 10.48148Business and FinancialOpera ons4,1614,717556 13%0.75 25.60311Building and GroundsCleaning andMaintenance4,0423,774-268-7%0.84 11.47127Healthcare Support3,3673,238-129-4%0.98 13.38171Community and SocialService2,1542,23985 4%1.11 17.52139Computer andMathema cal2,3292,122-207-9%0.60 32.242102013Jobs2018JobsOffice andAdministra ve Support17,022Produc onSales and RelatedOccupa onHealthcare Pracand TechnicalonersEmsi Q1 2019 Data Set www.economicmodeling.com22
Economy OverviewWorkforce Characteris cs - Cont.Change in Jobs%Changein Jobs2018LQ2017 MedianHourlyEarningsMar 2018 - Feb 2019Unique AverageMonthly Pos ngs2,02975 4%0.90 14.771251,5921,873281 18%2.03 13.5014Protec ve Service1,7631,606-157-9%0.59 16.5961Architecture andEngineering1,3061,442136 10%0.70 30.03178Life, Physical, andSocial Science45353784 19%0.53 23.9933Legal46946900%0.47 25.4114Military-only359332-27-8%0.53 18.760Occupa on2013Jobs2018JobsArts, Design,Entertainment, Sports,and Media1,954Farming, Fishing, andForestryEmsi Q1 2019 Data Set www.economicmodeling.com23
Economy OverviewEduca onal PipelineIn 2017, there were 4,855 graduates in Northeast Iowa: Allamakee-Clayton Electric & MiEnergy Service Territories (Allamakee,Bremer, Chickasaw, Clayton, Dubuque, Faye e, Howard & Winneshiek Coun es) (Report provided courtesy of the 7 RiversAlliance). This pipeline has shrunk by 11% over the last 5 years. The highest share of these graduates come from "BusinessAdministra on and Management, General", "Psychology, General", and Liberal Arts and Sciences/Liberal Studies.SchoolTotal Graduates (2017)Upper Iowa University1,458Northeast Iowa Community College801University of Dubuque623Luther College595Loras College437Wartburg College356Clarke University285Emmaus Bible College134Capri College-Dubuque129Wartburg Theological SeminaryCer ficateAssociate'sGraduate Trend (2013 2017)27Bachelor'sEmsi Q1 2019 Data Set www.economicmodeling.comMaster's or Higher24
From 2013 to 2018, jobs increased by 1.3% in Northeast Iowa: Allamakee-Clayton Electric & MiEnergy Service Territories (Allamakee, Bremer, Chickasaw, Clayton, Dubuque, Faye;e, Howard & Winneshiek Coun#es) (Report provided courtesy of the 7 Rivers Alliance) from 120,272 to 121,798. This chan