Transcription
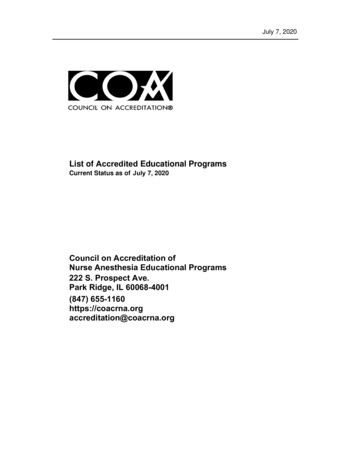
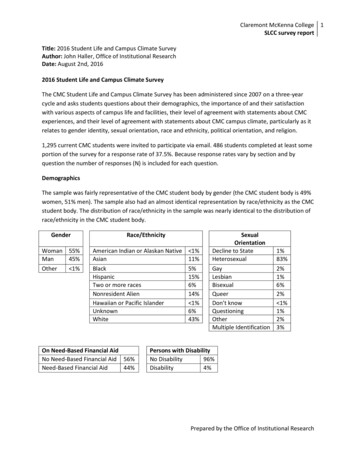
Claremont McKenna College 1SLCC survey reportTitle: 2016 Student Life and Campus Climate SurveyAuthor: John Haller, Office of Institutional ResearchDate: August 2nd, 20162016 Student Life and Campus Climate SurveyThe CMC Student Life and Campus Climate Survey has been administered since 2007 on a three-yearcycle and asks students questions about their demographics, the importance of and their satisfactionwith various aspects of campus life and facilities, their level of agreement with statements about CMCexperiences, and their level of agreement with statements about CMC campus climate, particularly as itrelates to gender identity, sexual orientation, race and ethnicity, political orientation, and religion.1,295 current CMC students were invited to participate via email. 486 students completed at least someportion of the survey for a response rate of 37.5%. Because response rates vary by section and byquestion the number of responses (N) is included for each question.DemographicsThe sample was fairly representative of the CMC student body by gender (the CMC student body is 49%women, 51% men). The sample also had an almost identical representation by race/ethnicity as the CMCstudent body. The distribution of race/ethnicity in the sample was nearly identical to the distribution ofrace/ethnicity in the CMC student body.GenderWoman 55%Man45%Other 1%Race/EthnicityAmerican Indian or Alaskan NativeAsianBlackHispanicTwo or more racesNonresident AlienHawaiian or Pacific IslanderUnknownWhiteOn Need-Based Financial AidNo Need-Based Financial Aid 56%Need-Based Financial Aid44% 1%11%5%15%6%14% 1%6%43%SexualOrientationDecline to StateHeterosexualGayLesbianBisexualQueerDon’t knowQuestioningOtherMultiple Identification1%83%2%1%6%2% 1%1%2%3%Persons with DisabilityNo Disability96%Disability4%Prepared by the Office of Institutional Research
Claremont McKenna College 2SLCC survey reportSummary of Questions Addressing Diversity and InclusionThe student life and campus climate survey is a comprehensive survey of many facets of the studentexperience. Of particular interest in spring 2016 were those questions that that reflect experiences andperspectives that relate to diversity and inclusion. Though these types of questions were spreadthroughout the survey, an analysis of similar questions revealed the following themes:1. In the student life section, respondents tended to express a desire to be exposed to diversestudents and cultures and were generally less satisfied with their current opportunities to do so.These questions did not identify a specific definition of “diverse”.2. The campus climate section of the survey addresses more specific elements of diversity andinclusion. Overall respondents tended to report lower perceptions of fair treatment of diverseindividuals compared with the previous administration of the survey (2013).3. Respondents who identified as not exclusively white, not exclusively heterosexual, and womentended to report less fair treatment of themselves and others with diverse identities. Oftenresponses from these subgroups are polarized, where roughly the same proportion report unfairtreatment as those that report fair treatment. These results suggest that students sharing theseidentities can have very different experiences at, and perceptions of CMC.Note that we know from past experiences with this and other surveys that responses are very muchdriven by current, immediate events. In other words, while the questions are framed as general, nottime-bound statements, respondents tend to make their judgments based nearly exclusively on thecurrent situation at the time they participate in the survey. Hence the comparisons between 2013 and2016 tell us more about how these two specific moments in time differed, rather than denoting anydeeper, long-term trend.Full Results for the 2016 Student Life and Campus Climate SurveyStudent LifeThis report displays results for each instrument separately and by general grouped topic. 1,295 currentCMC students were invited to participate via email. 486 students completed at least some portion of thesurvey for a response rate of 37.5%. Because response rates vary by section and by question the numberof responses (N) is included for each question. Each response scale has a low point of 1 (Not at allimportant/Very dissatisfied/Strongly disagree) and a high point of 5 (Extremely important/Verysatisfied/Strongly agree) with a neutral midpoint. Each question had either a “N/A” or “Don’t know”response option that was excluded from the analyses. In the following tables responses of 4 or 5 (e.g.“Satisfied” and “Very satisfied”) are combined to create “% Rating important/satisfied” and responses of1 and 2 (e.g., “Dissatisfied” and “Very dissatisfied”) are combined to create “% Ratingunimportant/dissatisfied”. Questions that are related to one another are shaded in white and grey bars.Prepared by the Office of Institutional Research
Claremont McKenna College 3SLCC survey reportLarger discrepancies ( 10%) between importance and satisfaction are noted in the text following thetable.Campus ActivitiesN% Ratingimportant/satisfied% %3.514.001.0147930%29%3.113.001.10Importance to me-Opportunities to becomeinvolved in community service or volunteerprograms48456%10%3.564.000.93My level of satisfaction-Opportunities to becomeinvolved in community service or volunteerprograms47653%12%3.624.001.00Importance to me-Fitness/recreation facilities formy personal needs and use48682%3%4.184.000.83My level of satisfaction-Fitness/recreationfacilities for my personal needs and use47651%27%3.334.001.12Importance to me-Intercollegiate athletic events48640%26%3.143.001.30My level of satisfaction-Intercollegiate athleticevents47750%9%3.754.001.08Importance to me-Intramural athletic programs48534%29%2.983.001.24My level of satisfaction-Intramural athleticprograms47344%8%3.673.001.07Importance to me-International place events(International Festival, etc.)48433%21%3.173.001.19My level of satisfaction-International placeevents (International Festival, etc.)46746%6%3.714.001.02Importance to me-Cultural events on campus music, films, drama, dance, art exhibits, etc.My level of satisfaction-Cultural events oncampus - music, films, drama, dance, art exhibits,etc.1. Roughly half (53%) of respondents felt that cultural events were important to them but only30% were satisfied.2. 82% of respondents indicated fitness/recreation facilities were important to them but 51% weresatisfied.3. Overall, respondents reported lower importance for athletic events/programs and internationalplace events.Prepared by the Office of Institutional Research
Claremont McKenna College 4SLCC survey reportASCMCImportance to me-ASCMC's social activitiesMy level of satisfaction-ASCMC's social activitiesImportance to me-ASCMC's process for fundingclubs and organizationsMy level of satisfaction-ASCMC's process forfunding clubs and organizationsImportance to me-ASCMC's communications withCMC's administrationMy level of satisfaction-ASCMC's communicationswith CMC's administrationImportance to me-Events/programs withoutalcoholMy level of satisfaction-Events/programswithout alcoholN% Ratingimportant/satisfied% .001.051. Overall there is a large discrepancy between importance and satisfaction ratings for ASCMC(between 34 and 79 percentage points).FacilitiesImportance to me-Clean residence hallsMy level of satisfaction-Clean residence hallsImportance to me-Residence halls enable thedevelopment of relationships with diversestudentsMy level of satisfaction-Residence halls enable thedevelopment of relationships with diversestudentsImportance to me-Food services at the hubMy level of satisfaction-Food services at the hubImportance to me-Food services at Collins DiningHallMy level of satisfaction-Food services at CollinsDining HallN% Ratingimportant/satisfied% 001.12Prepared by the Office of Institutional Research
Claremont McKenna College 5SLCC survey reportImportance to me-Variety of Speakers at theMarian Miner Cook AthenaeumMy level of satisfaction-Variety of Speakers at theMarian Miner Cook 1. 93% of respondents found clean residence halls important while 77% were satisfied.2. 81% of respondents view the role of residence halls in enabling the development ofrelationships with diverse students as important; however, just 50% are satisfied.3. Both Collins dining hall and the hub had higher proportions of importance but lower proportionsof satisfaction.4. 90% of respondents indicated that the variety of speakers at the Athenaeum was important but69% were satisfied.Faculty and AdvisingN% Ratingimportant/satisfied% ce to me-Contact with faculty outside ofclass38290%2%4.364.000.71My level of satisfaction-Contact with facultyoutside of 4.000.9437548%15%3.393.001.07Importance to me-Improvement analyzing issues,problems, or ideas while at CMCMy level of satisfaction-Improvement analyzingissues, problems, or ideas while at CMCImportance to me-Faculty help with careeropportunitiesMy level of satisfaction-Faculty help with careeropportunitiesImportance to me-Faculty knowledge of their fieldMy level of satisfaction-Faculty knowledge of theirfieldImportance to me-Academic advising in my majorMy level of satisfaction-Academic advising in mymajorImportance to me-Academic advising for generaleducation requirementsMy level of satisfaction-Academic advising forgeneral education requirementsPrepared by the Office of Institutional Research
Claremont McKenna College 6SLCC survey reportImportance to me-Faculty include contributionsand narratives of diverse demographic groups inthe curriculumMy level of satisfaction-Faculty includecontributions and narratives of diversedemographic groups in the curriculumImportance to me-Faculty are available to prepareeffective letters of recommendationMy level of satisfaction-Faculty are available toprepare effective letters of 01.2338093%1%4.575.000.7337676%4%4.314.001.071. 91% of respondents reported that improvement analyzing issues, problems, or ideas while atCMC was important but only 60% were satisfied.2. 89% of respondents believed that faculty help with career opportunities was important and 48%of respondents were satisfied.3. 91% of respondents felt that faculty advising in their major was important while 52% weresatisfied. 71% felt that faculty advising for GE requirements was important while 48% weresatisfied.4. 72% of respondents believe it is important for faculty to include contributions and narratives ofdiverse demographic groups in the curriculum, with women valuing this role more than men;40% of respondents are satisfied with the job of faculty in this regard, while 16% indicated theydissatisfied.5. 93% of respondents felt that faculty preparation of letters of recommendation was importantand 76% were satisfied.Academic Outcomes and ResourcesN% Ratingimportant/satisfied% ce to me-Improvement expressingyourself in writing while at CMC37484%3%4.284.000.88My level of satisfaction-Improvement expressingyourself in writing while at 761.19Importance to me-Improvement expressingyourself in oral communication while at CMCMy level of satisfaction-Improvement expressingyourself in oral communication while at CMCImportance to me-Space for quiet studyMy level of satisfaction-Space for quiet studyPrepared by the Office of Institutional Research
Claremont McKenna College 7SLCC survey reportImportance to me-Adequate library resourcesMy level of satisfaction-Adequate libraryresourcesImportance to me-Improvement of understandingdiverse cultures through general education (e.g.,cultural competencies)My level of satisfaction-Improvement ofunderstanding diverse cultures through generaleducation (e.g., cultural competencies)Importance to me-Improvement integrating ideasand information from various sources while atCMCMy level of satisfaction-Improvement integratingideas and information from various sources whileat CMCImportance to me-Improvement usinginformation technology tools while at CMCMy level of satisfaction-Improvement usinginformation technology tools while at 12%3.554.000.981. 84% of respondents found it important to improve their writing at CMC while 65% weresatisfied.2. 92% of respondents found it important to improve their oral communication skills at CMC while57% were satisfied.3. 90% of respondents thought space for quiet study was important while 62% were satisfied.4. 72% of respondents believe general education requirements are important to improvingstudents’ understanding of diverse cultures but 32% are satisfied with the role of generaleducation in this regard.5. 88% of respondents felt that it was important to improve on integrating ideas and informationfrom various sources while at CMC, while 66% were satisfied.6. 76% of respondents felt that it was important to improve using information technology toolswhile at CMC, while 50% were satisfied.Campus ClimateThe campus climate portion of the survey asks about perceptions of CMC students and studentexperiences as they relate to race/ethnicity, gender identity, sexual orientation, political orientation,and religion. Two new elements, disability and socioeconomic status were added in 2016.Each response scale has a low point of 1 (Strongly disagree) and a high point of 5 (Strongly agree) with aneutral midpoint. Each question had a “Don’t know” response option that was excluded from theanalyses. In the following tables responses of 4 or 5 (e.g. “Agree” and “Strongly Agree”) are combined toPrepared by the Office of Institutional Research
Claremont McKenna College 8SLCC survey reportcreate “% Agree” and responses of 1 and 2 (e.g., “Disagree” and “Strongly Disagree”) are combined tocreate “% Disagree”.Perceptions of CMC StudentsN% Agree% DisagreeMeanMedianSDCMC encourages students to develop a strong senseof responsibility about their role in society39065%22%3.594.001.20Students have sufficient access to CMCadministrators/staff members39079%11%4.024.001.03Students are under intense academic pressure here39076%10%4.034.000.99CMC students are overly concerned about gettinghigh paying jobs after college39080%8%4.224.000.98Academic dishonesty (plagiarism or cheating) is aproblem at the college39022%56%2.882.001.40Diversity and Perceived Fair TreatmentAn initial analysis compared the proportion of agreement with statements about fair treatment on theprevious administration in 2013 compared with the 2016 administration. Overall there tended to be lessagreement with positive statements about CMC in 2016 than in 2013 (socioeconomic status anddisability were not included in 2013):Race/EthnicityFaculty members treatother students fairlyregardless of their Students treat otherstudents fairly regardlessof their I have personallyexperienceddiscrimination at CMCbased on my 0.0%24.0%15.0%23.0%5.0%7.0%N/A23.0%N/A11.0%Many elements of campus climate were significantly different based on demographical category;therefore, after each table the mean response is disaggregated and compared for these groups. Thesedifferences were compared using three post-hoc computed dichotomous variables: exclusivelyheterosexual (EHS) and not exclusively heterosexual (NEHS), Women and Men, and exclusively white(EW) and not exclusively white (NEW). Means that are significantly different (p .05) using a one-wayANOVA are starred; more stars indicate a larger effect (*small effect (η2 .01), **medium effect (η2 .06),Prepared by the Office of Institutional Research
Claremont McKenna College 9SLCC survey report***large effect (η2 .14)). It is important not to compare means across dichotomous variables (e.g.,Woman vs. EHS) as these groups are not mutually exclusive.Race and EthnicityN% Agree% DisagreeMeanMedianSDFaculty members at CMC treat students fairlyregardless of their ethnicity/race38669%17%4.084.001.28Students at CMC treat other students fairlyregardless of their 001.0937224%63%2.442.001.47There is tension related to ethnicity and race on theCMC CampusI have personally experienced discrimination at CMCbecause of my ethnicity/race1. Although 69% of all respondents agree that CMC faculty members treat students fairlyregardless of their ethnicity/race (item 7), women (W 3.68*, M 4.01*), students who are notexclusively white (EW 4.09*, NEW 3.62*), and those who are not exclusively heterosexual (EHS3.96**, NEHS 3.23**) are significantly less likely to agree.2. Far fewer respondents (54%) agree, and many disagree (32%) that students treat other studentsfairly regardless of their ethnicity/race. In 2013, just 9.5% disagreed with this statement.Disaggregated 2016 responses were significant across groups with the strongest effect size forethnicity/race. Women (W 3.19*, M 3.64*), students who are not exclusively white (EW 3.76**,NEW 3.04**), and those who are not exclusively heterosexual (EHS 3.50*, NEHS 2.89*) weresignificantly less likely to agree that students are treated fairly by other students regardless ofethnicity/race.3. Nearly a quarter of all respondents (24%) agree that they have personally experienceddiscrimination at CMC based on their ethnicity/race, (EW 1.73***, NEW 2.82***). This is morethan twice the proportion of affirmative responses in 2013 (10%).Gender IdentityN% Agree% DisagreeMeanMedianSDFaculty members at CMC treat students fairlyregardless of their gender identity38570%14%4.214.001.29Students at CMC treat other students fairlyregardless of their gender 37223%65%2.382.001.41There is tension related to gender identity on theCMC campusI have personally experienced discrimination at CMCbecause of my gender identityPrepared by the Office of Institutional Research
Claremont McKenna College 10SLCC survey report1. Most respondents (70%) agree that CMC faculty members treat students fairly regardless oftheir gender identity, but fewer (56%) feel that students treat students fairly on this measure.Indeed, 30% of respondents disagree that students are treated fairly by fellow studentsregardless of gender. Disaggregated responses reveal that women, students who are notexclusively white, and those who are not exclusively heterosexual are less likely to agree thatfaculty or students treat students fairly regardless of gender identify. Sexual orientation had thestrongest effect in both cases (faculty: EHS 4.00**, NEHS 3.25**; student: EHS 3.56**, NEHS2.77**).2. Almost a quarter (23%) of respondents agree that they have personally experienceddiscrimination based on their gender identity, with significantly greater frequency amongwomen, students who are not exclusively white, and students who are not exclusivelyheterosexua
SLCC survey report 1 Prepared by the Office of Institutional Research . Title: 2016 Student Life and Campus Climate Survey . Author: John Haller, Office of Institutional Research. . On Need-Based Financial Aid Persons with Disability . No Need-Based Financial Aid 56% No Disability 96% Need-B