Transcription
School Budgets 101 Any local government or agency—including public schools—uses its budget to describe its program plans for theupcoming year. This brief—written to help expand familiarity with and understanding of school budgets and therole of various levels of government—is a bird’s‐eye view of school budgets and answers the followingquestions: Who is involved in the school budget? What is the role and purpose of the school budget? What are the major budget categories for school districts? Where do the resources for school budgets come from? When are school budgets spent? How is this information related to the current federal budget proposal and economic realities at thelocal level?The content and information presented here is a general overview of school budgets. As such, specifics will varybetween both states and districts. As you work through the rest of this white paper, keep in mind thatat any given time, school districts are likely managing three budgets: finishing audits/evaluations and finaldetails of the previous budget, operating and monitoring the current budget, and planning for the next budget.Overview: While the concept of budgets is common across professional sectors and fields, the budget process inpublic schools has noticeable differences that impact how districts’ allocate and prioritize their funds. Forexample, while most public and private organizations and businesses have 35 to 40 percent of their budgets tiedto personnel and benefits, the comparable number in public schools is, on average, more than double, between80 and 85 percent. Further complicating districts’ ability to address budget priorities, the remaining 15 percentof their budgets is oftentimes impacted and limited by state, local and federal mandates related to everythingfrom building codes to class size requirements.The school budget involves many different individuals and entities across several levels of government. Thebudget—and accompanying process—provides school districts and their leaders with an opportunity to justifythe collection and expenditure of public funds. School budget resources come from a combination of local, stateand federal contributions. The 2006‐07 school year is the most recent year for which we have a full tabulation ofthe education funding contributions split between local government (43.9 percent), state government (47.6percent) and federal government (8.5 percent).School budgets are spent continuously throughout the year. Federal dollars in school budgets are also spentthroughout the school year, with the rule of ‘first in, first out.’ That is, money is spent in the order that it isreceived: A school district cannot spend any of its Title I funds for the 2011‐12 school year until it exhausts its2010‐11 school year. Prepared by Noelle Ellerson, Policy Analyst, American Association of School Administrators, nellerson@aasa.orgPage 1
AASA White Paper: School Budgets 101AASA applauds the Obama Administration’s continued support for and investment in education within PresidentObama’s 2011 budget proposal. The emphasis on improving teaching and strengthening teachers and schoolleaders is an important step toward long‐term positive change in our schools. AASA also applauds the significantincrease in funding for ESEA. That said, AASA is concerned with the level funding of both Title I and IDEA forFY11, along with a significant increase in the proportion of discretionary education dollars deemed‘competitive.’Who is involved in the school budget? The school budget involves many different individuals and entities acrossseveral levels of government. At the local/district level, budget discussions and work will involve schooladministrators, school boards, school employees and community members. At the state level, the governor,state legislators and state education agency are involved for their role in setting and managing state funding andstate policy, including state equalization formulas. At the national level, the federal education department andmembers of Congress are involved for their work around education funding and federal policy, such as Title I orIDEA.What is the role and purpose of the school budget? The school budget—and accompanying process—providesschool districts and their leaders with an opportunity to justify the collection and expenditure of public funds. Inits most simple definition, a school budget describes a district’s plan for the upcoming year as related toanticipated revenues and expenditures. School budgets allow districts to translate sometimes intangiblemissions, operations and objectives into reality by outlining and providing specific programs andfunding/financial terms. A school budget helps bridge the gap that can exist between a district’s stated goalsand resource allocation. The budget process forces the discussion that will inform choices among variousprograms competing for the limited available resources. As WilliamHartman writes, key steps of the schoolbudget process include, “ establishing the district’s objectives and priorities; allocating resources; involving thepublic through budget hearings, school board decisions and other means of representative democracy; and, insome states, conducting budget elections.” (Hartman, 1999).What are the major budget categories for school districts? While specific budget lines and items vary district todistrict and state to state, there are broad general categories that apply to most schools. These categoriesinclude, but are not limited to: Transportation ‐ buses and drivers to transport students Facilities – to ensure students attend schools that are clean and well maintained Energy ‐ the school is lit during the day, heated in the winter and cooled in the summer Health and Safety ‐ the school nurse cares for the ill student, and security measures keep staff andstudents safe Instruction ‐ students have a qualified teacher, teachers have instructional aides, and classrooms havesupplies Curriculum and Staff Development ‐ curriculum, training and instructional support to ensure teachers areable to provide students with necessary knowledge and skills Food Services ‐ nutritious, affordable breakfast and lunch Library Services ‐ the library and librarian/staff provide research assistance and resources Counseling Services ‐ counselors for testing prep, college prep, drug/alcohol abuse programs, andsupporting family needs in seeking outside counseling School Leadership and Support ‐ principal, assistant principals and administrative support staff(Source: Round Rock ISD)Page 2
AASA White Paper: School Budgets 101Graphs 9 and 10 in Appendix A illustrate the percentage distribution for current expenditures for publicelementary and secondary education, by function, for the 2006‐07 school year. Graph 9 shows that 61 percentof budgetary expenses are related to instruction, followed by 35 percent for support services, 4 percent for foodservices, and less than 1 percent for enterprise operations. Trying to infer salaries from graph 9 is tricky,because salaries and benefits will be reflected across the categories, appearing in instruction, support servicesand enterprise operations. Generally speaking, a school district spends between 80 and 85 percent of its entirebudget on salaries and benefits, meaning only 15 to 20 percent remains to address all of the rest of the budget’spriorities and needs.Graph 10 examines the breakdown of instruction and instruction‐related expenditures. Salaries account for 67percent of the budget, followed by 22 percent for employee benefits, meaning that school districts have spentclose to 90 percent of their instructional budget on staff and benefits. Instructional supplies and purchasedservices each consume 5 percent of instruction‐related expenses, followed by tuition to out‐of‐state and privateschools (just over 1 percent) and ‘other’ (less than 1 percent).Where do the resources for school budgets come from? School budget resources come from a combination oflocal, state and federal contributions. The 2006‐07 school year is the most recent year for which we have a fulltabulation of the education funding contributions split between local state and federal government. Chart 4 inAppendix A illustrates that local and intermediate governments make a significant contribution (43.9 percent),slightly outpaced by state government (47.6 percent) and well above the federal contribution (8.5 percent).When it comes to processing the various sources, districts usually keep their state and local funds separate fromfederal funds. Federal funds (especially grants, competitive dollars, and those dollars outside of long‐termfunding commitments) represent budget uncertainty. Since the majority of school districts have to pass abalanced budget every year, school districts hesitate to assume or rely on federal dollars that may or may notcome into fruition. Three federal funding streams are an exception to this rule and represent federal fundingprograms around which school districts do feel comfortable planning long‐term. These programs are Title I, IDEAand Perkins. These three programs have extensive funding commitments and expenditures at the local level,especially related to personnel, programs and equipment. Changes to the reliability of these programs woulddisrupt school budgeting in very profound ways, with jobs and critical equipment at stake.Another reason districts separate federal funds from state and local funds is that federal funds often come withadditional reporting and accountability requirements. As such, school districts treat federal funds separately, forease of monitoring and tracking federal dollars within complex district budgets.When are school budgets spent? School budgets are spent continuously throughout the year. School districtshave much discretion over state and local dollars, and will draw down on those account balances as needed andin accordance with state/local regulations. Federal dollars in school budgets are also spent throughout theschool year, with the rule of ‘first in, first out.’ That is, money is spent in the order that it is received: A schooldistrict cannot spend any of its Title I funds for the 2011‐12 school year until it exhausts its 2010‐11 school year.Just as important as when school budgets are spent is how they are spent. States and districts have 27 months—known as the ‘Tydings period’—to spend down their federal dollars. That is, most federal programsappropriated by Congress include a ‘carryover period’ provision. The Tydings Amendment (Section 421(b) of theGeneral Education Provisions Act (GEPA)) states that any funds that are not obligated or expanded at the end ofthe period for which they were appropriated remain available for the full 27‐month period of obligation.(Source: Texas Education Agency)Page 3
AASA White Paper: School Budgets 101Another point to consider is how the spending of formula dollars differs from that of competitive grant dollars.Formula grants, representing a more reliable stream of funding, are spent in a consistent, regular manner, withan understanding/expectation that the dollars will be there year in, year out. The same cannot be said forcompetitive grants, which by their very nature represent budget uncertainty as to not only what grant dollarswill be coming in, but also when they will become available and how many there will be. Formula dollars can bewhat we call ‘forward funded.’ ‘Forward funding’ is a provision of budget authority that becomes available forobligation in the last quarter of the fiscal year and remains available during the following fiscal year. That is, if adistrict has yet to expend the full amount of its Title I dollars in the last quarter of the fiscal year, that balance iscarried over—not erased—and remains available for the next fiscal (and school) year. This is where the ‘first in,first out’ rule would apply.Forward funding is typically not available for competitive grant programs. As such, school districts treat—andspend—these dollars differently. Grant programs are funded on a federal fiscal year. Because the grant dollarsare typically neither forwarded funded nor subject to the Tydings period, school districts will spendconservatively over the first six months so as to ensure they are not left without funds in the second half of thegrant year. As a result, school districts often find a surplus of grant monies they need to ‘dump’ at the end of theyear, since the money cannot be carried over. This is neither effective nor efficient spending. Funneling thesesame dollars through more budget‐reliable formulas (such as Title I) would allow more responsible, effectivespending and investment.How is this information related to the current federal budget proposal and economic realities at the locallevel? This budget primer, along with AASA’s ongoing survey series on the impact of the economic downturn onpublic schools, provides a rich, informative context in which Congress and the administration can work to makeappropriation and authorization policy decisions that provide schools with the budgetary stability they need tocarry out the long‐term innovation and reform that Congress and the administration are striving for and schooladministrators work hard to provide.AASA applauds the administration’s continued support for and investment in education within PresidentObama’s 2011 budget proposal. The emphasis on improving teaching and strengthening teachers and schoolleaders is an important step toward long‐term positive change in our schools. AASA also applauds the significantincrease in funding for ESEA.Competitive vs. Formula: The president’s budget proposal includes a 65 percent increase in the proportion ofdiscretionary education dollars distributed through competition programs, a significant policy decision to shiftdollars away from long‐time formula grant programs. While understanding the administration’s commitment torewarding and replicating successful programs and practices, AASA urges Congress to maintain formula grantsto provide a more reliable stream of funding to local school districts. Such a strong emphasis on competitionimplies that competition alone produces innovation and student achievement.School districts and systems need a certain level of financial stability to undertake the ambitious innovation andreform proposed by the president’s budget, a level of reliability and consistency that cannot be achievedthrough competitive funding. Formula‐driven funding represents the dedicated funding stream that allowsschool districts to appropriately plan for and invest in innovation and reform. AASA is concerned thatcompetitive grants would have a disproportionate negative impact on rural and small districts.Page 4
AASA White Paper: School Budgets 101With limited local resources, school districts do not have the time or the capacity to develop extensivecompetitive grant applications in order to be competitive. This will lead federal dollars away from students inpoverty and to districts that have the resources for grant writing teams.Economic Hardship: AASA would be remiss if we did not address the very trying economic environment schooldistricts are living with. The confluence of the end of ARRA funding and the delayed economic recovery(state/local recovery lags federal recovery by 18 to 24 months) represent a very real obstacle to schools as theytry to balance increased emphasis on innovation with ever slimmer operating budgets.AASA strongly encourages both Congress and the administration to recognize—and be prepared to react to—the possibility that the sizeable increase in federal education funding may not translate into funding increases atthe local level. As demonstrated with ARRA dollars, short of other revenue sources or left with no other option,some SEAs/LEAs may replace what had been programs funded by ARRA with these new federal dollars. In thosecases where federal dollars simply fill budget holes, it is very difficult to innovate and reform.IDEA: The federal government level funds its investment in special education, holding steady at its commitmentto 17 percent, less than half of the promised 40 percent of the national average per pupil expenditure.Congressional support for IDEA continues to hover below its high point of 18.6 percent in FY 2005. The FY11proposal of 11.6 billion, while a slight nominal increase, represents level funding when calculated as thefederal contribution, staying at 17 percent and effectively reducing the federal commitment at a time ofincreasing need. The burden for paying for special education will continue to be shifted to local districts, forcingschool districts to raise local taxes or cut general education programs. In these difficult economic times, thisremains an even bigger challenge. Congress must fulfill its commitment to schools and students throughout thecountry. AASA strongly supports Congress reaching the 40 percent level through mandatory funding of specialeducation.Mandatory funding IDEA would ensure school districts received the full federal commitment in just seven years.While the IDEA investment included in ARRA was significant, the impact of those dollars was limited. As one‐time funding, districts had difficulty spending ARRA IDEA dollars to expand services to students with disabilitieswithout knowing if the federal funding at that level (a temporary jump to 25 percent of the national average perpupil expenditure) would continue. The president’s budget does not make this commitment.Title I: As the economic recession pushes more students into poverty, the president’s proposal level funds Title I,despite the increased need. The proposed budget includes 14.5 billion for the College‐ and Career‐ReadyStudents program (formerly Title I Grants to LEAs).This is level funding from both FY09 and FY10 levels, andrepresents a cut, when adjusted for inflation and increasing demand. While ARRA Title I dollars represented asignificant increase in Title I funding for schools in the 2008‐09 and 2009‐10 school years, the ARRA Title Idollars—which played a vital role in supporting education budgets in states and districts that have yet to showsigns of economic recovery—will no longer be available in 2011‐12, a funding cut that will be compounded bythe proposal to level fund the FY11 levels.The content and information presented here is a general overview of school budgets. As such, specifics will varybetween both states and districts. If you have further questions about school budgets, the school budgetprocess or would like to contact a school administrator in your legislative district, please feel free to contact theAmerican Association of School Administrators. AASA would be happy to provide any available information andput you in touch with the leader of your local schools.Page 5
AASA White Paper: School Budgets 101Contact: Noelle Ellerson, Policy Analyst, American Association of School Administrators, nellerson@aasa.orgRESOURCES:Education Finance Statistics Center by U.S. Department of EducationSchool District Budgeting by William Hartman (1999)The School District Budget Process by Ed Scource (2006)Texas Education AgencyUnderstanding School District Budgets by Ed Source (2005)Where Does the Education Dollar Go? Round Rock ISD (2008)Page 6
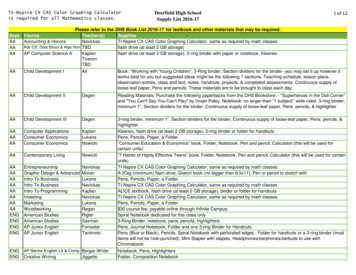
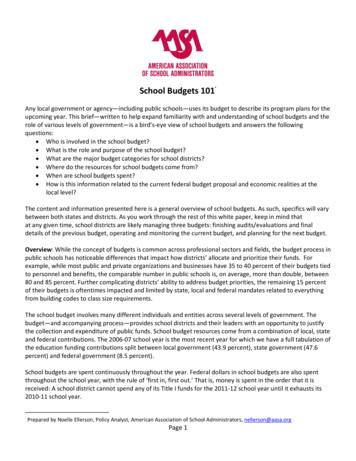
Appendix A: Graphs in Education FinanceAll charts in this section are from the Education Finance Statistics Center (http://nces.ed.gov/edfin) and itsRevenue and Expenditures by Public School Districts: School Year 2006‐07 (Fiscal Year 2007) report.Graph 1. Current per-pupil expenditures for public elementary and secondary education in theUnited States: 2006–071U.S. estimates are for the 50 states and the District of Columbia.
Graph 2. Current per-pupil expenditures for elementary and secondary education in the UnitedStates: 2006–07
Graph 3. Percentage distribution of total current expenditures for public elementar
Page 1 School Budgets 101 Any local government or agency—including public scho