Transcription
GUAVAEASYCYTESYSTEMS Expanding the potentialof flow cytometryThe life science business ofMerck KGaA, Darmstadt, Germanyoperates as MilliporeSigma in theU.S. and Canada.
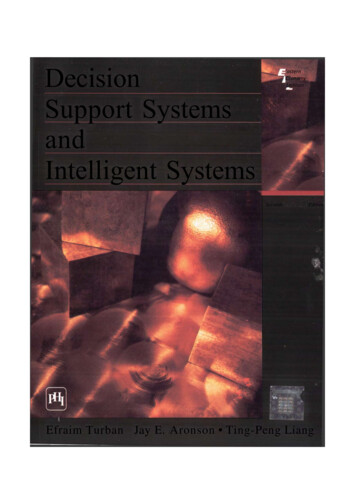
Guava easyCyte Systems Expanding the potential of flow cytometryUNLEASH WHAT’SPOSSIBLEOver fifteen years ago, Guava Technologies introducedthe first compact benchtop flow cytometers. Today,the Guava easyCyte line has been updated to offer upto 3 lasers and 14 parameters with greater sensitivityand optional high throughput capabilities. Poweredby intuitive software, the Guava easyCyte flowcytometers are some of the most dynamic and flexiblebenchtop systems available.Microcapillary Flow CytometryWasteSheath Fluid: None Up to 3 lasers and 14 parameters on a benchtopinstrumentWaste: 50 mL/8 hour runTypical # Cells:10,000 - 1,000,000 cells/mL Microcapillary fluidics design eliminates sheathfluid and waste carboys Accurate absolute cell counts via microcapillaryand positive displacement syringe pumpLaser High-throughput option for walk-away acquisitionof up to 96 samplesSample Flow Detection of particles as small as 0.2 μmFlow Cell Intuitive software includes comprehensivecell-health related assaysSample2
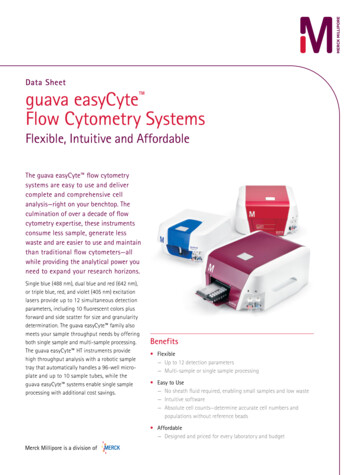
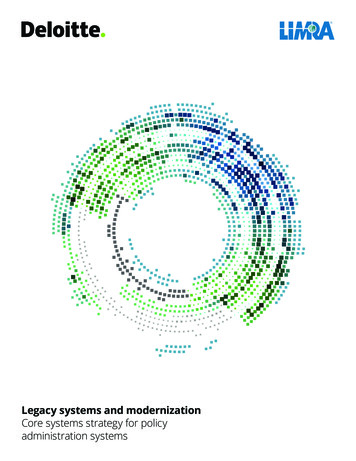
642 nm488 nm405 nm60GRN525/3YLW583/250RED-R661/15RE D695/NIR785/70Inside the Guava easyCyte 12HT systemsSSCBLU448/50FSCHow it WorksThe Guava easyCyte systems usepatented, microcapillary, laser-basedtechnology capable of detectingmammalian and microbial cells, particles,and beads. A sample of fluorescentlylabeled cells is aspirated into a uniquelyproportioned microcapillary flow cell.Forward and side scatter characteristics aredetected by photodiode, and fluorophoresexcited by the violet, blue, or red laser emitsignals that are spectrally filtered to resolveup to 10 fluorophores simultaneously.405 nm - Violet Laser488 nm - Blue Laser642 nm - Red LaserBlu - VGRN - VYEL - VRED - V(448/50)BV421 Cascade Blue(525/30)BV520 Cascade Green(583/26)BV605 (695/50)BV650 GRN - BYEL - BRED - BNIR - B(525/30)FITCAF 488(583/26)PE(695/50)PE-Cy5.5(785/70)PE-Cy7RED - RNIR - R(661/15)APCCy5(785/70)APC-Cy7APC-AF 7503
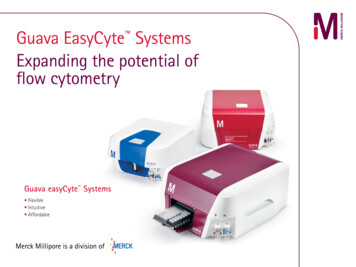
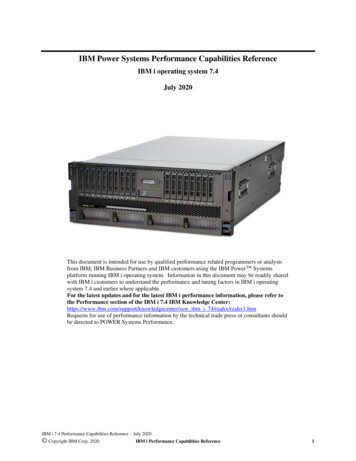
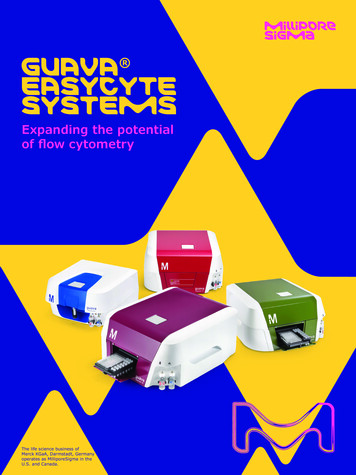
Guava easyCyte Systems Expanding the potential of flow cytometrySensitive and specificSpherotech 8-color beads analyzed on the Guava easyCyte 12HT system demonstrate the instrument’sproficiency for resolving adjacent fluorophores in multiple detection channels.Plot P02, gated on P01.R1Plot P05, gated on P01R1Cascade Blue MESF: 40PE-Cy5 MESF: 04100105Blue Fluorescence - 405nm laserPlot P06, gated on P01R1CountCount70401010103104100105NIR Fluorescence - 488nm laserPlot P04, gated on P01. R1CountCount701010104Yellow-B Fluor.a (YEL-B-ALog)Yellow Fluorescence - 488nm laser4105FITC MESF: 75704010310410040102103Plot P03, gated on P01. R1140100101102Red Fluorescence - 642nm laserFITC MESF: 25100101RED-R Fluores. (RED-R-ALog)Near IR-B Fluo.a (NIR-B-ALog)14010510040102104APC MESF: 5014070101103Plot P07, ungated100100102Red Fluorescence - 488nm laserPE-Cy7 MESF: 120140101Red - B Fluores (Red-B-ALog)Blue - V Fluores (BLU-V-ALog)105100101102103104Green-B Fluor. (GRN-B-ALog)Green Fluorescence - 488nm laser105
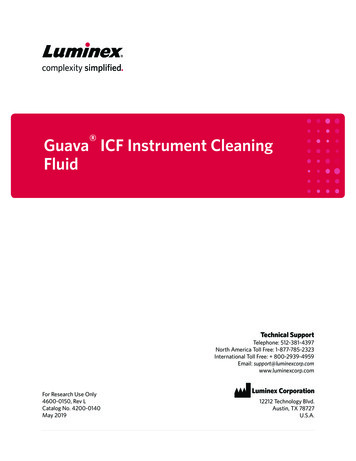
Immunological 2L FITC (GRN-B-HLog)9000070000CD3-103R6CD4 101102103104CD45RA APC (RED-R-HLog)CD3 101CD8 CD8 101102103104CD8 APC-Cy7 (NIR-R-HLog)104103104CD4 10210CD3 BV 421 (BLU-V-HLog)R6101103103102102CD3 1CD62L FITC (GRN-B-HLog)Plot P06, gated on P01.CD45 .CD3 .CDPlot P03, gated on PO1.CD45 .CD3 100CD3-CD4 PE-Cy7 (NIR-B-HLog)3000050000CD16 CD56 PE (YEL-B-HLog)0 10000Side Scatter (SSC-HLin)Plot P02, gated on P01.CD45 CD16&CD56 100CD45 CD19 102CD45 PerCP-Cy5.5 (RED-HLog)101103CD19 BV 510 (GRN-V-HLog)102100CD45 101Plot P05, gated on P01.CD45 .CD3 .CD10130000Plot P04, gated on PO1.CD45 .CD3-.R90 10000Side Scatter (SSC-HLin)Plot P01, ungated101102103104CD45RA APC (RED-R-HLog)10 μL adult human blood was stained for 20 minutes at room temperature with a cocktail containing anti-CD45PerCP-Cy5.5, anti-CD3 Brilliant Violet 421, anti-CD4 PE-Cy7, anti-CD8 APC-Cy7, anti-CD16 CD56 PE, anti-CD19Brilliant Violet 510, anti-CD45 RA APC, and anti-CD62L FITC. After incubation, cells were lysed and fixed with180 μL Guava lysing solution for 15 minutes at room temperature. Samples were then acquired on the Guava easyCyte 12HT system. Lymphocytes identified as CD45 were selected and subsequently gated into a SSC vs.CD3 plot. T cells (CD3 and CD45 ) were gated into a CD4 vs CD8 plot. CD4 and CD8 T cells were subtypedby evaluating each population using CD45RA and CD62L to differentiate naive from memory cells. To distinguishnatural killer (NK) and B cells, CD3-negative cells were gated into a plot comparing CD19 (B cells) and CD16 56(NK cells).5
Guava easyCyte Systems Expanding the potential of flow cytometrySoftwareInCyte Software: IntuitiveThe guavaSoft operating system software providesaccess to modules for acquisition and analysis, as wellas instrument setup and maintenance. The guavaSoft system includes templates for use with a wide rangeof MilliporeSigma flow cytometry kits to simplify yourexperiments and data collection. Additionally, theguavaSoft package includes InCyte , an intuitiveopen software package for custom analysis. Results canbe exported to spreadsheets or as industry-standardFCS 2.0 or 3.0 files for further analysis. GuavaSoft software includes 21 CFR Part 11-enabling features.Our InCyte software has an intuitive, easy-to-useinterface that enables you to focus on data at thesample or experimental level. The software simplifiessetup and analysis of plots with drag-and-drop features,while automated compensation makes it easy to performcomplex, multi-color assays. The instant update featureresponds in real time to change analysis conditions forviewing. The multiparameter heat mapping functionallows analysis of entire plates of data in the timepreviously required to analyze a single sample. Thesefeatures provide a simple and rapid means to attaina macroscopic view of experiment “hits” and easilycompare different experiments in real time. InCyte software is especially useful for interpreting the resultsof high-throughput cell-based assays.4325Plot PO2, gated on P01.R1MitoSense Red ( )Annexin V ( )4.44%103610140001026000Side Scatter (SSC - HLin)20001102103100101Forward Scatter (FSC - HLog)234567MitoSense Red (-)Annexin V (-)6.19%10010110489101112A102MitoSense Red (-)Annexin V ( )20.90%103104Annexin V CF488 (GRN - HLog10401001MitoSense Red ( )Annexin V (-)68.46%MitoSense Red (RED2 - HLog)8000104Count: 2746Plot PO1, ungated7Plot PO3, gated on P01.R17AAD (RED - HLog)103BC102DE8101F100GH100101102103Annexin V CF400 (GRN - HLog10491. Createand apply analysis methods acrossmultiple dat asets.2. Performcompensation during acquisition or analysisor use the automated compensation features.63.Drag-and-drop gating.4.View up to 24 plots at once.5.Refine gates in real time.6.Default or custom statistics.7.Multiple plot and gating options.8. Minimal gain adjustment needed when performingroutine assays.9.Analyze both tubes and plates.
InCyte Software Heat Map ViewHeLa 24 hoursHeLa cells in microtiter plates were treated with variouscytotoxic compounds for 24 hours. Cells were stainedusing MilliporeSigma’s MitoDamage, MitoCaspase, orMitoStress kits. Cells were acquired on the Guava easyCyte system and percent population data werecompared in a heat map format using our InCyte 1234567891011Software. The InCyte heat map function facilitatedthe rapid identification of compounds inducingpositive results, by comparison of all 5 parameterssimultaneously as shown in the pie charts above. Thedata show the results for cells treated with 80 differentcompounds in a single aspase3/7F7-AADGH020%20 40%40 60%60 80%Combine groups of data to constructheat maps, IC50, or EC50 curves.80 100%IC50 Determination within InCyte SoftwareIC50 determination using the Cytochrome c Kit wasanalyzed with the built-in IC50/EC50 curve fittingfeature of InCyte software. Cells were acquiredon the Guava easyCyte 8HT system. Plot A showsthe drag-and-drop gating strategy used for the IC50determination. Plot B shows the IC50 curve results forgambogic acid and Plot C shows the IC50 for etoposide.The once-complex task of generating the IC50 or EC50curve for a given compound is automated by InCyte based on quantitation of fluorescent signal.B.C.11 010-1100Response Level, %101Concentration1021030 1 0 20 3 0 40 5 0 60 7 0 80 9 0IC50 38µM0 10 20 30 4 0 50 6 0 70 8 0 90Response Level, %110A.IC50 4.9µM10-1100101102103C oncentration7
Guava easyCyte Systems Expanding the potential of flow cytometrySmall Particle DetectionThe Guava easyCyte 8HT and 12HT systems havebeen shown to detect particles as small as 0.2 µm, asignificant improvement over typical flow cytometers.This increased resolution and sensitivity meansbetter separation, making gating and identificationof dim populations easier. These capabilities mayprove particularly useful for researchers analyzingparticulates, beads, bacteria or algae.Side-Scatter (SSC-HLog)105Acquisition of a mixture of beads of known sizedemonstrates the ability of Guava easyCyte 12HTinstruments to detect and discriminate particles assmall as 0.2 µm.1041.3µm1030.8µm1020.4µm0.2µm10110 010 0101102103104105Forward Scatter (FSC-HLog)Turning algae into biofuelsGuava easyCyte systems are currently participating in algal biomass laboratories worldwide, where flowcytometry facilitates selection of high lipid content strains and efficient monitoring of cultures. Becausemicrocapillary systems require smaller sample volumes, generate significantly less waste, have lower operatingcosts, enable high sample throughput, and have a small instrument footprint, they are a natural choice fordemanding laboratory settings.B. Gated by Chlorophyll A150104113102CountSide Scatter (SSC-HLog)A. Not phyll A (RED-HLog)10310430High LipidContent Clone20CountC. Histogramsshowing varyinglipid content ofdifferent algaeclones102BODIPY (GRN-HLog)1050100101102103104BODIPY FluorescenceLipid measurement of chlorophyll A-positive algae. Identification of algal cells containing chlorophyll A; chlorophyll A fluoresces in the red channel(A). Gate applied to select for chlorophyll A-positive cells (B). Histograms showing a wide range of lipid content (as evidenced by BODIPY greenfluorescence intensity) for a variety of algal strains (C), with one clone showing as much as 500 times the lipid content as others.8
Flow Cytometry ReagentsOur diverse portfolio of reagents and assays facilitate fluorescence-based detection of proteins and nucleic acids,and have been validated for use on the Guava easyCyte instrument platform.FlowCellect Flow Cytometry KitsMilliporeSigma’s optimized, turnkey assay kits reducesample preparation time, minimize assay developmentand simplify data analysis.We offer more than 40 FlowCellect kits optimized forkey assays in cell health, immunology and cell signaling.The FlowCellect MitoDamage Kit for flow cytometrycontains MitoSense Red, a fluorescent cationic dye thataccumulates in the mitochondria and is responsive tochanges in mitochondrial potential, a hallmark of earlyapoptosis.0.75%1001013.7%10210310 410014.6%10010127.0%10210310 4Green Fluorescence(GRN-HLog)Annexin V, CF488A0.3%10 4103103102102101101Red2 Fluoresecence(RD2-HLog)MitoSense Red95.2%1003.2%1001011.3%102103Red Fluorescence(RED-HLog)10 4100 Violet450All of our flow-validated antibodies come with our 100%performance and satisfaction guarantee.Green Fluorescence(GRN-HLog)10 4 PerCP-Cy5.558.1%0.08%Live CellsDead CellsDepolarized Cells41.0%0.8%10010110210310 4Red Fluorescence(GRN-HLog)7-AADDot plots depicting Jurkat cells treated with multipleinducers and stained using MitoDamage kit. Dot plotsof cells treated or not with staurosporine to induceapoptosis and acquired on the Guava easyCyte12HT system show percentages of cells positive forMitoSense Red (left). The guavaSoft MitoDamagemodule facilitates experiment-level assessment ofchanges in mitochondrial potential that signal earlyapoptosis via heat mapping of up to 96 samples.Plot P03, gated on P04.R1.R2104100 APC-Cy7101102103CD4 (RED-HLog)104Plot P02, gated on P01.Live103101 PE-Cy7102101 PE-Cy51011023.7% APCIFNg-PE (YEL-HLog)10254.7% PE100103 FITCSide Scatter (SSC-HLin)1.1%103Red2 Fluoresecence(RD2-HLog)MitoSense Red94.4%2 µM Staurosporine10 4Choose from our growing portfolio of over1500 conjugated antibodies, including antibodiesspecific to many CD markers and immune signalingtargets. With the reliability and quality of Upstate,Chemicon and Calbiochem, MilliporeSigma’s conjugatedantibodies validated for flow cytometry are availablein multiple colors, to enable you to unequivocallydiscriminate cell subpopulations:0 10000 30000 50000 70000 90000Uninduced10 4Fluorescence-conjugated FlowCytometry Antibodies101102103104CD4-PerCP (RED-HLog)Mouse peripheral blood cells gated on lymphocytes(left) were stained with Milli-Mark FCMAB244CP5anti-mouse CD4 (clone GK1.5) PerCP/Cy5.5. CD4 Th1cells were identified (right) by costaining withFCMAB243P, anti-mouse IFN gamma (clone XMG1.2)PE. Data were analyzed with InCyte software on aGuava easyCyte HT cytometer.9
Guava easyCyte Systems Expanding the potential of flow cytometryGuava easyCyte Single Sample SystemsGuava easyCyteSingle Sample SystemCatalog No.Violet (405 nm) LaserBlue (488 nm) 50 mW LaserBlue (488 nm) 150 mW LaserGreen (532 nm) LaserRed (642 nm) LaserFSCSSCBlue-V (450/45 nm)Green-V (512/18 nm)Green-V (525/30 nm)Yellow-V (575/25 nm)Yellow-V (583/26 nm)Orange-V (620/52 nm)Red-V (695/50 nm)NIR-V (785/70 nm)Green-B (512/18 nm)Green-B (525/30 nm)Yellow-B (575/25 nm)Yellow-B (583/26 nm)Red-B (695/50 nm)NIR-B (785/70 nm)Yellow-G (575/25 nm)Orange-G (609/30 nm)Orange-G (620/52 nm)Red-G (695/50 nm)NIR-G (785/70 nm)Red-R (664/20 nm)NIR-R (785/70 nm)Microcapillary FluidicsDirect, Absolute Cell CountsAutomation-plate and tubesMixingDell LaptopInCyte SoftwareDigital Signal Processing1055 HPL6-2L80500-50050500-50090500-50070500-5008
Guava easyCyte HT SystemsGuava easyCyteHT SystemCatalog No.5HT5HT HPL6HT-2L8HT11HT12HTBG HTBGR HTBGV HT0500-40050500- 40090500-40070500-40080500- 40200500-4012050040150500-40250500-4030Violet (405 nm) LaserBlue (488 nm) 50 mWLaserBlue (488 nm) 150 mWLaserGreen (532 nm) LaserRed (642 nm) LaserFSCSSCBlue-V (450/45 nm)Green-V (512/18 nm)Green-V (525/30 nm)Yellow-V (575/25 nm)Yellow-V (583/26 nm)Orange-V (620/52 nm)Red-V (695/50 nm)NIR-V (785/70 nm)Green-B (512/18 nm)Green-B (525/30 nm)Yellow-B (575/25 nm)Yellow-B (583/26 nm)Red-B (695/50 nm)NIR-B (785/70 nm)Yellow-G (575/25 nm)Orange-G (609/30 nm)Orange-G (620/52 nm)Red-G (695/50 nm)NIR-G (785/70 nm)Red-R (664/20 nm)NIR-R (785/70 nm)Microcapillary FluidicsDirect, Absolute CellCountsAutomation-plate andtubesMixingDell LaptopInCyte SoftwareDigital Signal Processing11
Ordering InformationDescriptionCat. No.Single Sampling Instruments Guava easyCyte 5 Base System0500-5005Guava easyCyte 5HPL Base System0500- 5009Guava easyCyte 6-2L Base System0500-5007Guava easyCyte 8 Base System0500-5008 High Throughput Sampling InstrumentsGuava easyCyte 5HT Base System0500-4005Guava easyCyte 5HT HPL Base System0500- 4009Guava easyCyte 6HT-2L Base System0500-4007Guava easyCyte 8HT Base System0500-4008Guava easyCyte HT BG Base System0500-4015Guava easyCyte 11HT Base System0500-4020Guava easyCyte HT BGR Base System0500-4025Guava easyCyte 12HT Base System0500-4012Guava easyCyte HT BGV Base System0500-4030 MilliporeSigma400 Summit DriveBurlington, MA 01803To place an order or receive technical assistanceIn the U.S. and Canada, call toll-free 1-800-645-5476For other countries across Europe and the world, please visit: EMDMillipore.com/officesFor Technical Service, please visit: EMDMillipore.com/techserviceEMDMillipore.com 2018 Merck KGaA, Darmstadt, Germany and/or its affiliates. All Rights Reserved. MilliporeSigma, the vibrant M, FlowCellect, Guava,InCyte and guavaSoft are registered trademarks of Merck KGaA, Darmstadt, Germany or its affiliates. All other trademarks are theproperty of their respective owners. Detailed information on trademarks is available via publicly accessible resources.Ver. 1.02018 - 0955604/2018
Guava easyCyte Systems fl Expanding the potential of fiow cytometry Sensitive and specific Spherotech 8-color beads analyzed on the Guava easyCyte 12HT system demonstrate the instrument’s proficiency for resolving adjacent fluorophores in multiple detection channels. 100 140 Cascade Blue MESF: 40 Plot P02, gated on P01.R1 Blue - V .File Size: 2MB