Transcription
1
2
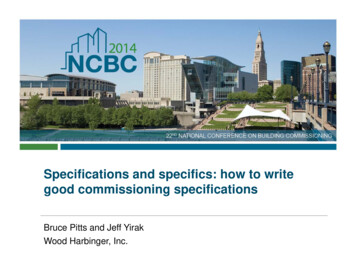
Good afternoon and thank you for joining me for this discussion about the proposedchanges to how automatic Health Professional Shortage Areas are scored.3
Health Professional Shortage Areas or HPSAs for short are a key to provider recruitment atcommunity health centers. They open the door to powerful recruitment tools including theability to offer providers tens of thousands of dollars in loan repayment on top of theirnormal salary in return for working at the Health Center. The funding for this loanrepayment comes from state and federal sources. Nationally Health Centers have almost5,000 providers that are receiving some kind of loan repayment via the National HealthService Corps.In addition, HPSAs allow Health Centers to offer medical students studying in the US theopportunity to stay and practice in the US via a waiver to the J1 Visa requirement that thestudent leave the US after completing medical school.4
There are multiple types of designations that health centers can have. CLICK
All Health Centers must be located in a Medically Underserved Area or Population. This isnot the same as a Health Professional Shortage Area and does not provide the recruitmentbenefits I spoke about earlier. The benefit of a Medically Underserved Area or Population isthe opportunity to start a Federally Qualified Health Center and the benefits that comewith this status. CLICK
Health Centers can be located in either a Geographic HPSA. Which means all the peopleliving in the area have a shortage of providers. CLICK
OR a Population Group HPSA. Which usually means that the population below 200% of thefederal poverty level has a shortage of physicians. CLICK
Some Health Centers are not located in Geographic or a Population Group HPSA.
For this reason in 2002 Congress passed legislation that gave all Health Centers, IndianHealth Services Facilities, and certain CMS certified Rural Health Clinics automaticHealth Professional Shortage Area Designation.
Note a Health Center can be in Both a Geographic and an Auto HPSA. The reason this isimportant is that a provider working at a health center can use either the auto HPSA scoreor the Geographic HPSA score when applying for NHSC.
Or a Health Center can be in both a Population Group HPSA and an Auto HPSA. Again, thisis important because a provider applying for NHSC can use either score.
So, what’s going on with Auto HPSAs? In August 2016 HRSA announced changes to thedata that would be used for scoring auto‐HPSA facility designations. These changeshad the potential to lower the auto HPSA score of many Health Centers. Afterpushback from stakeholders, HRSA retracted the announced changes and insteadformed a stakeholder working group with representation from Health Centers,Primary Care Offices, Indian Health Services, and Rural Health Clinics to decide onthe data sources to be used for auto HPSA designations. The working group was notable to reach consensus, instead sending multiple proposals to HRSA leadership fora final decision. We do not have a timeline on when HRSA leadership will make theirdecision.13
Please note, that Auto‐HPSAs are scored based on the same factors as geographicand low income HPSAS and The working group only had the latitude to proposedata sources for the factors, and did not have the latitude to suggest new ordifferent factors.14
For primary care and mental health the highest HPSA score that is possible is a 25. ForDental HPSAs the highest score possible is a 26. The factor with the most weight is thepopulation to provider ratio which is worth up to 10 points for primary care and dentalHPSAs. Because the population to provider ratio is worth so many points it was particularlyimportant to me that we get our recommendation for this factor as close to perfect aspossible. We also wanted to get right the# of the population living below 100% of thefederal poverty level and the distance to nearest source of care both of which are relativelyhigh scoring factors and applicable to all three disciplines.Note, each of these factors is there because the original authors of the HPSA methodologybelieved they helped paint a picture of the degree to which an area is in need of healthcare professionals. As we developed our proposal we tried to find data that get’s at theheart of what each factor is intended to measure for an auto‐HPSA.15
I think, the population to provider ratio is a reasonable way to determine if an area is ahealth professional shortage area. The more people there are for every physician thehigher the shortage of health professionals there are in an area.We looked at three ways to measure the population to provider ratio. The first is apopulation served approach. In this approach we take the number of medical patients in ahealth center and divide it by the number of primary care physician FTE at that healthcenter. We quickly discovered that this approach does not seem to accurately measure theshortage of health professionals in the area. Instead, this approach measures the patientpanel size that the health center has decided is appropriate. For example, using thisapproach on the national UDS data yielded a ratio of 1,795 patients for every 1 primarycare FTE. If we used this ratio to measure the shortage of primary care physiciansnationwide we would conclude that there is no shortage of primary care physicians. In fact,based on the HPSA scoring for this factor a ratio of 1,759:1 would score 0 points. TheHealth Center recommendation explicitly recommended against using a population servedapproach. CLICK. Instead, we recommended using a service area approach, which would bemore likely to show if the area the health center is serving is suffering from a lack ofprimary care providers. To determine the FTE side of the equation we recommended usinga survey of the primary care clinics in the health center’s service area or by using Medicaidclaims data whereby a set number of Medicaid claims would equal 1 FTE.16
To get a better measure of the shortage of physicians for the patients health centers serve,we recommended that both sides of the equation focus on people below 200% of thefederal poverty level. For the population side, that means the number of people below200% of poverty in the service area. For the FTE side of the equation, a good proxy islooking only at the FTE devoted to serving Medicaid and or sliding fee scale patients. Thus,a provider who works a full FTE and spends 25% of their time serving patients on Medicaidand 10% of their time serving patients on a sliding fee scale would be considered .35FTE.17
To accurately determine the degree to which an area has a shortage of primary carephysicians serving the low income we need the population and the FTE side of the equationto both originate from the same service area. So what happens if someone travels to theclinic from outside the service area and sees a physician at the clinic? In that case the 15minutes the physician spent with that patient are not actually available to the low incomepopulation of the service area. To adjust for this discrepancy we recommend multiplyingthe health center’s FTE by the % of patients that actually come from the service area.18
Let’s look at an example that combines both the low income adjustment and the non‐service area patient adjustment. Imagine, we are working on an auto‐HPSA for HealthCenter A. This health center has 12.5 primary care physicians and 80% of Health Center A’spatients use Medicaid or a Sliding Fee Scale. Thus, the health center has 10 FTE devoted toserving the low income. Now, lets say ,80% of Health Center A’s patients come from withintheir service area, while the other 20% of their patients come from outside their servicearea. Thus, only 8 FTE are available to serve the service area’s low income population.19
Now let’s say Health Center B is located within Health Center A’s service area and HealthCenter B has 10 low income FTE. Should we count all 10 of Health Center B’s FTE? .Without additional data we would have to, however, thanks to the ‘UDS data set’ we knowthat only 25% of Health Center B’s patients come from Health Center A’s service area. Andbecause we know this, we also know that about 25% of health Center B’s FTE are availableto the low income population of Health Center A’s service area. Thus, there are only 2.5 FTEat Health Center B available to serve the low income population of Health Center A. Thisexample, illustrates the first method we recommended for counting the FTE side of thepopulation to provider ratio.20
Health Centers collect a lot of data and that data is often readily available to them, some ofit is even publicly reported. Thus, if there were only health centers in a service area itwould be rather easy and fairly accurate to determine the population to provider ratiousing the methodology we described earlier. However, sometimes there are otherproviders in a health center’s service area that see patients who are insured by Medicaidand or offer a sliding fee scale to patients with no insurance. In this case, we often have torely on a survey of these clinics to determine the % of time their physicians spend withMedicaid or Sliding fee scale patients. Sometimes the survey respondent may be usingbilling data to answer this question, while other times the survey responder may take theirbest guess as to what percent of their patients fall into this category. With the lattermethodology we fear that there may be an unconscious or conscious bias to exaggerate.For this reason we recommended a second method for calculating low income FTE in theservice area. This methodology relies on Medicaid claims data for the Medicaid FTE part ofthe equation and continues to rely on survey data for the sliding fee scale part of themethodology.21
The two methodologies we put forward for calculating the population to provider ratiorequire that a service area be defined. We recommended that the service area be definedas the ZIP codes from which 75% of patients come from when the ZIP Codes are orderedfrom the ZIP code with the most patients to the least. See the table in this slide for anexample. In this example, the zip codes were ordered from the zip code with the mosthealth center patients to the zip code with the least health center patients. The 75%threshold was met when zip codes 1 through 6 were combined. Note, that although thethreshold is 75% it is possible that the % of patients that originate from the service area islarger than 75% as is illustrated in this example.22
We talked about pop to provider ratio now lets talk about % pop at 100% FPL.23
We just talked about how the population to provider ratio is calculated which is the firstfactor in an auto HPSA. Now we are going to take a look at the second factor in an autoHPSA which is the % of the population living below 100% of the federal poverty line. Theidea behind this factor is that the poorer people are the more barriers they have to healthcare resources. Nationally 15.5% of the general population is below 100% of the federalpoverty level, but 70.9% of health center patients nationally are below 100% of the federalpoverty level. Since the goal of auto HPSA scoring is to determine the facilities with thehighest need for additional health professional resources we felt that it is important to usethe poverty rate of the health center patients rather than the general population for thismeasure. Thus we recommended using UDS data for this measure.24
For primary care and mental health the highest HPSA score that is possible is a 25. ForDental HPSAs the highest score possible is a 26. The factor with the most weight is thepopulation to provider ratio which is worth up to 10 points for primary care and dentalHPSAs. Because the population to provider ratio is worth so many points it was particularlyimportant to me that we get our recommendation for this factor as close to perfect aspossible. We also wanted to get right the# of the population living below 100% of thefederal poverty level and the distance to nearest source of care both of which are relativelyhigh scoring factors and applicable to all three disciplines.Note, each of these factors is there because the original authors of the HPSA methodologybelieved they helped paint a picture of the degree to which an area is in need of healthcare professionals. As we developed our proposal we tried to find data that get’s at theheart of what each factor is intended to measure for an auto‐HPSA.25
The next factor in auto‐HPSA scoring is the distance or time to the nearest source ofaccessible care. We recommended using HRSA’s current shortage designation managementsoftware to find the nearest provider that serves patients using Medicaid AND a Sliding FeeScale. We also recommended that the nearest source of care should not be located in anytype of HPSA including another auto‐HPSA facility. HPSA and auto‐HPSA facilities bydefinition have a shortage of health professionals and thus can not be expected to be thenearest source of care for another area with a shortage of physicians. Different thresholdsneed to be used for urban vs. rural health centers. One way to achieve this is to use busroutes for times in urban areas.A second methodology we recommended, which would require more work to fully defineshould HRSA choose to go this route, is measuring the percent of patients that travel a longdistance to get care at the Health Center.26
For primary care and mental health the highest HPSA score that is possible is a 25. ForDental HPSAs the highest score possible is a 26. The factor with the most weight is thepopulation to provider ratio which is worth up to 10 points for primary care and dentalHPSAs. Because the population to provider ratio is worth so many points it was particularlyimportant to me that we get our recommendation for this factor as close to perfect aspossible. We also wanted to get right the# of the population living below 100% of thefederal poverty level and the distance to nearest source of care both of which are relativelyhigh scoring factors and applicable to all three disciplines.Note, each of these factors is there because the original authors of the HPSA methodologybelieved they helped paint a picture of the degree to which an area is in need of healthcare professionals. As we developed our proposal we tried to find data that get’s at theheart of what each factor is intended to measure for an auto‐HPSA.27
For the Infant Mortality Rate or Low Birth Weight we recommended using CDC orequivalent state data and weight that based on the Health Centers racial composition.Ideally, we would like to weight this data by the health center’s poverty data, however, wecould not find a source for Infant Mortality Rate or Low Birth Weight that broke the data upby poverty.28
For primary care and mental health the highest HPSA score that is possible is a 25. ForDental HPSAs the highest score possible is a 26. The factor with the most weight is thepopulation to provider ratio which is worth up to 10 points for primary care and dentalHPSAs. Because the population to provider ratio is worth so many points it was particularlyimportant to me that we get our recommendation for this factor as close to perfect aspossible. We also wanted to get right the# of the population living below 100% of thefederal poverty level and the distance to nearest source of care both of which are relativelyhigh scoring factors and applicable to all three disciplines.Note, each of these factors is there because the original authors of the HPSA methodologybelieved they helped paint a picture of the degree to which an area is in need of healthcare professionals. As we developed our proposal we tried to find data that get’s at theheart of what each factor is intended to measure for an auto‐HPSA.29
For fluoridated water we recommended using CDC or state equivalent data. This factoradds 1 point to a dental HPSA that where 50% or less of the population has access tofluoridated water.30
For primary care and mental health the highest HPSA score that is possible is a 25. ForDental HPSAs the highest score possible is a 26. The factor with the most weight is thepopulation to provider ratio which is worth up to 10 points for primary care and dentalHPSAs. Because the population to provider ratio is worth so many points it was particularlyimportant to me that we get our recommendation for this factor as close to perfect aspossible. We also wanted to get right the# of the population living below 100% of thefederal poverty level and the distance to nearest source of care both of which are relativelyhigh scoring factors and applicable to all three disciplines.Note, each of these factors is there because the original authors of the HPSA methodologybelieved they helped paint a picture of the degree to which an area is in need of healthcare professionals. As we developed our proposal we tried to find data that get’s at theheart of what each factor is intended to measure for an auto‐HPSA.31
For the mental health factors of Youth and Elderly Ratios we recommended using eitherUDS data or the American Community Survey. If the American Community Survey is usedwe recommended using a universe of people living below 200% of the federal povertylevel. Each of these factors is worth up to 3 points for mental health HPSAs.32
For primary care and mental health the highest HPSA score that is possible is a 25. ForDental HPSAs the highest score possible is a 26. The factor with the most weight is thepopulation to provider ratio which is worth up to 10 points for primary care and dentalHPSAs. Because the population to provider ratio is worth so many points it was particularlyimportant to me that we get our recommendation for this factor as close to perfect aspossible. We also wanted to get right the# of the population living below 100% of thefederal poverty level and the distance to nearest source of care both of which are relativelyhigh scoring factors and applicable to all three disciplines.Note, each of these factors is there because the original authors of the HPSA methodologybelieved they helped paint a picture of the degree to which an area is in need of healthcare professionals. As we developed our proposal we tried to find data that get’s at theheart of what each factor is intended to measure for an auto‐HPSA.33
For the alcohol and substance abuse rate, which are factors used for mental health HPSAs,we recommended using a number of SAMHSA data tables that look at alcohol andsubstance abuse from different lenses. For example, binge drinking, alcohol dependence,marijuana, illicit drugs, cocaine, opioids, etc. If at least one of the alcohol related tablesshows that the area is in the worst quartile nationally then the area would be awarded onepoint for that factor and the same for the substance abuse factor.34
The NACHC HPSA working group reviewed organizational vs. site level scoring. Ourconclusion was that the benefits of organizational site level scoring by far outweigh anybenefits from site level scoring. There are three main benefits with organizational levelscoring. First it is consistent with the federal regulation which states “facilities will bescored as an entity.” Second it gives health centers flexibility in placing providers recruitedthrough the national health service corps in the site where they are needed most. Third,organizational scoring allows us to use UDS data for certain factors and allows us to createa service area. In addition, we analyzed data for one state that was concerned about thisdecision and found that the difference between organizational vs. site level scoring wasminimal. Health centers with a site in an area with an extremely high population toprovider ratio may also choose to use their geographic or population group HPSA fornat
normal salary in return for working at the Health Center. The funding for this loan repayment comes from state and federal sources. Nationally Health Centers have almost 5,000 providers that are receiving some kind