Transcription
Electronic Arts Inc.Q4 FY 2021 ResultsMay 11, 2021
Safe Harbor StatementPlease review our risk factors on Form 10-Q filed with the SEC. Some statements set forth in this document, including the information relating to EA’s fiscal 2022 guidance information and title slate contain forward-looking statements that are subject to change. Statements including words such as “anticipate,” “believe,” “expect,” “intend,” “estimate,” “plan,” “predict,” “seek,”“goal,” “will,” “may,” “likely,” “should,” “could” (and the negative of any of these terms), “future” and similar expressions also identify forward-lookingstatements. These forward-looking statements are not guarantees of future performance and reflect management’s current expectations. Our actual resultscould differ materially from those discussed in the forward-looking statements. Some of the factors which could cause the Company’s results to differmaterially from its expectations include the following: the impact of the COVID-19 pandemic; sales of the Company’s products and services; the Company’sability to develop and support digital products and services, including managing online security and privacy; outages of our products, services andtechnological infrastructure; the Company’s ability to manage expenses; the competition in the interactive entertainment industry; governmental regulations;the effectiveness of the Company’s sales and marketing programs; timely development and release of the Company’s products and services; the Company’sability to realize the anticipated benefits of, and integrate, acquisitions; the consumer demand for, and the availability of an adequate supply of consolehardware units; the Company’s ability to predict consumer preferences among competing platforms; the Company’s ability to develop and implement newtechnology; foreign currency exchange rate fluctuations; general economic conditions; changes in our tax rates or tax laws; and other factors described in PartII, Item 1A of Electronic Arts’ latest Quarterly Report on Form 10-Q under the heading “Risk Factors”, as well as in other documents we have filed with theSecurities and Exchange Commission, including our Annual Report on Form 10-K for the fiscal year ended March 31, 2020These forward-looking statements are current as of May 11, 2021. Electronic Arts assumes no obligation to revise or update any forward-looking statementfor any reason, except as required by law. In addition, the preliminary financial results set forth herein are estimates based on information currently available toElectronic Arts.While Electronic Arts believes these estimates are meaningful, they could differ from the actual amounts that Electronic Arts ultimately reports in its AnnualReport on Form 10-K for the fiscal year ended March 31, 2021. Electronic Arts assumes no obligation and does not intend to update these estimates prior tofiling its Form 10-K for the fiscal year ended March 31, 2021.Refer to appendix for additional disclosures.2
Executing On Our Key Growth Drivers1. Delivering amazing games and content Launched 13 new games in the fiscal year, with It Takes Two in Q4.Recently acquired Codemasters, Glu Mobile, and Metalhead Software, increasing our reach in sports and on mobile.2. Offering live services that extend and enhance the experience In Q4, average daily active FIFA players were up 10% year-over-year, demonstrating continued engagement late intothe season. During the fiscal year, FIFA Ultimate Team players grew 16% and FUT matches were up 180%. During Q4, Apex Legends launched Season 8 and averaged over 12 M weekly average users. In FY21, Apex grewsteadily throughout, exceeding expectations, to deliver its second year of growth. In FY22, Apex is forecasted todeliver close to 20% growth to 750 M in net bookings. The Sims 4 delivered its sixth consecutive year of growth and has almost 36 million players life to date.3. Connecting more players, across more platforms, and more ways to play Welcomed 42 million new players to the EA network during the fiscal yearExpanded our portfolio to more platforms, including launching games on Steam, PS5, Xbox Series X/S, Stadia andNintendo Switch.Refer to appendix for additional disclosures.3
FY21 Financial Highlights Record net revenue Record net bookings Record operating cash flow Returned over 800 million to shareholdersRefer to appendix for additional disclosures.4
Financial SummaryQ4 FY21 ( in millions, except EPS)ActualsGuidanceNet revenue1,3461,317Operating expenses852837GAAP EPS0.26(0.07)GAAP net revenue overperformance was driven by live services, primarily Apex Legends.GAAP operating expenses came in very slightly above our expectations for the quarter, driven primarily by Codemasters opex, fees related to the acquisition ofCodemasters, and some fees relating to the acquisition of Glu.See following slides for further commentary on business drivers.Refer to appendix for additional disclosures.5
Key Business Drivers – Net bookings( in millions)Q4 FY21 Total net bookingsLive services & other1,490 115 million above guidance of 1,375 million, driven by outperformance of liveservices, particularly Apex Legends.1,303Outperformance driven by Apex Legends and FIFA Ultimate Team.Mobile showed its fourth consecutive quarter of year-on-year growth, withoutperformance led by Star Wars: Galaxy of Heroes and The Sims.Full game18762% of units sold through are now digital rather than physical compared to49% in the prior year period, measured on Xbox One/X/S, PlayStation 4/5over the last twelve months.Refer to appendix for additional disclosures.6
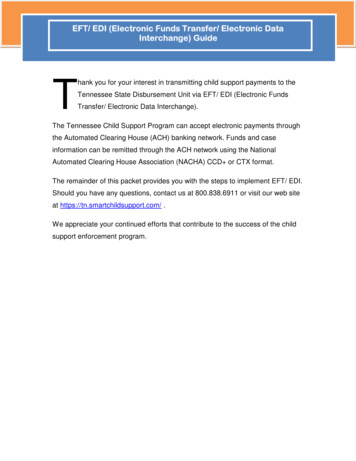
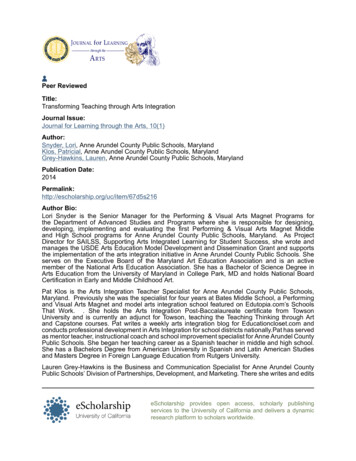
Growth: Topline to Cash(in ,8871,6133,1573,6504,016FY19FY20FY21Net Revenue1,9504,850FY22EFull GameLive Services& Other1,8405,3722,200Full Game5,100Live Services& Other**Our financial expectations for FY22include estimates of the impact of ourrecent acquisitions on consolidatedresults. The operating cash flow estimatescould be materially impacted as weintegrate these recent Net **Operating Cash FlowRefer to appendix for additional disclosures.7
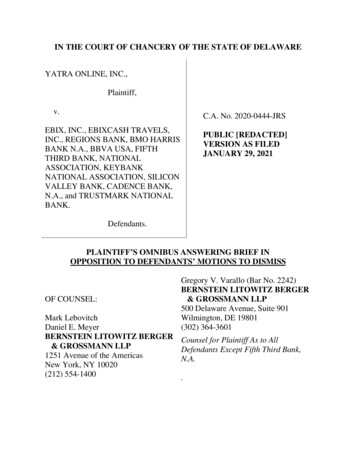
Net Bookings by Platform1,4901,411 19%6,1901,2565,1329509135,372 21%785310281346188190194Q4 FY19Q4 FY20Q4 FY21 15%4,097 11%1,310 34% 10%3,4633,683902977767712783Q4 FY19Q4 FY20Q4 FY21 23% 2%ConsolePC & OtherQuarterly (in millions) YoY GrowthMobileTrailing 12 Months (in millions) YoY GrowthRefer to appendix for additional disclosures.8
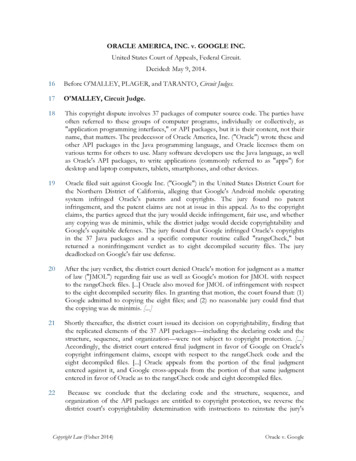
Net Bookings by Composition1,4111,2561,490 19%187-30%3465,1321,8401,3031,065 15%1,598-10%5,3722681,6576,1901,780 32%4,5929883,292 28%3,592Full GameQ4 FY19Q4 FY20Q4 FY21Quarterly (in millions) YoY GrowthQ4 FY19Q4 FY20Q4 FY21Live Services & OtherTrailing 12 Months (in millions) YoY GrowthRefer to appendix for additional disclosures.9
Expanding, Diversified Portfolio of Live ServicesActive Q4 FY21 Console/PCRefer to appendix for additional disclosures.10
Extending Power of Live ServicesNet bookings for total LiveServices and OtherFiscal 2018Fiscal 2019Fiscal 2020Fiscal 2021Refer to appendix for additional disclosures.11
Apex Legends Exceeds 1 Billion Life-to-Date Net Bookings in Q4 FY21“Apex delivered its largest net bookings quarter on record. It also delivered the bestday, the best 24-hour period, the best week, the best month and best in-gameevent. We suggested it would deliver over 1 billion in life-to-date net bookings bythe end of the quarter: it actually passed that milestone with half of the quarter togo. Fiscal 2021 was nearly double fiscal 2020.”-Blake Jorgensen, COO and CFOApex cumulative net bookingsFY19 Q4FY20 Q1FY20 Q2FY20 Q3FY20 Q4FY21 Q1FY21 Q2Refer to appendix for additional disclosures.FY21 Q3FY21 Q412
FY22 Announced Title SlateQ1Knockout CityMass Effect Legendary EditionQ3BattlefieldNHL 22Q2FIFA 22F1 2021Madden NFL 22Q4EA SPORTS PGA Tour Only announced titles with public launch dates are represented. In addition, we have announced platform expansion for Star Wars Jedi: Fallen Order on Xbox Series X and PS5. Titles are reflected in alphabetical order.Refer to appendix for additional disclosures.13
Mobile: Profitably Leveraging Our IP, Growing Our Portfolio with M&ARefer to appendix for additional disclosures.14
Fiscal Year Guidance Notes( in millions, except EPS)FY22ENet revenue6,800Cost of revenue1,828GAAP EPS1.34Operating cash flow1,750Net bookings7,300Our financial expectations for Q1 and FY22 include estimates ofthe impact of our recent acquisitions on consolidated results,including our acquisition of Glu Mobile on April 29, 2021. The GAAPand operating cash flow estimates could be materially impacted aswe integrate these recent acquisitions.Our EPS guidance calculation does not factor in share repurchase.Net bookings of 7.3 billion is 18% y/y growth, which includes the impact ofGlu Mobile, Codemasters and Metalhead Software.We expect to continue to drive strong organic growth in Apex Legends, andlayer on contributions from mobile in the back half of the year. In sports, weexpect Ultimate Team to be strong, we’re launching a new golf game, and F1.And then of course we’ll add Battlefield in the holiday season.Refer to appendix for additional disclosures.15
Fiscal Year GuidanceThe following table provides guidance for EA’s Fiscal 2022 financial performance. These preliminary estimates and expectations are based on currentinformation as of May 11, 2021 and are subject to business and economic risks and uncertainties that could cause actual events or actual future resultsto differ materially from expectations set forth herein. In addition, while EA does not provide expectations on non-GAAP financial performancemeasures, the following outlook for GAAP-based financial data and a long-term tax rate of 18% are used internally by EA to adjust our GAAPexpectations to assess EA’s operating results and plan for future periods.For more information about the nature of the GAAP-based financial data, please refer to EA’s Form 10-K for the fiscal year ended March 31, 2020.This information is also available in Excel format in our financial model at ir.ea.com.Twelve Months Ending March 31, 2022GAAP-Based Financial DataChange inAcquisition-deferred netGAAPrelatedrevenue (online-Stock-basedGuidanceexpensesenabled games)compensation500-(in millions)Total net revenue6,800Cost of revenueOperating expense1,8284,125790Income before provision for income taxesNet incomeNumber of shares used in computation:Diluted shares(40)(285)325500(575)575390292Refer to appendix for additional disclosures.16
Quarterly Guidance Notes( in millions, except EPS)Net revenueQ1ECommentary1,475Cost of revenue287Operating expense955GAAP EPS0.24Net bookings1,250Our EPS guidance calculation does not factor in share repurchase.Refer to appendix for additional disclosures.17
Quarterly GuidanceThe following table provides guidance for EA’s Q1 FY22 financial performance. These preliminary estimates and expectations are based on current informationas of May 11, 2021 and are subject to business and economic risks and uncertainties that could cause actual events or actual future results to differ materiallyfrom expectations set forth herein. In addition, while EA does not provide expectations on non-GAAP financial performance measures, the following outlookfor GAAP-based financial data and a long-term tax rate of 18% are used internally by EA to adjust our GAAP expectations to assess EA’s operating results andplan for future periods.For more information about the nature of the GAAP-based financial data, please refer to EA’s Form 10-K for the fiscal year ended March 31, 2020.This information is also available in Excel format in our financial model at ir.ea.com.Three Months Ending June 30, 2021GAAP-Based Financial DataAcquisition-Change in deferredGAAPrelatednet revenue (online-Stock-basedGuidanceexpensesenabled games)compensation(in millions)Total net revenueCost of revenueOperating expenseIncome before provision for income taxesNet incomeNumber of shares used in computation:Diluted 291Refer to appendix for additional disclosures.18
Currency AssumptionsCurrent FX assumptions1,2Net BookingsOperating ExpensesUSD/FY20 Q4AFY21 .26SEK9.598.298.72Rule of thumbIf the U.S. dollar strengthens 10% against the Euro and BritishIf the U.S. dollar strengthens 10% against the Canadian dollarpound sterling:and Swedish krona: With hedging, total net bookings decrease 3.5% Total net bookings decrease 0.5% Total cost of revenue and operating expenses decrease 2.0% With hedging, total cost of revenue and operating expensesdecrease 0.5%Note: Our financial guidance includes the forecasted impact of the FX cash flow hedging program.1 ForFY20 Q4A and FY21 Q4A, FX rates are a simple average of EA’s actual monthly P&L rates. For FY22, thesame FX rates are used for all forecast periods.2 Forall periods, FX rates are quoted using market convention.Refer to appendix for additional disclosures.19
Cash Flow Selected DataActualsCash Flow Data (in millions)Q4 2021Q4 2020Q4 TTM 2021Q4 TTM 2020Investing Cash Flow(444)(11)(505)(1,357)Financing Cash Flow526(300)(15)(1,358)Operating Cash FlowA3714981,9341,797Capital ExpendituresB3140124140A–B3404581,8101,657Free Cash FlowRecord Fiscal Year Operating Cash FlowRefer to appendix for additional disclosures.20
Appendix Net revenue, gross profit and operating cash flow are presented on a GAAP basis. Net bookings is an operating metric that EA defines as the net amount of products and services sold digitally orsold-in physically in the period. Net bookings is calculated by adding total net revenue to the change in deferred netrevenue for online-enabled games. A calculation of net bookings can be found in the “Net Bookings” tab of the Financial Model provided on our IRwebsite. During Q4 FY21, EA completed the acquisition of Codemasters Group Holdings plc. Codemasters was integratedinto EA for financial reporting purposes and EA’s financial results for Q4 FY21 and full year FY21 includeCodemasters’ financial results from and after February 18, 2021, the closing date of the Codemasters acquisition. During Q1 FY22, EA completed the acquisition of Glu Mobile Inc. Glu Mobile will be integrated into EA for financialreporting purposes in Q1 FY22. EA’s financial expectations for Q1 and FY22 include estimates of the impact of ourrecent acquisitions on consolidated results. GAAP and operating cash flow estimates could be materially impactedas we integrate these recent acquisitions. Forward-looking statements are valid as of May 11, 2021 only. Electronic Arts assumes no obligation to updatethese forward-looking statements, except required by law.21
Operating expense 4,125 (285) - (575) Income before provision for income taxes 790 325 500 575 Net income 390 Number of shares used in computation: Diluted shares 292 GAAP-Based Financial Data Twelve Mo