Transcription
RiskCalc: New Research andModel Validation ResultsDouglas Dwyer, Managing DirectorMay 2011
RiskCalc ModelsSeek to maximize predictive power, provided the model is:» Transparent» Intuitive» ReasonableExtract a risk assessment from the financial statements:» Localized to the specific accounting practices of the country» Makes an adjustment for industry differences» Assesses the current state of the credit cycleRiskCalc: New Research and Model Validation Results - May 20112
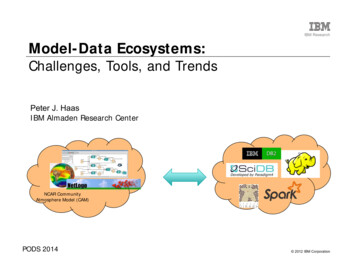
RiskCalc Statistically Combines the Risk Assessment of DifferentRatios into a Single EDFLiquidityRiskCalc combinesseveral relationshipsbetween ratios anddefault frequenciesin a consistent andobjective credit riskmeasure.ProfitabilitySizeActivityGrowth VariableLeverageDebt CoverageProbability of Default: EDFRiskCalc: New Research and Model Validation Results - May 20113
The RiskCalc Credit Cycle AdjustmentThe RiskCalc v3.1 model suite incorporates a forward-looking assessment of the creditcycle by drawing from Moody’s KMV Public Firm Model (e.g., CreditEdge/CreditMonitor).Since default risk varies with the credit cycle, we adjust private firm EDF credit measuresby implementing a cycle adjustment factor:» Based on a transformation of MKMV’s DD (Distance to Default) measure» Based on industry aggregates» Based on the public sector data, and» Is dynamic within the year (its value changes every month)RiskCalc: New Research and Model Validation Results - May 20114
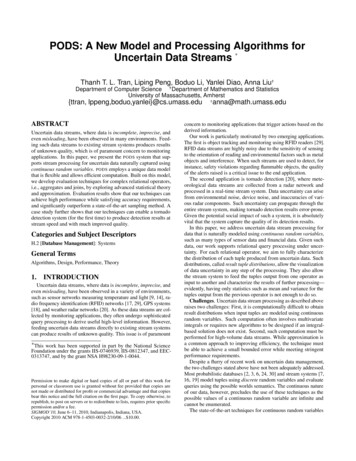
Conditional Versus Unconditional PD432Aggregate FactorMost credit risk models incorporatesystematic risk through an aggregatefactor(s). For a specific firm, the PD overa short time interval depends on both thevalue of the aggregate factor and thecharacteristics of the firm.10-0.501.001.502.002.50-1-2-3-4Time (in Years)1st percentile10th percentile90th percentile99th percentileMedianRiskCalc: New Research and Model Validation Results - May 20115
Conditional vs. Unconditional PDOver a fixed interval for a fixed path, onecould compute the PD given this path.This is a PD conditional on a specificscenario. The interpretation of this PD isthat it represents the idiosyncratic risk ofthe exposure given the aggregate factor.432Aggregate FactorOne could use the red dot to compute aStressed PD. This red dot would havethe interpretation that there is a 1 in a100 chance that your unconditional PDcould be at this value six months fromnow.10-0.501.001.502.002.50-1-2-3-4Time (in Years)1st percentile10th percentileMedian90th percentile99th percentileSample PathRiskCalc: New Research and Model Validation Results - May 20116
Moody’s Economy.com: Seven Macroeconomic Scenarios (US)» Baseline Scenario: Middle of the distribution of possible economic» Stronger Near-Term Recovery (“S1”) Scenario: This above-baseline scenario is designedso that there is a 10% probability that the economy will perform better than in this scenario anda 90% probability that it will perform worse.» Mild Second Recession (“S2”) Scenario: there is a 75% probability that economicconditions will be better, broadly speaking, and a 25% probability that conditions will be worse.» Deeper Second Recession (“S3”) Scenario: there is a 90% probability that the economywill perform better, broadly speaking, and a 10% probability that it will perform worse.» Complete Collapse, Depression (“S4”) Scenario: there is a 96% probability that theeconomy will perform better, broadly speaking, and a 4% probability that it will perform worse.» Aborted Recovery, Below-Trend Long-Term Growth (“S5”) Scenario: With this lowperformance long-term scenario, there is a 96% probability that the economy will performbetter, broadly speaking, and a 4% probability that it will perform worse.» Fiscal Crisis, Dollar Crashes, Inflation (“S6”) Scenario: With this stagflation scenario,there is a 90% probability that the economy will perform better, broadly speaking, and a 10%probability that it will perform worse.RiskCalc: New Research and Model Validation Results - May 20117
Moody’s Economy.com: three UK Macroeconomic Scenarios» Baseline Scenario: Middle of the distribution of possible economic» Mild Second Recession (“S2”) Scenario: there is a 75% probability that economicconditions will be better, broadly speaking, and a 25% probability that conditions will be worse.» Deeper Second Recession (“S3”) Scenario: there is a 90% probability that the economywill perform better, and a 10% probability that it will perform worse.» Severe Second Recession (“S4”) Scenario: there is a 96% probability that the economywill perform better, and a 4% probability that it will perform worse.Source: October 2010 U.K. Macroeconomic Outlook Alternative Scenarios from Moody’s Economy.comRiskCalc: New Research and Model Validation Results - May 20118
US Sales Growth vs. Unemployment 04200520062007200820092010-6%Sales GrowthUnemployment RateSales Growth is Median Annual Sales growth from Moody’s CRDUnemployment Rate is US total Unemployment rate, (%, SA) from Moody’s Economy.comRiskCalc: New Research and Model Validation Results - May 20119
Market Index vs. Annual Changes in arket Factor 981997-4.00Annual GDP GrowthDR Pr R 1 R 2 N 1 CDT DR is realized default rate in the sample. CDT is Central Default Tendency (long run EDF).With a market factor of and an idiosyncratic shock of .RiskCalc: New Research and Model Validation Results - May 201110
Changes in ROA vs. Annual Changes in 0%Changes in Return on 90-0.80%Annual GDP GrowthChanges in ROA is Median values from Moody’s CRDUS Annual Change in Gross Domestic Product from Moody’s Economy.comRiskCalc: New Research and Model Validation Results - May 201111
Market Index vs. Annual Changes in arket Factor20102009Annual GDP GrowthSuppose unconditional PD is EDF, we have .00 EDF Pr R 1 R 2 N 1 EDF N N 1 EDF With a market factor of an an idiosyncratic shock of .RiskCalc: New Research and Model Validation Results - May 201112
Implementing Stress Testing in RiskCalcSpecify a set of stress scenarios based on macroeconomic variablesEstimate a series of multivariate models to link the relevant macroeconomic variables to thekey financial statement risk drivers in Moody’s KMV RiskCalc modelForecast key EDF drivers under stress scenariosFor example,» Forecast sales growth based on stress scenario and back-out updated sales from salesgrowth» Assume costs remain the same» Forecast financial statement items based on stress scenario» Construct the forecast of default probabilities for private borrowers in various industriesunder the set of stress scenariosRiskCalc: New Research and Model Validation Results - May 201113
EDF Distribution of Stressed PortfolioBaa3Ba1% of total Sample20%The sample portfolio’saverage EDF is 2.36% andmedian is 1.22% (Medianimplied rating is Baa2). Understress scenario, average EDFmove up to 2.98% and medianincreased to 1.77% (Medianimplied rating is Ba3).15%10%5%Base SampleScenario 0.22% 0.22%0%On average, the increase inEDF is over 25%. Medianimplied rating has move up anotch.Sample portfolio with 835 borrowers.Hypothetical Scenario: Unemployment Rate in March 2011 is 8.8%. What ifunemployment rate continue to climb to 11% in the coming year?Corporate sales would decline by 3%. Let us assume that the cost remains thesame, EBITDA and NI decrease by 3% of total revenueRiskCalc: New Research and Model Validation Results - May 201114
Adding a Behavioral LayerWe are testing the following hypotheses:» Borrowers who have a long relationship with a specific bank are less likely to default withthat bank» Borrowers who deliver financial statements late are more likely to default» Borrowers classified as substandard at some point are more likely to default» Borrowers in industries with recently elevated default rates are more likely to default» Borrowers who have maxed-out their credit lines are more likely to defaultRiskCalc: New Research and Model Validation Results - May 201115
Combining Usage Data with RiskCalc EDFData is from eight US financial institutionsWe collect usage information quarterlyWe compute monthly EDF credit measures based on the latest available financialstatement and credit cycle of that particular monthSample Description# Quarters# Firms# DefaultsTime Period3550334027726842000-2010Usage level is higher for defaulted firmsUsage ratio is defined as total draw-down amount scaled by the total commitment amountOverallNon-DefaulterDefaulterUsage Ratio47.3%47.1%71.7%RiskCalc: New Research and Model Validation Results - May 201116
Usage Information Helps Improve the Accuracy ofDefault PredictionVariableAREDF only53%Usage only39%70% weight on EDF, 30% on Usage57%RiskCalc: New Research and Model Validation Results - May 201117
YieldIn the Middle Market, Risk-Based Pricing is LimitedRiskCalc Implied RatingPresents the yields on loans at in the US Credit Research DatabaseRiskCalc: New Research and Model Validation Results - May 201118
Overview» We compare model performance of (i) using qualitatives alone (ii) internalratings (iii) RiskCalc EDFs, and the (iv) combined score on their ability todistinguish defaulted firms and non-defaulted firms, using data from 2002 to2010.» The combined score’s Accuracy Ratio is over 5 points higher than that of theother models on both the full sample and pass rating sample.» We assess the economic value of a more powerful model and focus on thepass rating sample.» Using the most powerful model can create to 22 million of economic value ona 10 billion portfolio (22bps).RiskCalc: New Research and Model Validation Results - May 201119
SampleFinancial statements and internal ratings are from 11 US contributors to theCredit Research Database and have statements ending date between 6/20026/2009Defaults are predicted 6 to 18 months after the statement date of the financialstatements.3808 defaults with a default date between 06/2003-6/2010We exclude financial firms, real estate firms, non-for profit, and governmentorganizationsRiskCalc: New Research and Model Validation Results - May 201120
Sample ,7033817,673131Construction34,7661,004Consumer Products10,659209Mining cultureBusiness ProductsCommunication /High TechTotalAssets in millionStatementsDefaultsLess than 3mm124,9582,054Greater than 3mm111,3711,754Total2363293808RiskCalc: New Research and Model Validation Results - May 201121
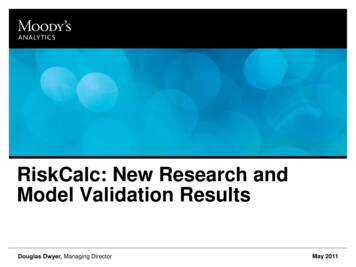
Model Performance806040Percent of Defaults6040Combined ScoreStandardized IRFSO EDFQualitative Score0020Combined ScoreStandardized IRFSO EDFQualitative Score20Percent of Defaults80100Full Sample100Pass Rating Sample0204060801000Percent of Statements20406080100Percent of Statements#Statements#DefaultsAR Combined AR QualitativePass Sample217,1932,67951.20%Full Sample236,3293,80856.20%AR IRAR EDF24.20%42.20%44.20%36.10%50.60%46.60%RiskCalc: New Research and Model Validation Results - May 201122
The Incremental Economic Value of a More PowerfulModel» A better PD model allows a bank to take more informed actions on the exposures in their portfolio» The actions a bank takes depends on both the risk and return profile of the exposure» Suppose the LGD is 60% and that the spread for each bucket 200bps» Suppose your strategy is to hedge/sell exposures for which the expected loss exceeds the spreadincome:– IFTHENPD LGD spreadSell or hedge» Defaults avoided is equal to the probability of hedging the exposure multiplied by the average of thebetter PD conditional upon being hedged» The savings is the defaults avoided multiplied by LGD less the loss in spread income» We test 4 credit risk measures using this approachRiskCalc: New Research and Model Validation Results - May 201123
We Construct a Theoretical Framework to Mimic thePower of the Qualitative ScoreQualitativeRisk BucketScore PD12345678910AverageSpreadProbability ofSellingProbabilityof Default ifSoldDefaultsAvoidedValue of RiskMitigation %0.24%2.01%Value on 10 Billion DollarPortfolio0.02%Value added by model 2,355,716RiskCalc: New Research and Model Validation Results - May 201124
We Construct a Theoretical Framework to Mimic thePower of the Internal RatingInternalRisk BucketRating PD12345678910AverageSpreadProbability ofSellingProbabilityof Default ifSoldDefaultsAvoidedValue of RiskMitigation 64%0.78%2.01%Value on 10 Billion DollarPortfolio0.10%Value added by model 10,063,434RiskCalc: New Research and Model Validation Results - May 201125
We Construct a Theoretical Framework to Mimic thePower of the RiskCalc EDFRisk Bucket12345678910AverageRC PDSpreadProbability ofSellingProbabilityof Default ifSoldDefaultsAvoidedValue of RiskMitigation 2.00%0.00%0.00%0.00%0.00%
cycle by drawing from Moody’s KMV Public Firm Model (e.g., CreditEdge/CreditMonitor). Since default risk varies with the credit cycle, we adjust private firm EDF credit measures by implementing a cycle adjustment factor: » Based on a transformation of MKMV’s DD (Distance to Default) measure » Based on industry aggregates