Transcription
smarterWall – Investor PitchAndrew DaileyMarina VainshteinKetu DesaiAmit RaybardhanCraig Perler
What is smarterWall?smarterWall is a new app platform that connects YourSmartphone to Social Screens in Bars, Restaurants,and Other Venues smarterWall is projected on screens ortelevisions in sports pubs, bars or casualdining establishments Patrons check-in to play games, socialize,and interact using their mobile devices The platform will support many apps: Jukebox, Photo Sharing, Trivia Games,Fantasy Sports, Twitter Wall, Dating andMingling Games, etc.
Bar owners are in pain Owners want to make their bars more funwith games and other social experiences To increase customer retention To increase money spent at their bars But current systems are expensive Large Physical Jukeboxes Complex Trivia Systems with remotecontrols Variety is limited Developers want to build apps to solvethis problem But each app must stand alone – highoverhead Sales Force Setup Costs for Bar Owners
Value PropositionFor Venue Owners:For Developers: Attract more customers New platform with less competition Opportunity for in-app purchasesand ad revenue share Easy to develop on differentiate the venue Keep customers in venue longer Social games act as ice breakers,encourage camaraderie increases stickiness of venue –customer retention New revenue stream (Possibly) internal message passingarchitecture provided Limits marketing costs smarterWall promotes the platformFor Consumers:For Advertisers: Play fun games, enjoy newexperiences Interact with friends in a fun newway Meet new friends Hyper-local targeted advertising Contextual advertising - near pointof purchase Encourage social discussion ofadvertising
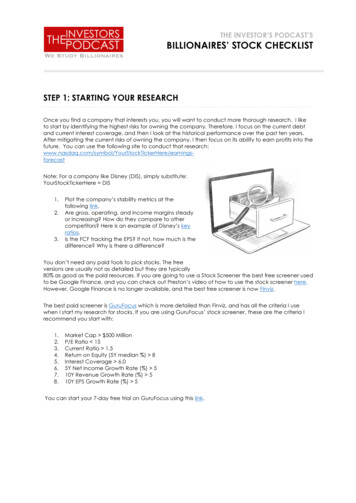
Why Now? Smartphone usage and mobile gaming in consumers has reached a critical mass Over 60% of 25-34 and more than 50% of 18-24 year olds now own smartphones More than 60% of smartphone owners (62%) have downloaded apps on theirdevices and games are the top application category used in the past 30 days The number of smartphone subscribers using the mobile Internet has grown 45percent since 2010* Bar customer demographics have shifted and bars need new revenue streams Bar industry is mature with flat revenues (-0.23%)for 2008-2011 50.5% of Bar and Restaurant customers are 18 to 45 year olds Only 1.3% of Bar and Club revenues come from games and slot machinesBar customer demographics (2012)Bar revenues (2012)*Source: December 2011, Nielsen State of the Media: Mobile Web Report
Target MarketPrice PointExpensiveCustomer Profile: 21 to 45 year old Smartphone user 35K Income Urban or llegeBars
CompetitionMobile phoneLabsYYYEvent focusedBuzztime esTwitter YNNEvent focusedArcade GamesGoldenTeeN*YNPhysical GamesPool, ractiveGamingNamesmarterWall is first interactive web-based interactive gaming platform using customersmobile devices and made for bars and entertainment venues
Market Size Initial Bar Market Opportunity of 800 – 900 million.Initial Bar Market Opportunity(in )Total Number of U.S. Food and Drinking EstablishmentsApproximate Number With TelevisionAdvertising Cost / Venue / MonthTotal616,34735,000 400 168,000,000Total App Purchases / Customer / YearPrice / AppAverage Number of Customers / Year / VenuePercent of Customers that PurchaseTotal Number of Customer Purchases / YearTotal75 2.002,7005%4,725,000 708,750,000Total Market Size 876,750,000Sources: http://www.census.gov/econ/susb/ , http://www.directv.com/see/landing/dtv onthego.html , http://www.emarketer.com/PressRelease.aspx?R , ventory-is-growing-atstaggering-rates/ , http://nces.ed.gov/programs/digest/d10/tables/dt10 108.asp ,Internal Estimates
Market Size With opportunities to grow into additionalsegments totaling 1.5 billion.Potential Growth Strategies(in )Total U.S. Trade Show / Conference / Convention Visitors / YearCost / VisitorTotal Conference / Trade Show / Convention Market Size205,000,000 5.00 1,025,000,000Number of Computers with Internet Access within US Public SchoolsPrograms / ComputerRate / ComputerTotal at School Computer Market15,162,0003 2.00 90,972,000.00Total Number of Primary Education StudentsTotal Number of Secondary Education StudentsPrograms / StudentRate / StudentTotal at Home Computer MarketTotal Education Market SizeTotal Additional Market Opportunity37,900,00026,100,0003 2.00 384,000,000.00 474,972,000.00 1,499,972,000.00Sources: http://www.census.gov/econ/susb/ , http://www.directv.com/see/landing/dtv onthego.html , http://www.emarketer.com/PressRelease.aspx?R 1007880 onomicSignificanceStudy/ESSKeyFindings.aspx , ventory-is-growing-atstaggering-rates/ , http://nces.ed.gov/programs/digest/d10/tables/dt10 108.asp ,Internal Estimates
Business Model To encourage wide-scale adoption smarterWall willbe free for venue owners Advertising and App sales will drive revenue Advertising: Potential advertisers include beer, alcohol, and localrestaurants Price / Venue based advertising 200 - 500 per month App sales: Price / App range from 1 - 4 As we gain momentum, additional revenue sourcesinclude: Subscription: either venue owners or consumers Advanced Software Program
Financial ProjectionsOperating Margins20%10%0%Year 1Year 2Year 3Year 4Year 5-10%-20%Key Assumptions: Price / App: 1.50 - 2 Revenue 50 /50 Split 0-25% of Customers Purchase Apps Advertising Rate: 200 - 350 /Month 50% COGS 7.5% G&A 12.50% - 15% R&D-30%-40%-50%-60%-70%-80%-90%* See Appendix for Assumptions
Phased Customer Acquisition Plan Phase 1 WebsiteDirect SalesSEOShort-Term LoanerUnitsSocial and earnedmedia and bloggingTradeshowsOn Location-DemosHosted Game Nights Phase 2 SEM Targetingcorporate-ownedvenues Public Relations Mobile in-appAdvertising Display advertising Professional video
Customer Acquisition StrategyBARSUSERS 125/bar 0.26/user Website Phone and EmailDirect Sales Campaign Utilize Gaming Blogsand Magazines 393/bar 0.35/user Industry Tradeshows Website SEO Campaign Social network pages(Twitter and FB) Free Games 150/bar 0.17/user Direct Sales –On-location Demos 300/bar 0.17/user Installation Hosted Game Nights Short term Loaner Units* Year 1 Assumptions: 100 Bars and 30,000 users
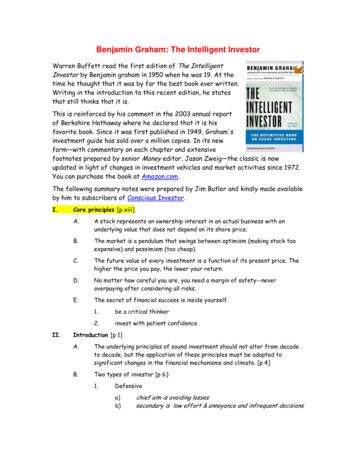
Consumer Survey Takeaways Number of Respondents N 98 Current Smartphone Gaming 62% currently use smartphones to play games Games Impact Bar Attendance 55% said availability of bar games affects the length of time at a bar 47% said availability of games affects whether they attend a barHow often would you play a social game projectedon a TV or screen in a bar using your smartphone?
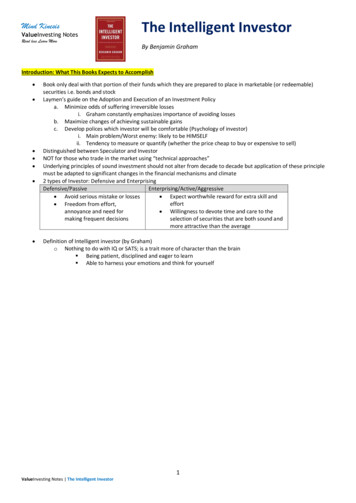
Consumer Survey Takeaways Most Appealing Games 80% Trivia; 48% Board-Style Games; 36% Puzzle Games Willingness To Pay – 27% are Willing An average amount 4.24 per bar visit An median amount 1.63 per bar visitWhat kind of mobile and social gameswould be most appealing to you to play?
Venue Owner InterviewsWe did some marketresearch Not every bar expressed interest, but there’s awell-understood segment of bars that did: Sport bars and those with younger demographics. Bars with televisions already in place. Bars with a well-defined off-peak period.
Technology for Minimum Viable Product MVP Requirements: Must support real-time messagingWall and Phone powered by web browsersNeeds only simple stylingLocation-based check-in not necessaryOne simple demo application: TriviaBasic API to support switching apps Technology Stack: Server: Ruby & FAYE (Publisher/SubscriberMessaging Framework) Client: JavaScript & Twitter Bootstrap (SimpleStyling)
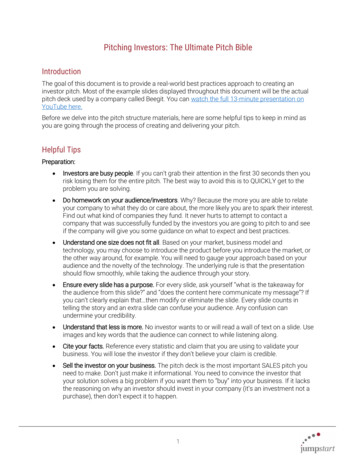
Working Prototype – Splash Page
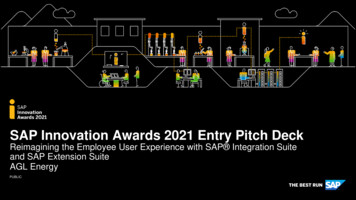
Working Prototype - WorkflowLaunch PagePhone InterfaceWall Interface
Management TeamAndrew DaileyAmit Raybardhan Cornell ‘06, Computer Science PwC, Cisco, Eversplosion Boston University ’05, MSEEElectrical Engineering IBM, iRobot, Jefferies & CompanyMarina VainshteinCraig Perler UC Berkeley ’04, BusinessAdministration, CPA PwC, Deloitte, Time, Inc. Dartmouth ‘04, Computer Science,Economics, Music Highbridge Capital, RBS, FerrandConsultingKetu Desai BA Stony Brook ‘04, MA NYU Econ’05 Credit Suisse M&A, LighthouseInvestment Partners
Proposed Deal Company is primarily bootstrapped Looking for 200K investment build out sales forcepurchase advertisingacquire demo equipmentadd developers Detailed terms to be determined
Wrap-up Questions? Optional Product Demo Next Steps?
Detailed Value Proposition For Venue Owners/Hosts/Sponsors: It is an opportunity for sports pubs, bars,and casual dining establishments to improve their appeal by offering casualinteractive and social gaming experiences venues. The games will serve as an icebreaker and increase camaraderie among patrons. They will make venues moreenjoyable for patrons and increases ‘stickiness’ and loyalty of the customers. It alsoprovides a new revenue stream and the opportunity to increase the average revenueper patron, but expanding the appeal of their establishment to new and existingclientele. For Consumers: It will enable consumers to compete against, play andinteract with friends and fellow patrons at their favorite bar or restaurant using theirsmartphone. Watch and share the fun as the game is broadcast on the venue'sscreen(s) For Advertisers: It is an opportunity to drastically increase ad effectiveness withinteractive and highly-targeted display ads woven into the game screen. Thoughprimarily focused on display ads, some games, will offer an opportunity for video adsas well. Our product also provides advertisers an opportunity to target hyper-localaudiences in a new medium which previously has seen very little, if any, advertising. For Developers: It will provide a whole new gaming platform on which to developinnovative new gaming apps. It brings interactive gaming to a new arena and is anopportunity to take advantage of the growth in the casual gaming market in a brandnew territory
Competitive Analysis
Market Testing Strategy Create a landing page, capture email, and solicit feedback Engage local bars to demonstrate potential applicationsduring course of business Survey Bar owners and management for: Current use of electronic games Revenue from electronic games How much are they willing to pay for a system Actively engage customers at the bar to participate andsolicit feedback on: Willingness to play and interact with other patrons? How much are they willing to pay to play? Gather emails of customers and send survey Use survey results to modify product Repeat process until we’ve found some success
Customer Acquisition CostsPER BARYear 1Year 2Awareness & Consideration 125.00 68.75Inbound and Outbound Leads 393.00 98.25Qualified Leads 150.00 150.00Opportunities 300.00 300.00 968.00 617.00PER USERAwareness & Consideration 0.26 0.08Inbound and Outbound Leads 0.35 0.11Qualified Leads 0.17 0.20Opportunties 0.17 0.20 0.95 0.58*Assumptions: Yr 1: 100 Bars/30,000 Users Yr 2: 400 Bars/100,000 Users
Financial ProjectionsYear 1Year 2Year 3Year 4Year 2,380,000Total Sports Bars with TVVenue Owner UsersTotal New UsersTotal 0001,630,000Application RevenueTotal AppsPercent Paid AppsPaid AppsAverage Price / AppPercentage of Users that PurchaseTotal Customer PurchasesPercentage of Revenue from Sales to smarterWallTotal smarterWall RevenueRevenue / User100.00%0 1.500% 050% 0 0.002030.00%6 2.0025% 90,00050% 45,000 1.502040.00%8 1.5025% 150,00050% 75,000 1.154040.00%16 2.0025% 800,00050% 400,000 3.084040.00%16 1.5025% 2,400,00050% 1,200,000 2.586040.00%24 2.0025% 9,000,00050% 4,500,000 5.115040.00%20 1.5025% 3,000,00050% 1,500,000 1.737040.00%28 2.0025% 10,500,00050% 5,250,000 3.228040.00%32 1.5025% 4,800,00050% 2,400,000 1.9010040.00%40 2.0025% 15,000,00050% 7,500,000 3.15Advertising RevenueCost / Venue / MonthTotal Number of VenuesTotal RevenuePercentage of Revenue from Sales to smarterWallTotal smarterWall RevenueRevenue / Venue 200.0050 120,00050% 60,000 1,200.00 225.00100 270,00050% 135,000 1,350.00 250.00200 600,00050% 300,000 1,500.00 300.00400 1,440,00050% 720,000 1,800.00 300.00450 1,620,00050% 810,000 1,800.00 350.00650 2,730,00050% 1,365,000 2,100.00 300.00700 2,520,00050% 1,260,000 1,800.00 350.00900 3,780,00050% 1,890,000 2,100.00 300.00950 3,420,00050% 1,710,000 1,800.00 350.001,150 4,830,00050% 2,415,000 2,100.00Total RevenueCOGSGross Profit 60,00050.00% 30,000 180,00050.00% 90,000 375,00050.00% 187,500 1,120,00050.00% 560,000 2,010,00050.00% 1,005,000 5,865,00050.00% 2,932,500 2,760,00050.00% 1,380,000 7,140,00050.00% 3,570,000 4,110,00050.00% 2,055,000 9,915,00050.00% 4,957,500Per Bar Acquisition CostTotal Bar Acquisition Cost 968.00 48,400 968.00 96,800 617.00 123,400 617.00 246,800 400.00 180,000 400.00 260,000 400.00 280,000 400.00 360,000 400.00 380,000 400.00 460,000Per UserTotal New User Acquisition Cost 0.95 14,250 0.95 28,500 0.58 29,000 0.58 58,000 0.50 200,000 0.50 375,000 0.50 200,000 0.50 375,000 0.50 200,000 0.50 375,000Total Cost Acqusition CostG&AR&DOther ExpenseTotal Cost 62,6507.50%15.00%5.00% 79,150 125,3007.50%15.00%5.00% 174,800 152,4007.50%15.00%5.00% 255,525 304,8007.50%15.00%5.00% 612,800 380,0007.50%12.50%5.00% 882,500 635,0007.50%12.50%5.00% 2,101,250 480,0007.50%12.50%5.00% 1,170,000 735,0007.50%12.50%5.00% 2,520,000 580,0007.50%12.50%5.00% 1,607,500 835,0007.50%12.50%5.00% 3,313,750Total Operating ProfitTotal Operating Margin( 49,150)-81.92%( 84,800)-47.11%( 68,025)-18.14%( 52,800)-4.71% 122,5006.09% 831,25014.17% 210,0007.61% 1,050,00014.71% 447,50010.89% 1,643,75016.58%
Initial Market Research ―User Survey
Old Splash Page
How often do you check in to bars onFoursquare / Facebook Places?
How often do you play games on asmartphone?
What games do you typically play inbars or restaurants?
Does the availability of bar gamesaffect whether or not you attend aparticular bar?
How often does the availability of bargames affect the length of time youstay at a bar?
If it existed, how often would you playa social game projected on a TV orscreen and compete against others ina bar using your smartphone?
On the system described above, whatkind of mobile and social games wouldbe most appealing to you to play?
Would you spend money to play thesetypes of games at a bar?
If you answered yes to the previousquestion, how much would you spendto play one of these games at a bar(per visit) Average Projected Spending 4.24 per bar visit Median Projected Spending 1.63 per bar visit
smarterWall is a new app platform that connects Your Smartphone to Social Screens in Bars, Restaurants, and Other Venues smarterWall is projected on screens or televisions in sports pubs, bar