Transcription
THEFUTUREOFFAIR HOUSING andFAIR CREDITSponsored by: W. K. KELLOGG FOUNDATIONSubprime Lending in the City ofCleveland and Cuyahoga CountyJEFFREY D. DILLMANHousing Research & Advocacy CenterPRESENTED BYKIRWAN INSTITUTEFOR THE STUDY OF RACE AND ETHNICITYTHE OHIO STATE UNIVERSITY
The Kirwan Institute for the Study of Race and Ethnicity is a university-wideinterdisciplinary research institute. We generate and support innovative analyses thatimprove understanding of the dynamics that underlie racial marginality and underminefull and fair democratic practices throughout Ohio, the United States, and the globalcommunity. Responsive to real-world needs, our work informs policies and practicesthat produce equitable changes in those dynamics.
Subprime Lending in the City of Cleveland and Cuyahoga CountyJeffrey D. Dillman1IntroductionThe effects of the current economic crisis have had devastating effects on nearly everyarea of the country. States such as Arizona, California, Florida, and Nevada, where“exotic” loans such as option-ARMs and interest-only mortgages were common, havefaced unprecedented foreclosure rates and declines in property values. While the declinein property values in many Rust Belt cities have not been as great, the economic situationin many of these cities is in many ways equally, if not more, desperate. Having sufferedthrough the decline in industrial manufacturing and resulting population loss, many ofthese cities never experienced the huge increase in home prices that had occurred on thecoasts. An examination of the rise in subprime lending in the City of Cleveland andsurrounding Cuyahoga County, Ohio, provides a useful example of what many of theseolder industrial cities have faced over the past fifteen years and of the challenges that thecurrent crisis presents.Cleveland reached its peak in population in 1950, when it was the seventh largest city inthe nation with a population of 914,808. However, beginning in the 1950s, Clevelandersbegan to leave the city, first to the inner ring suburbs, and eventually to regions furtherand further away. By 2000, Cleveland’s population was 478,403, and by 2005-2007, itwas estimated to be down to 405,014, just 44% of its peak in 1950.2In some Cleveland neighborhoods, the decline has been profound. For example, thepopulation of the Fairfax neighborhood on the east side of Cleveland dropped from39,380 in 1950 to 7,352 in 2000, an 81.3% decline. The population declines in theadjacent neighborhoods (which were between 93% and 97% African American in 2000)were nearly as high, with the Central neighborhood experiencing a population decrease of82.6% compared to 1950, the Hough neighborhood a 75.1% decrease, and the Kinsmanneighborhood a 73.6% decrease.31Jeffrey D. Dillman is the Executive Director of the Housing Research & Advocacy Center, a fair housingorganization in Cleveland, Ohio. He has a J.D. from University of California, Berkeley, School of Law(Boalt Hall), and a B.A. from the University of California, Los Angeles. The author wishes to thank CarriePleasants, Associate Director of the Housing Research & Advocacy Center, for assistance in generating theHMDA data used in this article, as well as for general editing suggestions, as well as Samantha Hoover andDana Cohen for research assistance.2U.S. Census Bureau, “Historical Census Statistics on Population Totals by Race, 1790 to 1990, and byHispanic Origin, 1970 to 1990, For Large Cities And Other Urban Places in the United States,” PopulationDivision Working Paper No. 76, February 2005, Table 36; U.S. Census Bureau, Census 2000; U.S. CensusBureau, “Population of the 100 Largest Cities and Other Urban Places in the United States: 1790 to 1990,”Population Division Working Paper No. 27, June 1998, Table 1.3Randell McShepard & Fran Stewart, “Rebuilding Blocks: Efforts to Revive Cleveland Must Start byTreating What Ails Neighborhoods,” (PolicyBridge, October 2009), pp. 5-6.1
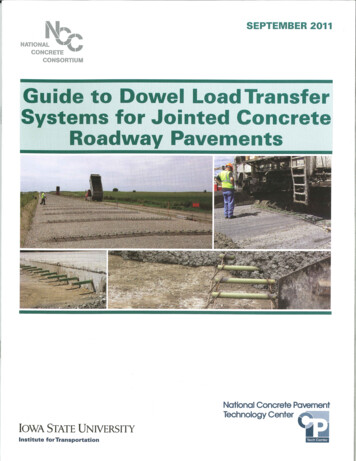
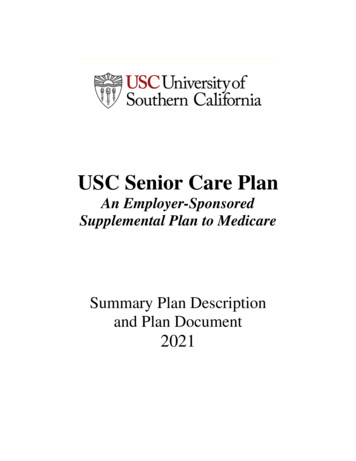
PopulationFigure 1The vast majority of the decline inCleveland’s population has been due toPopulationthe decrease in its white population, asCity of Clevelandcan be seen in Figure 1.4 In 1930,1,000,000whites accounted for 91.90% of the900,000800,000City’s population, with African700,000Americans making up 8.00%. By600,000500,0001950, the African American population400,000of Cleveland had doubled to 16.20%,300,000200,000while the white population had100,000dropped to 83.70%. In the next 300193019401950196019701980199020002005-07years, Cleveland’s African AmericanYearpopulation grew from 148,199 toWhite African American Other251,334, while the white populationdecreased dramatically, going from 765,694 to 306,995. Although the rate of white flightdecreased somewhat after 1980, the overall number of white residents, as well as thepercentage of whites in the City, continued to decrease so that by the 2005-07 period,African Americans outnumbered whites, accounting for 52.80% of the population (at213,847) compared to 39.40% (at 149,576).Cleveland was not alone in this trend. Census data shows that many Rust Belt citiesfollowed this same trajectory, reaching their peak population in the 1950s or 1960s,followed by declines that by 2000Table 1ranged from 49% to 80% of theirPopulation of Selected Rust Belt Citiespeaks.5 (See Table 1.) Whilecities such as Chicago andMaximumMilwaukee have retained much ofPopulation2000 Populationtheir peak population, others, such% ofas Buffalo, Detroit, and PittsburghCityNumber Year NumberMax.have experienced large populationAkron290,351 196074.76217,074Albany134,995 195070.86declines similar to Cleveland.95,658These changes in Cleveland’spopulation coincided withpersistent racial segregation forAfrican Americans. Prior to theCivil War, African Americans inCleveland “did not reside 43Source: U.S. 3U.S. Census Bureau, “Historical Census Statistics on Population Totals by Race, 1790 to 1990, and byHispanic Origin, 1970 to 1990, For Large Cities And Other Urban Places in the United States,” PopulationDivision Working Paper No. 76, February 2005, Table 36; U.S. Census Bureau, Census 2000 (for 2000data); U.S. Census Bureau, 2005-07 American Community Survey 3-Year Estimates.5U.S. Census Bureau, “Population of the 100 Largest Cities and Other Urban Places in the United States:1790 to 1990,” Population Division Working Paper No. 27, June 1998, Table 23 (for maximum data); U.S.Census Bureau, Census 2000 (for 2000 data).2
ghettos but lived throughout the city.”6 By the 1870s, however, the “ghettoization ofAfrican Americans [in Cleveland] had begun,” and what had been referred to as the “cityof immigrants” became “the segregated city.”7 The “Great Migration of the World War Iera accelerated the residential segregation and [by] 1930, twelve census tracts on thecity’s East Side were between 60 and 90 percent black.”8 In contrast to white ethnics,Cleveland’s African American population increased in size while becoming more, ratherthan less, segregated.9An examination of the dissimilarity segregation index shows dramatically the spatialsegregation African Americans faced – and continue to face – in Cleveland. Thedissimilarity index measures the percentage of a group’s population that would have tomove in order to have that group evenly spread throughout an area. A score of 100indicates complete segregation and that all of a group’s population would have to movein order to achieve integration, while a score of zeroTable 210African-Americanwould indicate that the area is completely integrated.Segregationin ClevelandWhile the methodology has varied somewhat over the11(DissimilarityIndex)years, as can be seen in Table 2, African Americansexperienced increasing segregation in Cleveland fromUnit of analysis1870 through 1940, when the level reached 92.0,1870 49.0 wardindicating that 92% of African Americans would have to1910 69.0 wardmove in order for them to be integrated evenly1940 92.0 blockthroughout the community.While the number dropped somewhat from 1980 through2000, the overall rate of segregation still placed theCleveland metropolitan area as the sixth-most segregatedregion in the country for African Americans based on thedissimilarity index, and the third-most segregated area 8blockblockblocktracttracttractDavid C. Perry, “Cleveland: Journey to Maturity,” in Cleveland: A Metropolitan Reader, W. DennisKeating, Norman Krumholz, & David C. Perry, eds. (Kent, OH: Kent State University Press, 1995), p. 22.During this pre-Civil War period, African Americans made up less than two percent of the population. Id.7Id., citing Kenneth L. Kusmer, A Ghetto Takes Shape: Black Cleveland, 1870-1930 (Urbana: Universityof Illinois Press, 1976), p. 17.8Edward M. Miggins, “Between Spires & Stacks,” in Cleveland: A Metropolitan Reader, W. DennisKeating, Norman Krumholz, & David C. Perry, eds., p. 193.9Id.10U.S. Census Bureau, “Racial and Ethnic Residential Segregation in the United States: 1980-2000,”August 2002, p. 8.11Sources: 1870 and 1910 data: Douglas S. Massey & Nancy A. Denton, American Apartheid: Segregationand the Making of the Underclass (Cambridge, MA: Harvard University Press, 1993), p. 21, Table 2.1;1940-1970: Massey & Denton, American Apartheid, p. 47, Table 2.3; 1980-2000: U.S. Census Bureau,“Racial and Ethnic Residential Segregation in the United States: 1980-2000,” August 2002, p. 69, Table 54. As Massey & Denton note (p. 31), the unit of analysis can affect the dissimilarity index rates, with theshift from wards to blocks adding at least 10 points to the index. The change from block to tract likelyresulted in a decrease in the scores from 1970 to 1980. See, e.g., John Iceland & Erika Steinmetz, “TheEffects of Using Census Block Groups Instead of Census Tracts When Examining Residential HousingPatterns,” U.S. Census Bureau Working Paper, July 2003. In addition, the earlier analyses examined theCity of Cleveland only, while the 1980-2000 analysis covered the entire Metropolitan Statistical Area,which includes five counties.3
the country considering an average of five segregation indices.12 During this period, theCleveland Metropolitan Statistical Area (MSA) actually became more segregated forHispanics/Latinos, with the dissimilarity index increasing from 57.5 in 1980 to 57.7 in2000, although the region moved from being the seventh-most segregated area forHispanics/Latinos to the eleventh-most, reflecting an increase in segregation in otherareas. 13 While this does indicate some improvement in terms of racial segregation ofAfrican Americans, that progress has been extremely slow, and at current rates, it willtake decades, if not centuries, for the region to become integrated.The Rise of Subprime LendingThe mortgage lending industry has undergone profound changes in the past fifty years.Historically, mortgage lending was conducted by depository institutions – savings andloans, banks, and credit unions – who primarily offered 30-year fixed rate mortgages.Loan decisions were, on paper at least, made based on the borrower’s ability to repay(evaluated primarily based on income) and the value of the collateral (i.e., the value ofthe home being purchased or refinanced). Evaluating these variables often entailedexamining a borrower’s debt-to-income (DTI) ratio, to ensure that the borrower hadsufficient income to pay the loan as well as any other debts and expenses and thereforewould be unlikely to default on the loan. The value of the collateral was measured usingloan-to-value (LTV) ratios, to ensure that, if the borrower did default, there was sufficientequity to allow the lender to recoup its investment after foreclosing on the property. Theunderlying assumption of these considerations was that lenders wanted to ensure thatborrowers had sufficient money to repay their loans. In the event that a prospectiveborrower did not meet the underwriting criteria set by the lender, he or she was denied aloan.This lending system worked well for many middle and upper income borrowers,especially whites, allowing them to become homeowners and accumulate wealth throughthe process. But residents of African American and Latino neighborhoods often weredenied access to mortgage credit through redlining based on the perceived risk of lendingmoney in those neighborhoods.14 Redlining dates at least to the 1930s, through the ratingsystem devised by the Home Owners Loan Corporation (HOLC) that coded the riskiesturban neighborhoods, which would receive few if any loans, with the color red. Citingthe research of Kenneth Jackson, Douglas Massey notes, “Black neighborhoods [were]always coded red, and even those with small percentages of black residents were usuallyrated as hazardous and placed in the lowest category.”15 Although the HOLC did notinvent the racialized standards that correlated real estate value to whiteness, it played akey role in institutionalizing them in policies which would later be adopted by federal12U.S. Census Bureau, “Racial and Ethnic Residential Segregation,” p. 69, Table 5-4.Jeffrey D. Dillman, Carrie Pleasants & Samantha Hoover, “The State of Fair Housing in Northeast Ohio:April 2009,” p. 20, citing U.S. Census Bureau, “Racial and Ethnic Segregation in the United States: 19802000.”14See, e.g., HUD Preamble I, 53 Fed. Reg. 44998 (November 7, 1988).15See, generally, Douglas S. Massey, “Origins of Economic Disparities,” in Segregation: The Rising Costsfor America, James H. Carr & Nandinee K. Kutty, eds. (New York: Routledge, 2008), 69-71.134
agencies such as the Federal Housing Administration (FHA) and Veterans Administration(VA). For example, a 1939 FHA underwriting manual warned against “inharmoniousracial or nationality groups” and stated that for neighborhoods to retain stability (andtherefore property values), “It is necessary that properties shall continue to be occupiedby the same social and racial classes.”16The social movements of the 1960s and early 1970s gave rise to an attempt to prohibitsome of the more abusive of these practices through the passage of the federal FairHousing Act,17 the Equal Credit Opportunity Act,18 the Home Mortgage Disclosure Act(HMDA),19 and the Community Reinvestment Act (CRA).20 Despite these statutes,numerous researchers have found continuing racial and ethnic disparities in mortgagelending.21 Early research into mortgage lending disparities often examined differences inloan denial rates in order to help gauge possible discrimination. To the extent thatAfrican Americans or Latinos (or other racial and ethnic groups) were denied loans at a16Id. at 71-72.42 U.S.C. §3601, et seq. Passed in 1968, the Fair Housing Act prohibited discrimination based on race,color, religion, and national origin. Later amendments prohibited discrimination based on sex (Housingand Community Development Act of 1974, Pub. L. No. 93-383, §808), as well as familial status andhandicap (Fair Housing Amendments Act of 1988, Pub. L. No. 100-430).1815 U.S.C. §1691, et seq. The Equal Credit Opportunity Act (ECOA), passed in 1974, prohibitsdiscrimination in the extension of credit based upon race, color, religion, national origin, sex, marital status,and age.1912 U.S.C. §2801, et seq. HMDA, passed in 1975, requires most mortgage lenders located inmetropolitan areas, including depository institutions as well as non-depository mortgage and consumerfinance companies, to report certain data regarding their mortgage loan applications and originations to thefederal government and members of the public. While reporting requirements vary by year, they generallyrequire a lender to report information on all applications received and loans made for home purchase,refinance, and home improvement loans. Lenders without offices in a metropolitan areas and/or whooriginate or accept fewer than five applications in a metropolitan area are exempt from HMDA reportingrequirements. In addition, lenders with small assets size are not required to report data for the followingyear. See, e.g., FFIEC, “2006 Reporting Criteria for Depository Institutions,” and “2006 Reporting Criteriafor Nondepository Institutions,” available at http://www.ffiec/gov/hmda/reportde2006.htm andhttp://www.ffiec.gov/hmda/reportno2006.htm. Although not all lenders are required to provide data underthe Act, HMDA data is generally regarded as providing the most thorough information available onmortgage lending. Data reported include the race, ethnicity, gender, and income of an applicant; thedisposition of the application; and, since 2004, whether or not an originated loan constituted was “highcost.”20Passed in 1977, the Community Reinvestment Act (CRA), 12 U.S.C. §2901, et seq., was intended toaddress the failure of many banks and thrifts (savings and loans) to adequately invest in low- and moderateincome neighborhoods by requiring periodic examinations of their lending practices in such communitiesand considering the results of such exams when federal regulators evaluated whether to approve mergersand other actions by those institutions. While the CRA has resulted in substantial investments in suchcommunities, the exams have been criticized as pro forma, with virtually every institution receiving a highscore, much like Garrison Keillor’s Lake Wobegon, where every child is above average.21See, e.g., National Community Reinvestment Coalition, “Income is No Shield Against Racial Differencesin Lending II: A Comparison of High-Cost Lending in America’s Metropolitan Areas,” July 2008; Allen J.Fishbein and Patrick Woodall, “Subprime Locations: Patterns in Geographic Disparity in SubprimeLending,” Consumer Federation of America, September 5, 2006; Debbie Gruenstein Bocian, Keith S. Ernst& Wei Li, “Unfair Lending: The Effect of Race and Ethnicity on the Price of Subprime Mortgages,” Centerfor Responsible Lending, May 31, 2006; Alicia H. Munnell, Lynn E. Browne, James McEneaney &Geoffrey M.B. Tootell, “Mortgage Lending in Boston: Interpreting the HMDA Data,” Federal ReserveBank of Boston Working Paper No. 92-7 (1992).175
disproportionate rate compared to whites, this provided evidence of possiblediscrimination in the mortgage lending market in that members of these groups were notbeing provided with adequate access to credit.22In the 1980s and 1990s, the traditional system of lending through depository institutionsevolved in several important ways. Risk-based pricing was introduced, which allowedlenders to offer mortgage products to individuals who might not otherwise have qualifiedfor a loan. Through risk-based pricing, a lender uses a consumer’s credit report and othersimilar data in “setting or adjusting the price and other terms of credit offered or extendedto a particular consumer.”23 The theory behind this lending model is that some borrowersmight not have adequate income or other credit profile characteristics to qualify for atraditional (prime) 30-year fixed rate loan. But rather than simply deny them the loan,the lender offers the borrower a loan at a higher rate. Because these loans are made toborrowers whose credit profiles are lower than that used for traditional prime borrowers,they are considered “subprime.” The theory behind charging more for such a loan is thatthe increased cost is designed to help protect the lender from the higher risk of default onthe part of the borrower. That is, because the borrower’s credit risk is higher than a“prime” borrower’s, there is a higher risk that he or she will default on the loan.24While subprime loans were a logical product on one level, they also contained aninherent contradiction. The higher interest rate of a subprime loan makes the loan moreexpensive overall, generally with higher monthly payments and other onerous terms,which themselves make default more likely. Thus the ver
THE OHIO STATE UNIVERSITY Subprime Lending in the City of Cleveland and Cuyahoga County PRESENTED BY JEFFREY D. DILLMAN Housing Research & Advocacy Center FAIR HOUSING and FAIR CREDIT THE FUTURE OF Sponsored by: W. K. KELLOGG FOUNDATION. The Kirwan Institute