Transcription
Session 2559Utilizing Student Computers for Laboratory Data Acquisitionin a University-Wide Laptop EnvironmentLewis G. Frasch, P.E.Lawrence Technological UniversityAbstractLaptop computers are being required of all students starting with the freshmen class of 2000.Traditional thermal science labs are being equipped with Analog-to-Digital converters to outputthe lab's traditional analog signals as a digital signal carried by a RS232 cable. Read-only fileswith appropriate software can be loaded on a student laptop when they come to lab, and thestudent's computer becomes the data acquisition system for the lab.BackgroundIn the fall of 2000, Lawrence Technological University (LTU) began requiring that all enteringfreshmen have a laptop computer. In each succeeding year, the next class rank (i.e. sophomoresin fall 2001) would be required to have a laptop. The laptops are a standard model leased by theunversity to the students and regularly upgraded. Student laptops that develop problems arefixed by the help desk or exchanged if the problem is too serious to fix quickly. They are preloaded with a standard set of software for each college. For example, all engineering laptops arepre-loaded with a high-end CAD program, programming language, equation solver, and officesoftware. Students who wish to use their own laptop must have one that is compatible with theuniversity's and loaded with the same software.The ability to assume that all students and, therefore, all student lab groups will have a currentlaptop with predictable software allows two basic lab issues to be addressed. For one, it makes astandard computer available for data acquisition in any experiment. Secondly, if the laptops canbe used as stand-alones, it allows LTU to avoid the built-in obsolescence of permanent labcomputers. Further, it reinforces the student's understanding of the laptop as a tool.Prototype ContextProceedings of the American Society for Engineering Education Annual Conference & ExpositionCopyright 2002, American Society for Engineering EducationPage 7.1290.1The Thermal Science Lab (TSL) is a senior level lab taken by all ME students. It consists o f aseries of experiments designed to reinforce the principles learned in thermodynamics, fluidmechanics, and heat transfer in the context of real equipment. Well-designed experiments tendto be used for a very long period of time. In the spring of 2001, a very gifted group of studentsrequested to do a Design Studio redesigning one of the TSL experiments. (Design Studio is aone-semester version of the usual yearlong capstone design course. It is very intense and onlyallowed by special permission.)
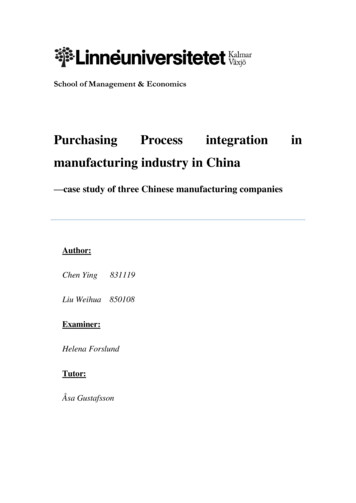
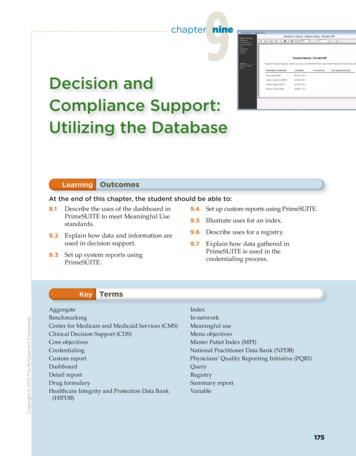
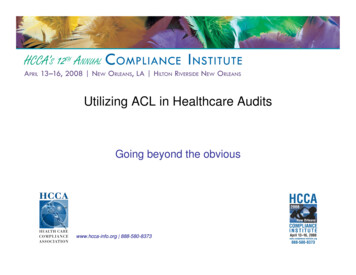
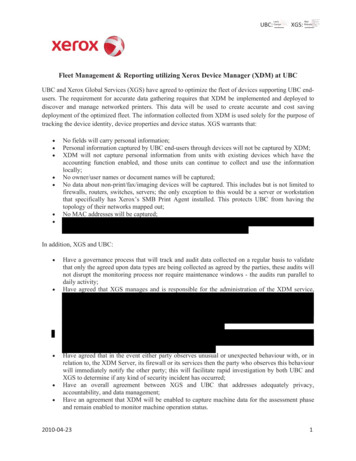
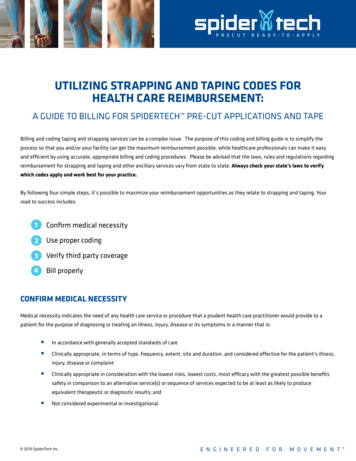
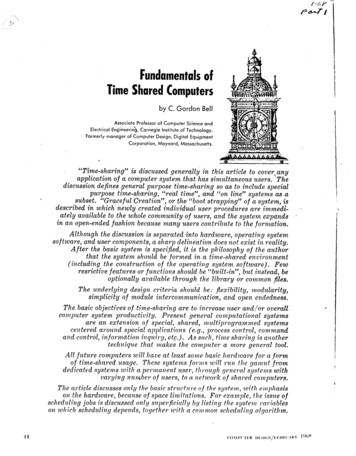
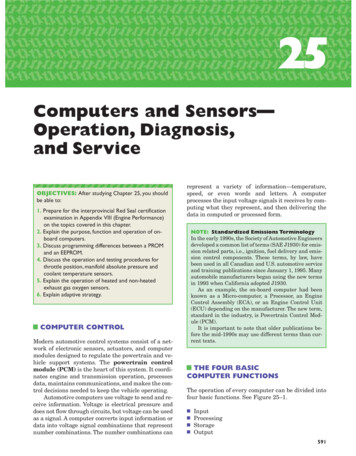
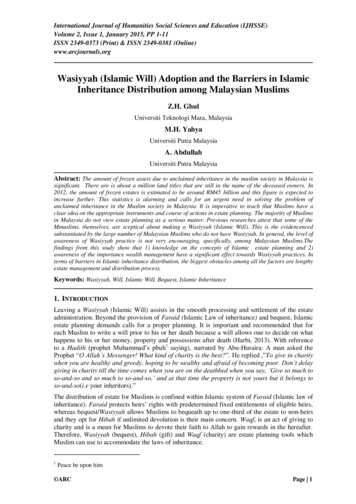
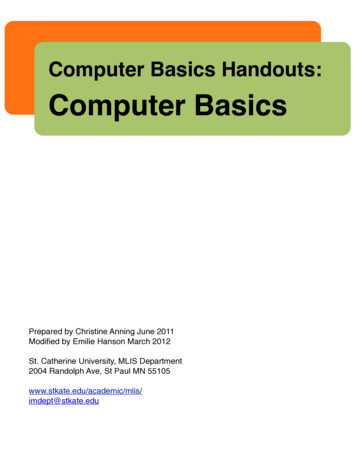
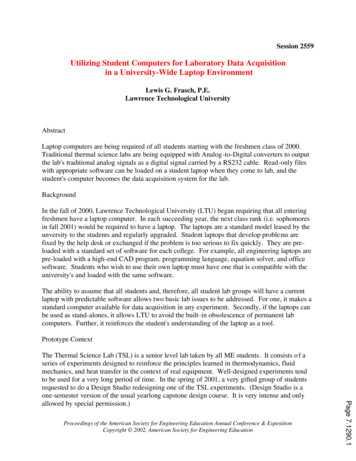
The experiment assigned to the student group was the Flow Characteristics Lab. In thisexperiment, students manually took pressure measurements along a four-inch diameter tube and,utilizing Pitot tube and orifice data, predicted K-factors for various entrances and friction factorsfor the tube. The student project group was tasked with redesigning the experiment for dataacquisition using a standard university laptop. The expectation for the new experiment was thata student would bring a laptop to the TSL, be handed a CD, and upon installing the software beable to take and analyze the lab's data.Utilizing analog pressure transducers, an A/D converter, Taltech's WinWedge software, andVisual Basic for Applications (VBA) in Excel, the group succeeded admirably. The system theydeveloped is providing a prototype for data acquisition in the entire lab and, as developmentscontinue, may spread to all of the college. The methodology they developed and the work inprogress are the subject of this paper.Current SystemFigure 1 shows a view of the new experiment. Pressures along the tube for pressure dropinformation and Pitot traverse pressures are in the 0-10"WC range. Orifice pressure differenceis in the 0-25"WC range. The pressure measurements needed were taken with manometers in theold apparatus. Analog instruments now measure pressures. The system is operating in steadystate. To get the range of pressures needed differential pressure instruments were used with oneside left open to atmosphere, Figure 2. The Auto Tran and the Cole-Palmer pressure instrumentsused produce a signal 0-5v DC. (A list of the equipment used is included later.) Since themeasurements are steady state, a barrel switch controls which instrument is being sent to the A/Dconverter, Figure 3. Having a student change the barrel switch position when prompted by theVBA program eliminates the need for daisy-chained converters or for resident computer control.Barometric pressure and temperature are input manually by the students when prompted.The analog signals are passed from the barrel switch to the A/D converter. The DGH model5131 A/D converter chosen has four channels and some programming capability. For thisapplication one channel was used to pass the data from the barrel switch to a RS232 cable. TheA/D output crosses the send, receive, and ground pins of a nine pin RS232 cable to com1 on thelaptop.The Taltech Corporation produces software called WinWedge. When loaded and operating itplaces the digital signal from com1 to a cell in an Excel spreadsheet. The call for the data and itsmanipulation are done by macros programmed in VBA. (WinWedge will work with manysoftware packages, but Excel is a LTU standard and is already both familiar to the stu dents andloaded on their laptops.) The WinWedge software and the Excel VBA program are installed onthe student's laptops from a CD. The VBA macros in Excel launch WinWedge.Proceedings of the American Society for Engineering Education Annual Conference & ExpositionCopyright 2002, American Society for Engineering EducationPage 7.1290.2One of the members of the student project team works fulltime doing data acquisition. He wrotean extensive VBA program to process the data. The software operates with "buttons" and is ofcommercial quality, Figure 4. It produces pressure versus distance plots and actual velocityprofiles and power law curves for comparison. It does a linear regression on the fully developedportion of the pressure versus distance curves and predicts entrance K factors and friction factor.
Certain of the calculations and the power law plots are password protected so the student groupsmust do these themselves, but the instructor can easily check their results.Comments on the Current System and Lessons LearnedThe current system has been used for one semester for approximately seven lab groups. Otherthan some zero drift in some of the pressure sensors no significant mechanical problems werenoted. The students developed as part of their work a calibration procedure which will need tobe used bi-weekly. The software has functioned well with the exception that some of theoriginal code written for Windows NT stopped working when the campus switched to Windows2000. When results are saved the students tend to simply save the Excel file which the saves allof the VBA program, etc. So, an effort is in progress to limit the information saved. Since thecurrent seniors are not required to have LTU laptops, the instructors are letting the studentgroups use theirs. Thus, full student hard drives or student computers with viruses have not beenan issue. Typically, when students take their data they E-mail the results to all the groupmembers as an attachment. So, when student machines are used, as long as one student'smachine has hard drive room, etc, there will not be a problem.As a general observation, the student-developed system is excellent. In use, however, it is verycomplex if any problems occur given that a faculty member that did not write the code must dothe troubleshooting. In the future, software will be kept simpler so that anyone familiar with thebasic packages can easily troubleshoot it. TalTech provides programs for various softwarepackages in their manual and some sample programs on disk. These form the starting point forthe VBA macros for further experiments in the TSL. Obviously, many variations are possible.The most basic would be to use a TalTech macro to get the data to a series of Excel cells and letthe students manipulate it from there.It should be noted that the experiments in this lab are either steady state or change relativelyslowly so the transient performance of the A/D converters (8 conversions per second) is not anissue. For the methods being used, sampling rate comes from the sample frequency programmedin the VBA macro. Also, the four channels of the converter are adequate for the work done or inprogress. If more channels were needed four more converters could be connected, one to eachchannel of the first. This provides a daisy chain of sixteen possible channels. The DGH manualdiscusses this procedure.Key Equipment Utilized (Approximate prices are as of spring 2001.)Pressure Transducers: AutoTran Inc. Model 600D-014 (0-10"WC) 100;(800) 735-8998Cole-Palmer Instrument Company Model 68071 (0-25"WC) 247;(847) 247-7600WinWedge Version 1.2: TAL Technologies, Inc. 180; (800) 722-6004Proceedings of the American Society for Engineering Education Annual Conference & ExpositionCopyright 2002, American Society for Engineering EducationPage 7.1290.3A/D Converters: DGH Model D5131 for the Flow Characteristics Lab 260;(603) 622-0452
Development in ProgressAt this writing, a second system is being developed. The Transient Cooling experiment in theTSL measures temperature decay and predicts convective heat transfer coefficient based on thelumped capacitance method. This experiment was selected so that a prototype for transientmeasurements would be developed. The DGH A/D converter model D5321 is being usedbecause it converts the thermocouple signal directly into temperature. Software is beingdeveloped utilizing WinWedge and Excel as described earlier. Two thermocouples are beingalternately queried, and the transient performance of both is being recorded and plotted. Figur e 6shows the test bed being used with its two thermocouples and A/D Converter. After this projectis completed, interested LTU faculty will be invited to a workshop to encourage widerimplementation.The author would be happy to supply anyone interested with further information(frasch@ltu.edu)AcknowledgementsThe author wishes to publicly thank Jennifer Lathi, Edward Reader, Keith Scales, RobertSonnenberg, and Leann Warner for their phenomenal work on their senior project.Figure 1: Flow Characteristics ExperimentPage 7.1290.4Proceedings of the American Society for Engineering Education Annual Conference & ExpositionCopyright 2002, American Society for Engineering Education
log)Barrel SwitchFigure 2: Pressure Sensors and A/D converter (upper right)Analog al of 22)Figure 3: Block Diagram of Pressure Measurement SystemPage 7.1290.5Proceedings of the American Society for Engineering Education Annual Conference & ExpositionCopyright 2002, American Society for Engineering Education
Figure 4: Typical Flow Characteristics Lab TemplateFigure 5: Pressure Transducer Wiring Schematic Part One 1Page 7.1290.6Proceedings of the American Society for Engineering Education Annual Conference & ExpositionCopyright 2002, American Society for Engineering Education
Figure 5: Pressure Transducers Wiring Schematic Part Two 1Figure 6: Transient Cooling Data Acquisition Test BedReferences:1.Thermal Science Lab Fluid Flow Characteristics Final Report; Lahti,Reader,Scales,Sonnenberg,Warner,2001,Final Report for EME4984Proceedings of the American Society for Engineering Education Annual Conference & ExpositionCopyright 2002, American Society for Engineering EducationPage 7.1290.7Biographical Information: Lewis G. Frasch, P.E. is a graduate of the Ohio State University and Iowa StateUniversity. He served as a nuclear submarine officer, a power plant designer, and has been on the faculty at LTUsince 1984.
fixed by the help desk or exchanged if the problem is too serious to fix quickly. They are pre - loaded with a standard set of software for each college. For example, all engineering laptops are pre- loaded with a high -end CAD program, pro