Transcription
Retail AnalyticsJames Collins, Lee Gates, Bulent Kasman, Vicky Nguyen,Mark Taylor, John Yamartino
Project I Retail AnalyticsSection 1 Retail Analytics SurveySection 2 The “why” and “what” of Retail AnalyticsSection 3 Analysis FrameworkSection 4 Examples based on spend levelSection 5 SummaryIntroduction: Pragmatic Retail AnalyticsThe leader of a retail merchant has many day to day, and long term challenges thatmust be managed at the same time. As IT technologies have matured, tremendousinvestments have been made solving both the tactical and strategic businessoperations problems. For the retailer recently considering the retail analyticslandscape, it appears quite fragmented and difficult for to determine where to startand which solutions they should consider.Our team took two approaches to the project. After building a categorization modelto define the overall ecosystem, the team introduced scoring for those providers inthe market covering all five categories. The second approach built the visuallandscape and inventory of the retail analytics providers with a solution for any ofthe five defined categories.Combining these and the categorization model enabled the team to survey thesolutions and recommend choices appropriate. Four examples are used to illustratethe wide variety of retail analytics and the recommendations at four differentbudget levels, including free.
Section 1: Retail Analytics SurveyThis report details the market survey and recommendation for choosing a retailanalytics solution with a landscape analysis and four examples of budget and benefitanalysis.Research was conducted using in person interviews, internet research from theretail leader point of view using internet search engines, and a synthesis of findingswithin the team discussions. Time researching and compiling this report isestimated at 100 hours during April 2016. Budget levels for the examples werechosen ahead of the research phase.Section 2: The “why” and “what” of Retail AnalyticsThrough applying business analytics to the retail market segment, the same benefitsas seen in other segments can be achieved. The traditional retail model is a mashupof both forward looking forecast, ordering, stocking, and selling. Much of this hasbeen based on managerial experience or empirical sales performance. The ability tohave the right product in the right place for the right customer often required theretailer to specialize at the store level, stock much or all of the given choices, drivingup the day to day operational costs.The modern retailer has to do all of these traditional business operations, but mustalso optimize in each of the five categories of strategy and planning, storeoperations, marketing, supply chain management, and merchandising. Each canbenefit from retail analytics, applying a combination in concert can both drive moretop line revenue while also reducing operational expenses.The big win for a retailer can be seen after adopting a retail analytics solution andimplementing automation to perform one or all of the five categorized functions.This ability to create a repeatable data collection, analysis, and decision processenables the retailer productivity and efficiency to increase significantly. Theautomation enables the traditional retailer to measure in weeks, days, or even hoursto evaluate retail performance and profit.While not part of the classification and analysis we did, certain trends looked likethey were gaining traction in the marketplace and are worth mentioning. More and more varied data requires more effective data governance Effective analytics requires both centralized and distributed data andanalysis capabilities The need for platform capabilities that support owned, earned, andthird party data
The emergence of machine learningData Governance:It was observed that migration of massive amounts of data acrossapplications and tools to cloud infrastructure makes data governance morecomplex. Therefore, technologies and processes are required to control whohas access to source data and analytics results. There is a ramp in toolsprovided by the industry to limit proprietary data to need to knowpersonnel.Centralized vs Distributed Data and Analysis:For retailers, effective data and analysis is a combination of both centralizedand distributed data storage and analysis. Examples of distributed data aresingle store inventory management and cycle time to determine whatproducts should be marked down according to local market demand. Forcorporate buyers, centralized data and analysis is required to purchase theright trends based on external data and data from all store locations and toinsure that distribution centers can maintain enough stock to supply orderswhile minimizing inventory on hand.Platform:It’s been reported that 80% of data was created in the last 2 years. Thecontinuation of increased in volume, variety, and velocity of data from evermore data sources including retailers’ owned, earned and third party data,coupled with the need to accommodate centralized and decentralizedanalysis, is driving a need for retailers to look at analytics platforms ratherthan point solutions.Machine Learning:Machine learning techniques and technologies greatly simplify predictiveanalytics for the user, which allow retailers to make the right offers at theright times to the right customers on the right channel automatically everytime. Machine learning embeds the expertise in SW, lowering the level ofexpertise needed to identify trends and make recommendations. It has thepotential to be applied to a wide variety of retailer business goals such asrevenue optimization, supplier management, inventory control, customerlifetime value, etc. For example, retailers can use machine learning torecommend the quantity, price, and market channel to reach the targetconsumers of outer wear based on analysis of vendors inventory andpredicted weather conditions for next winter that will affect transportationand other supply chain variables.
Section 3: Analysis FrameworkThirty five companies were investigated for analytics capabilities useful to retailbusinesses and their offerings categorized according to where they contributed inthe retail business model. A methodology was applied to identify the top 6companies in this set from a capability standpoint. Then examples were explored foreach of 4 annual spend levels free, 10K, 100K, 1M. The companies chosen forthese examples were then classified for the maturity level of the offerings so thereader could get a sense of what could be achieved at each spend level. See theAppendix for the full list of companies considered.Retail analytics is a subset of business analytics. The companies investigated all hadan offering focused on retail analytics or could be obviously applied to puttingtogether an analytics package for retail. Many of these companies support analyticsfor other industries and some have analytics as an add on to another product suchas point of sale. The companies analyzed are listed in the appendix.Companies that offer retail analytics products cover many areas of the retailbusiness model but for the most part, don’t cover every area. A categorization wasleveraged from Tickto in order understand what parts of the business each retailanalytics product would be useful in. The offerings from each company werecategorized accordingly with a few exceptions for companies that just provided data(such as Haver Analytics and Azure Datamarket).The Tickto model has 5 categories strategy and planning, store operations,marketing, supply chain, and merchandising. Examples of analysis support for eachcategory is listed in the table below.Table 3.1 Examples of Analytics Support in Each of the 5 Retail Business ModelCategoriesStrategy handising OverallPerformance Key ValueClient Analysis Macro Trends WorkforceAnalytics FraudDetection &LossPrevention Market BasketAnalysis PricingAnalysis LoyaltyAnalytics SalesForecasting InventoryManagement VendorManagement AssortmentOptimization Shopper Path
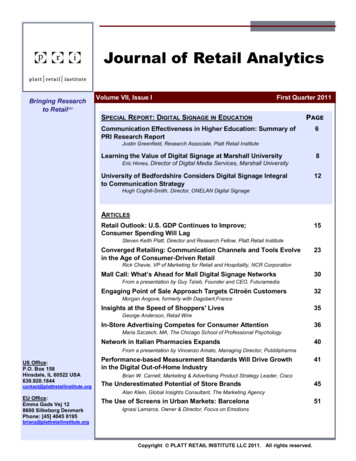
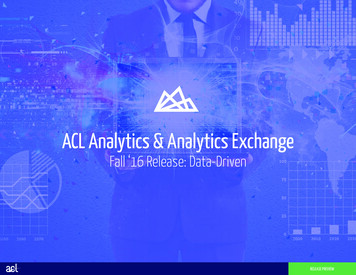
In order to get a sense of who the capability leaders were, ratings for the top 6companies were taken from the 2016 Gartner paper titled Critical Capabilities forBusiness Intelligence and Analytics Platforms. Although this paper covers the broadindustry, we filtered to only include companies that had a retail analytics offering.The Gartner paper rated capabilities for several classes but we chose two to rankretail offerings in our analysis because they reflected centralized control anddepartment control over data usage and reporting Centralized BI Provisioning andDecentralized Analytic. Scores were taken for the top 15 in each category andsummed to get a composite score. The offerings from the top 6 companies of thiscomposite score were thencategorized with the 5business model categoriesand generally rankedaccording to their compositescore as shown in the graphic.Closer proximity to thecategory wheel denoteshigher ranking. SAS was theclear winner.It is worth noting that thehighest score was 3.8 on a 1 5scoring with 5 being best.This is an indication thatthere is still room foradditional capabilities. Also,every company played in at least 3 categories and 3 played in all 5. Not surprisingly,there appears to be an advantage to having a presence in more than one categoryand being able to cross tie data for analysis.All the rest of the companies were analyzed for which business model categoriesthey had offerings in. The following graphic in figure 3.2 depicts the results.Proximity to the business category wheel has no meaning in this case.The number of offerings indicates early market and an opportunity forconsolidation at some point. We tried to include companies that served brick andmortar as well as online retail. If we had allowed companies that served online retailonly, there is a suspicion that the Merchandising category would have includedmore companies.
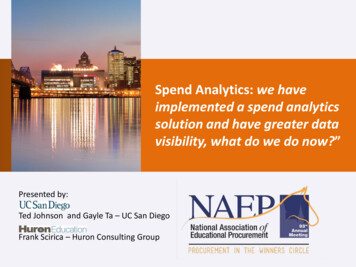
Figure 3.2 Retail Analytics LandscapeBusiness analytics is on an increasing maturity path and retail analytics productofferings show up at different levels. The following model was used to classifycompanies presented in the examples. Most companies are at the Predictive leveland below.Figure 3.3 Business Analytics Maturity Levels
Section 4: Examples based on spend levelThe original project scoping proposed three target spend levels for analysis 10K, 100K, and 1M. In the course of this investigation it was discovered that therewere some companies that were positioning “free”. Typically, this was an entry pathto paid services so a Freemium category was added.Examples were found in each of the 4 spend level categories and described toprovide a sense of what can be had at each spend level.4.1 FreemiumThe freemium space tends to be more restrictive and less feature rich than higherspend levels but this is not always the case as described below. Three companies arepresented in this space Square, Lokad, and Zoho.Where they play in the retail business categories is shown in the graphic. Coveragetends to be narrow, covering a smaller numberof categories. All products in these examplesuse a SaaS model. Analytics is an add on tosomething else that they are offering for two ofthe three companies and enhances the value oftheir core product.The main products for Square are Point of Saleelectronic payment devices for capturingnon cash transactions. The capture of saleitems along with a payment identificationprovide the basis for analytics opportunities. Adashboard (categorized as Store Ops) is offeredfor free that gives insight into sales trends, item and category sales, employee sales,and payment methods. A customer loyalty application (categorized as Marketing)can be added for 20/mo that provides a customizable “digital punch card program”For repeat customers. Tools track participation, redemption, and sales data.Lokad provides advanced analytics engines in support of supply chain and strategyand planning. A description from their web site frames what they have to offer “Know exactly when to reorder and how much to reorder. We provide anend to end solution that accounts for every demand pattern and every constraint.”To deliver of that description, they provide probabilistic forecasts and reorderquantity analytics that take into account ordering constraints and inventoryperformance. Mishimoto Automotive Performance used the sales forecasting
capabilities to lower their carrying inventory levels by 35%. Delivery is throughSaaS.The Lokad pricing model is quite interesting in that they claim all features areincluded in every plan. Plan pricing is based on revenue according to table 4.1.1.Support ranges from minimal at the free level up to consulting at the high spendlevels. Other levels can be negotiated including inventory optimization as a service.Table 4.1.1 Lokad Plan PricingPlan NameExpressBasicProfessionalEnterpriseCost ( /mo)Free 150 450 1350RevenueUp to 450KUp to 1.5MUp to 4.5MUp to 15MThe last example in this spend category is Zoho. They position themselves as an“operating system for business” and have a breadth of Business Intelligence toolsthat support sales and marketing, email collaboration, finance, and business process.Their Reports product is part of their business process product set and can beapplied to Planning and Strategy, Store Ops, and Marketing portions of the retailbusiness model. Analytics are not provided directly; reports are created that make iteasier to pull insight out of the data through appropriate presentation.Southwestern States used Zoho reports to help them achieve an incremental growthof almost 20% on gross sales.Zoho Reports pricing is generally based on aspects of the data set being presented(such as size) and the number of users. There are other constraints that define theplan levels so it would be best to get full pricing from their web site but the generalprice structure can be captured through table 4.1.2.Table 4.1.2 Zoho Reports Pricing OverviewFreeStandardProfessionalProfessional EnterpriseCost ( /mo)0 50 90 140 s5Unlimited UnlimitedUnlimitedUnlimited
The maturity level of Freemium examples ranged from descriptive to predictive.This is shown in the following figureFigure 4.1.1 Freemium Example Maturity Levels4.2 10K QlikIn the next spend level we see a continuation of freemium models although theseoptions scale larger and we start to see platform plays. The company beingreviewed at this level is Qlik.Qlik has a free cloud offering making it easy to get started. As needs grow there is aCloud Plus offering that charges per user and increases the amount of data spaceavailable. For larger installations there is an enterprise option with on premiseinstallation. For these larger installations Qlik has a number of partners and theirown internal group that can provide services.Connecting data into Qlik is easy in most cases. A feature of Qlik that seems to beemerging as a trend in the space is the data market. Some very basic datasets areavailable for free. Premium datasets are available with a per user pricing model andsome are available via a salesperson. These are easily referenced within the app tocreate your views. Other ways of getting data include connectors, an example is thefree Salesforce connector and the JDBC connector which can connect to a myriad ofdatabases. These features are available in an App Store like marketplace which alsoseems to be emerging as a trend among analytic offerings.A couple case studies we looked at from Qlik showed how their customers are usingQlik to make an impact on profits. Ted Baker was able to improve its marketing and
increased online sales in a sales event. Lush Cosmetics focused on store operationsand was able to find considerable savings looking at internal staffing.Overall our team was impressed with what Qlik was able to offer at a low cost for asmall number of users. It also seems to be able to scale to needs of companies asthey grow larger which allows Qlik to get a foothold into companies when they aresmaller and it gives companies a way to improve their analytics without requiringretraining on a new platform. These aspects make it a good choice for the small tomedium sized business.
4.3 100K AlteryxIn the 100K and higher category, analytics companies tend to provide solutionsthat can be customized for the specific needs of the target customers. This alsomeans, companies must employ skilled data analysts, analytics visualizationdesigners.Alteryx is an example company in this category. It provides a data blending andadvanced analytics platform that enables analysts to integrate internal, third partyand cloud data, and then to analyze it using spatial and predictive tools in a singleworkflow.“ Data blending differs from data integration and data warehousing in that its primaryuse is not to create a single unified version of the truth that’s stored in data, but ratherto build an analyticdataset that helpsbusiness analystsanswer specificbusiness questions ” Harvard BusinessReviewAlteryx lacks strongdata exploration andvisualization tools,which can beimplemented by thecustomers throughTableau, Qlik,
Microsoft, and other partnered products.Alteryx targets customers in diverse industry verticals from retail to hospitality totransportation to manufacturing. This is a common theme for analytics companiesin general.In terms of the analytics maturity, Alteryx is somewhere in the middle of the“predictive analytics” level. Most of the heavy lifting in terms of data blending andforecasting will need to be done by the analysts at the customer, based on reportsgenerated by the Alteryx tool.Alteryx offers a server (cost is about 58K per year) that hosts all of the analyticstools and databases. There is a per user cost of about 2K per year to access theAlteryx Gallery. The gallery contains all of the analytics charts and reports customdesigned by the customer, using Alteryx Designer tool. The designer tool costs about 5K per user per year, and allows expert analysts to design custom charts byblending data from multiple sources. Accessing external data sources costs extra,and is about 40K per year.Figure 4.3.1 Alteryx product structureCustomer generated analytics charts are presented in the Alteryx Gallery in the formof application in an App Store. Figure 4.3.2 depicts a sample collection of retailoriented charts.
Figure 4.3.2 Alteryx Gallery example.With Alteryx, a retail customer can get predictive analytics in most of the retailanalytics spectrum. Based on Alteryx Web site, following features are available toretail customers:Marketing :Deepen customer insight : Blend all of your data, structured and unstructured,from internal and externalsources — across all channels — to get oneview of your customerOptimize multi channel performance : Analyzecustomers' browsing history, spend patterns,and shopping behavior across channels toalign product mix, promotions, messaging andmedia choices with customer preferencesImprove marketing effectiveness : Profile andsegment customers, model scenarios, forecastpromotional lift, track actuals against targetand optimize channel and media mix toimprove campaign response rates andpromotional performanceEnhance social media presence : Blend and analyze social data andproduct/service review data to understand and respond to customersentiments and brand perceptions.Merchandising:Accurate Demand Forecasting: Combine all customer demand data –storelevel POS data, mobile and e commerce, with competitive activity, trade areainformation, economic factors, and seasonality to predict customer demandHyper local Assortment Planning: Enrich transaction history withdemographic data, population trends, ethnicity mix and more to optimizeassortment mix by trade area, or store
higher ranking. SAS was the clear winner. It is worth noting that the highest score was 3.8 on a 1 5 scoring with 5 being best. This is an indication that there is still room for additional capabilities. Also, every company played in at le