Transcription
Adding Alpha by Subtracting BetaA Case Study on How Quantitative Tools Can Improve a Portfolio’s ReturnsChris Martin, CAIAAxiomaExecutive SummaryFundamental (discretionary) portfoliomanagers typically build their portfolios fromthe bottom up.That is, they identify stocks they expect tobeat the market and combine them to createa portfolio. However, fundamental managerscan leverage quantitative tools to help identifyand lessen potential issues in their portfolio,while still maintaining their investment viewsand goals. In this paper, we’ll use a “real world”portfolio1 to illustrate how quantitative toolscan improve a portfolio’s realized returns.IntroductionFundamental investment management is likean iceberg. Although icebergs appear smallabove water, the majority of their mass is belowwater and so often unseen. For a fundamentalmanager, the tip of the exposed iceberg is theportfolio invested in and is the main productthey share with the world. Under the water andbehind the scenes, analysts pore over balancesheets, analyze industry and country trends,create cash flow models and valuations to helpscreen the large numbers of potential assets tobuy. The fundamental management investmentprocess can add much value by screening outwinners, but the challenge still remains onhow to translate these extensive “underwaterfindings” to an “above water” actionableportfolio in line with the manager’s investmentmandate and convictions on which assets aremore attractive investments than others.Withall of the work that goes into finding the bestcompanies to invest in, the exact weightingof these various assets is the final hurdle tobuilding a successful portfolio.A fundamental manager’s overall convictionin the stock often drives how much of eachname they purchase in the portfolio, outsideof simple rules such as making sure theirallocations to certain industries, sectors, and/or countries are reasonable. The name they feel7Quarter 1 2018Adding Alpha by Subtracting Beta A Case Study on How Quantitative Tools Can Improve a Portfolio's Returns
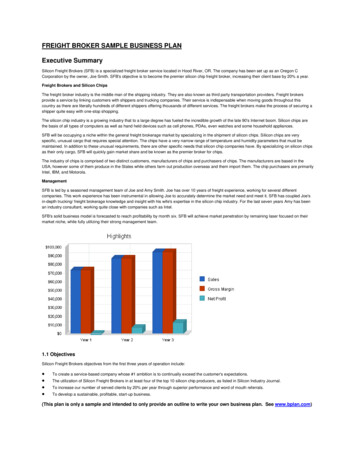
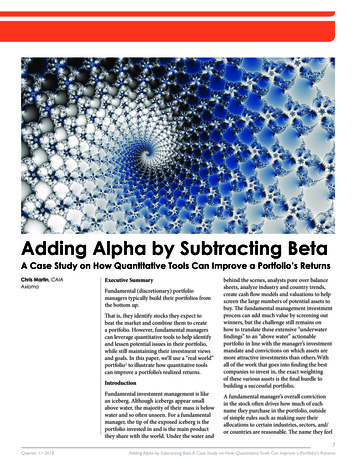
the highest conviction for will often have the largest weight in theportfolio, while the name they feel the lowest conviction for mayhave the smallest weight in the portfolio. Regardless, the finalposition weighting of fundamental portfolios is often based onheuristics, and the manager’s conviction is the main driver of assetweightings in the portfolio.Because fundamental managers use a bottom-up investmentprocess, we’d expect their fund’s positive performance tocome from the outperformance of individual stocks in theirportfolio. This is in contrast to quantitative investing, wherethe managers make systematic factor bets – such as on Value,Momentum, or Profitability – that they expected to add positivereturn performance to the portfolio. Newer, passive “SmartBeta” products – which are an increasingly competitive threatto attracting investment in fundamental managers’ activelymanaged portfolios – similarly embed systematic factor bets inthe portfolio. Smart beta products are more similar to quantitativeinvestment products than they are to the stock pickers’ activelymanaged portfolios.How can fundamental managers ensure their actual value add isin line with what they promise? What happens if the story theyare telling doesn’t match the story told by the quantitative toolstheir own clients and outside consultants are using? Is managerconviction the best way to build a portfolio? We will dive into ahigh-level review of the tools that quantitative investors typicallyuse and see how fundamental investors can adapt them to helpthem understand what’s driving their portfolios’ returns, as wellas aid them in making better decisions, avoiding undesired risks,and delivering higher alpha.The factors in a fundamental model are typically based oncommonly used and well-understood measures. Style factorsinclude factors comprising market-based measures such asMedium-Term Momentum, Size, and Volatility, and balance sheetand income-statement-based measures such as Value, Leverage,and Growth. Assets with a high Value score behave differentlythan assets with a low Value score, and the risk model accordinglycaptures this behavior. Industry factors are driven by the GICS(Global Industry Classification Standard) industry mapping,Country factors by the country membership, and Currencyfactors by the currency denomination of the asset. Assets with acommon industry or country will generally behave more similarlythan assets in a different industry, and again the risk modelaccordingly captures this behavior.How to Select the Right FactorsTo date, more than 350 individual factors, or factor premia, havebeen identified as potential sources of outperformance, and it is alist that is likely to grow as fund managers turn to more esotericcharacteristics in order to stand out in an increasingly competitivemarketplace.But at the heart of factor investing there are eight factors thatform the cornerstone of any strategy:Quantitative ToolsFactor Risk ModelsFactor risk models are tools to help finance professionalsunderstand the sources of predicted (ex-ante) risk and realized(ex-post) risk and return in a portfolio. The factors that comprisefactor risk models are characteristics of individual stocks thattend to lead to cross-sectional differences in returns. For example,smaller stocks tend to perform differently from their larger-capcounterparts, and highly levered stocks may outpace unleveredstocks under certain economic conditions. At their most basic,factor risk models provide a predicted standard deviation ofactive returns given a portfolio and a benchmark and decomposethe sources of those risks across both systematic (i.e., factor)components and an idiosyncratic (i.e., specific) component.Typically, a fundamental manager’s value proposition is inidentifying those idiosyncratic returns. In other words, theybelieve they select a stock that is likely to perform better thanother stocks in the same industry, size category, valuation level,etc.Axioma’s Worldwide factor risk model (WW4) includes severaldifferent factor blocks, including style, industry, country andcurrency factors, and a market factor – along with a specific riskmodel. Within the factor blocks, the underlying components(such as Value in the style-factor block or euro/USD in thecurrency block) are used to help a manager understand the riskin each of the portfolio’s bets and determine whether that risk isexpected to be compensated.8This chart and text originally appeared in the article, "Multi-factor Investing Practical Considerations for PortfolioManagers" originally published by Ian Webster in June 2016Every asset has an exposure to every one of these factors, and eachfactor not only has its own behavior, but also a correlation withother factors. Any returns that are not captured by the factors areconsidered “idiosyncratic” or “specific risk” – the risks that stemfrom the unique business model of the company itself and arenot common across the broad market. In other words, a stock’sreturn is explained by summing its exposure to each factor timesthat factor’s return. The difference between that sum and its actualreturn is its idiosyncratic return.From an ex-post perspective, factor risk models allow financeprofessionals to understand what drove their portfolios’ realizedreturns. Fundamental managers expect to see most of their returncoming from the “specific risk” described above, but may findthey have more factor exposure than they thought, those factorexposures added risk to their portfolios, and may have hurt theirreturns. The portfolio manager can analyze these realized returnsand risks using a factor risk model, which helps decomposerealized results across the various factor blocks and the specificblock. Factor-based performance attribution can also helpportfolio managers understand if factors are helping or hurtingtheir realized performance, so they can make better portfoliomanagement decisions on an ongoing basis.Adding Alpha by Subtracting Beta A Case Study on How Quantitative Tools Can Improve a Portfolio's Returns
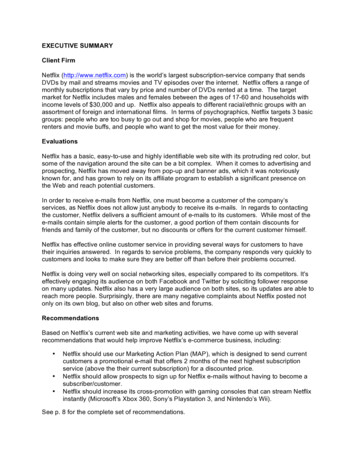
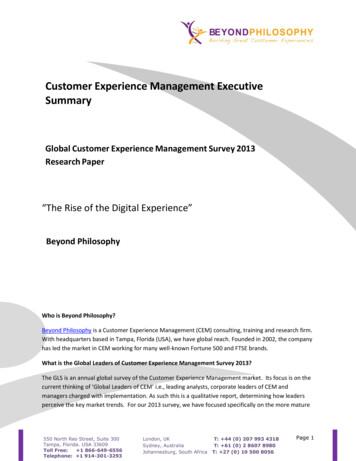
Stock-specific risk and return is also known as “alpha” anddelivers value that factor-based smart beta products and quantsdon’t always deliver. Factor bets, or “beta bets”, are getting harderto justify management fees for, whereas specific bets, or “alphabets”, still command a premium.Current Portfolio Analysis: Ex-Ante RiskFirst, we looked at the high-level aggregate active risks across thisportfolio:OptimizersAt a high level, optimizers are tools to help make betterdecisions – which can apply to almost any facet of life, not justfinance. At the core of any optimization is a goal one is tryingto achieve (such as minimizing undesired risks), while obeyingcertain rules that cannot be violated (such as the size of sectoroverweights). Optimizers are best known in the finance worldfrom Markowitz’s Mean-Variance optimization framework,where the goal is to maximize expected return less variance. Inthis case, the “variance” is quantified by either a factor risk modelor a covariance matrix that quantifies asset-asset interactions.The user of an optimizer does not need to understand all themathematics and mechanics behind the optimizer, just that it canevaluate thousands or millions of combinations of assets and tellthe user which combination best meets their objectives.Axioma’s optimizer does not force you into the mean- varianceoptimization space, which wouldn’t make sense for a fundamentalmanager who is not building quantitative expected returns.Unlike quantitative managers, fundamental managers knowthe assets they want to buy, and they have an idea of an initialportfolio weighting based on their level of conviction. But theensuing portfolio weights may be heuristic- based and notnecessarily be “tuned” to load up on specific risk and minimizeundesired factor risks. In this case study, we were faced with thechallenge of staying relatively close to the initial portfolio — sowe maintained high weights in high- conviction assets – whileattempting to remove unwanted factor risks.An optimizer is frequently needed for these trade-offs becausefactor risk models are complex tools. Often, making a smallchange in the portfolio may help address one factor but forceanother unintended factor to spring up. Furthermore, becauseall factors are correlated, risks can also be created from reducingcertain factor exposures. For example, we could potentially reducethe risk coming from a single factor like Growth but increasenet factor risk because Growth may be negatively correlatedwith another factor like Value. Optimizers can also accountfor other critical constraints while making trade-offs, such asmaking sure one does not trade too much, spend too much ontransaction costs, or deviate from certain industry, sector, andcountry bounds. Any mandate-specific rule can be an input to theoptimizer to make sure it is not violated.Portfolio Construction Case StudyWe started this case study by using a global portfolio managedby a bottom-up fundamental investment management firm. Wepulled the history of quarterly holdings from the start of 2007to the end of 2015 for a portfolio that was managed relative tothe FTSE All-World Index. We started by analyzing the ex-antepredicted risk and ex-post realized return/risk profile of the fundthrough the lens of Axioma’s WW4 factor risk model.Quarter 1 2018Exhibit 1: Aggregate Active Portfolio RiskWe see that predicted active risk for the portfolio has varied from1.75% to more than 4% over time, with the largest contribution ofactive risk coming from active specific risk. Overall, it is good tosee that the main driver of the portfolio’s risk is stock-specific, asthis is the crux of the manager’s investment process. But we stillsee that style, country, industry, and currency bets are prevalent inthe portfolio: risks that may have been the result of the bottom-upstock selection process, but not necessarily intended by portfolio’smandate.Another way to distill the total allocation of the portfolio’s risk tofactors versus specific risks is the “% of Active Risk” chart. (Seebelow.)Exhibit 2: Fund: % of Active RiskExhibit 2 shows that although the portfolio usually has morespecific risk than factor risk, when we add up each of the factorcomponents, we still end up with 40% to 60% of active riskcoming from factor bets. This chart verifies that the manager’sfundamentally-constructed portfolio is taking a lot of factor riskthat is not in line with his intended investment process.Current Portfolio Analysis: Ex-Post Factor AttributionThe analysis above provides portfolio managers with a view ofpredicted active risk and what factors are driving these risks.We can illustrate the impact these risks have on the portfolio’sperformance using factor-based performance attribution.In Exhibit 3 are the high-level realized results of this portfolio,annualized.Exhibit 3: Summary of Results from Axioma’s PortfolioAnalytics Solutions9Adding Alpha by Subtracting Beta A Case Study on How Quantitative Tools Can Improve a Portfolio's Returns
Overall, the portfolio has underperformed the benchmark:The portfolio has lower realized returns and more risk than thebenchmark, which leads to a negative information ratio (IR).We can then break down the realized active return and risksacross specific and factor bets, and then in more detail across thedifferent factor blocks available in the Axioma WW4 factor riskmodel:ex-ante and ex-post risk and return change. Four variations ofan optimal portfolio were run, weighting where they varied theamount the optimized portfolio can deviate from the originalfundamental portfolio. The results are summarized below:Exhibit 5: Backtest Return VariationsExhibit 4: Return DecompositionThe first line of this report reiterates what we saw above: Theportfolio has a negative active return of -0.28% with a realizedactive risk of 2.63%, leading to an information ratio of -0.11.The good news is that this manager is adding value throughits stock-specific bets ( 0.31%) and most of the realized risk isfrom its stock-specific bets. But the stock-specific gains are morethan wiped out by the negative factor returns – especially by the“Axioma Style” block, which also contributes lots of unnecessaryrisk. The country, industry, and currency bets help add to returns,albeit with relatively low IRs. But generally, given that the overallmandate of this manager is to deliver results via stock-specificbets, many of these factor bets are not necessarily intended – i.e.,they are a byproduct of a manual weighting process.So what is a manager to do? One approach would be to manuallyre-weight the holdings by trying to reduce exposures to certainfactors – especially the Axioma Style factors, given the amountof risk they are contributing to the portfolio and the amountthey are detracting from returns. But this manual approach likelyrequires many iterations, with no guarantee that the changeswill actually help improve the risk profile of the portfolio.Furthermore, the various interlinked components of a risk modelare nearly impossible for a human to take into consideration whenmaking a decision. We therefore look to an optimizer to help usmake trade-offs between maintaining conviction and reducingunwanted factor risks.In this case, the goal is to find an optimal set of portfolio weightsthat reduce the potential drag from unwanted factor bets byminimizing active factor risk relative to the FTSE All-WorldIndex. Because the fundamental manager has devoted a greatdeal of research to the names to be held in this portfolio, we willonly allow the optimizer to hold names in the original portfolio.Because there is also conviction information in the holdings asthe original portfolio is currently weighted, we probably don’twant to dramatically change the asset weights (i.e., an asset witha 0.05% active weight probably should not go to a 4% activeweight). The “No Limit” case is an extreme case where theoptimizer has the freedom to dramatically change the ranking ofassets held and drop the holding of any asset even if it is held at alarge weight, purely in pursuit of eliminating factor risk.We then ran these different optimization strategies on a quarterlybasis from the start of 2007 to the end of 2015 and comparedhow the optimized portfolios performed relative to the originalfundamental portfolio.After looking at some high-level details, we can get a better sensein the differences among some of these portfolios. Exhibit 6 showsthe number of names held in the portfolio, which is a portfoliocharacteristic we did not explicitly constrain.Theoretical Portfolio Analysis: Optimal Portfolio WeightingTrading off reduction in active factor risk and asset-level deviationfrom the initial portfolio holdings is the challenging part of thisexercise. Not allowing too much change in asset holdings relativeto the initial portfolio may not make a big enough reduction inthe amount of active factor risk of the portfolio, but allowing toomuch change may dramatically alter the ranking of assets in theportfolio and throw us out of whack with the portfolio manager’sconvictions.To better understand how the portfolio would perform underdifferent asset-level weightings, a portfolio manager can runa backtest (i.e., historical simulation) where they make slightchanges to the original fundamental portfolio and see howExhibit 6: Names HeldWe see that the number of names held in the “5 bp” portfoliois almost the same as the original fund. As the bounds aroundthe holding of the original fund weights increase, the numberof names drops. When a name is dropped, it is only because theholding of that asset in the fund portfolio is less than the specifiedbounds. For example, when we enforce a limit of /-25bps changein holdings between the 25bp portfolio and fund portfolio, theonly names that are dropped are holdings of 0.25% or less. Such10Adding Alpha by Subtracting Beta A Case Study on How Quantitative Tools Can Improve a Portfolio's Returns
small holdings likely were low-conviction assets whose risks arerelatively large, and we see later that the performance doesn’toverly suffer with these assets are dropped from the portfolio.In the “No Limit” case, we see the number of names held candrastically fluctuate as even names held at large positions can bedropped from the portfolio.Exhibit 7 charts the predicted active risk for all of the backtestvariants. We see that as we allow larger changes in weights fromthe original portfolio, we are able to reduce the amount of activerisk we are taking. We see that in the “No Limit” case, sometimesthe active risk actually increases, likely because of the sharpreduction in names held. The hope is that lower active risk comesfrom a reduction in active factor risk – those risks that we areaccidently picking up when building the fundamental portfolio.report. We start by comparing the realized risks and first confirmwe are at least reducing the amount of factor risk in the “NoLimit” portfolio.Exhibit 9: Annualized Realized Risk Comparison – PerformanceAttribution ReportWe see that the optimizer and risk models are doing their jobs asthe realized risk reduction comes almost entirely from the factorblock. However, reduced risk at the expense of reduced returnsis not acceptable, so we need to identify how the realized returnshave changed.Exhibit 10: Annualized Realized Return Comparison – OriginalFund PortfolioExhibit 7: Predicted Active RiskExhibit 8 summarizes the realized returns and risks of thedifferent backtested strategies, where returns do not includetransaction costs or taxes:Exhibit 8: Realized Active Frontier: 2007 – 2015We see that giving the optimizer a mere /-0.05% room to varyasset weights from the original position size helps us improveactive returns and reduce realized active risk. Providing morewiggle room for the optimizer with /-0.25% and /-0.50% leadsto even
Axioma’s Worldwide factor risk model (WW4) includes several different factor blocks, including style, industry, country and currency factors, and a market factor – along with a specific risk model. Within the factor blocks, the underlying components (s