Transcription
M&A #10‐098‐02UPPER NEWPORT BAY ECOSYSTEM RESTORATION PROJECTPOST‐RESTORATION MONITORING PROGRAMVEGETATION MONITORINGANNUAL REPORTYEAR 5 – 2015UPPER NEWPORT BAY ECOLOGICAL RESERVEORANGE COUNTY, CALIFORNIAMarch 2016Prepared for:Orange County Environmental Resources DepartmentContact: Ms. Rita Abellar2301 N. Glassell StreetOrange, CA 92865Office: (714) 955‐0663Prepared by:Merkel & Associates, Inc.Contact: Ms. Rachel Woodfield5434 Ruffin RoadSan Diego, California 92123Office: (858) 560‐5465Rachel A. Woodfield, Senior Biologist/Project ManagerKeith W. Merkel, Principal Consultant
UNB Post‐restoration Monitoring Program –Year 5 Vegetation ReportMarch 2016TABLE OF CONTENTS1.0INTRODUCTION . 12.0METHODS . 42.1.2.2.3.03.1.3.2.HABITAT MAPPING .4VEGETATION TRANSECT MONITORING .6RESULTS. 9HABITAT MAPPING .9VEGETATION TRANSECT MONITORING .134.0DISCUSSION . 175.0REFERENCES. 22LIST OF TABLESTable 1. Area of habitats within the UNB study area (July 2015). . 9Table 2. Average percent cover of plant species in each marsh community at UNB in November 2015. 14Table 3. Percentage frequencies of plant species in each marsh community at UNB in November 2015. 15Table 4. Comparison of key habitats (hectares) within the UNB study area during Years 1 and 5. . 17LIST OF FIGURESFigure 1. Project Vicinity Map .2Figure 2. Upper Newport Bay Habitat Map (July 2015).10Figure 3. Comparison of Habitat Distributions Between Year 1 (2011) and Year 5 (2015). .18LIST OF APPENDICESAppendix A.Appendix B.Appendix C.Appendix D.Sample Station CoordinatesVegetation Transect Data – November 2015Vegetation Transect PhotosVegetation Transect Data – September 2012Merkel & Associates, Inc. #10‐098‐02i
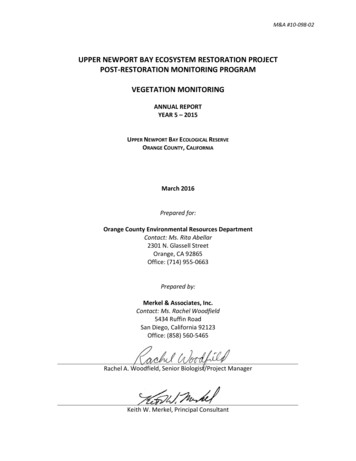
UNB Post‐restoration Monitoring Program –Year 5 Vegetation ReportMarch 2016UPPER NEWPORT BAY ECOSYSTEM RESTORATION PROJECTPOST‐RESTORATION MONITORING PROGRAMVEGETATION MONITORINGYEAR 5– 2015Merkel & Associates, Inc.March 20161.0 INTRODUCTIONNewport Bay is located on the southern California coast, approximately 40 miles south of LosAngeles (Figure 1). From the harbor entrance at the rocky headland at Corona del Mar, NewportBay extends about 3.5 miles north‐northeastward. Newport Bay is a combination of two distinctunits, termed "Lower Bay" and "Upper Newport Bay” (UNB), divided by the narrows at Pacific CoastHighway (PCH) Bridge (Figure 1). The 752‐acre Lower Bay, where the majority of commerce andrecreational boating exists, is heavily developed (predominantly as residential properties) and is adeep‐basin coastal lagoon. The 1,000‐acre UNB is a drowned river valley, geologically much olderthan the Lower Bay, and is largely undeveloped. This portion of the bay is more formally consideredto be an estuary. Much of UNB is included in the Upper Newport Bay Ecological Reserve, managedby the California Department of Fish and Wildlife (CDFW) (formerly the California Department ofFish and Game).Upper Newport Bay is one of the largest coastal wetlands remaining in southern California. Naturalhabitats within UNB include open marine waters, intertidal mudflats, cordgrass‐dominated low saltmarsh, pickleweed‐dominated mid salt marsh, high salt marsh, salt panne, riparian, freshwatermarsh and upland. Because of its diversity of habitats and its location on the Pacific Flyway, UNBsupports an impressive number and diversity of birds, particularly during fall and winter whenshorebirds and waterfowl arrive from their northern breeding grounds. Upper Newport Bay alsosupports several endangered bird species and one endangered plant species. The subtidal andintertidal waters of UNB provide important habitat for marine and estuarine fishes.By the end of the 20th century, the ecological diversity and functionality of UNB was increasinglythreatened by sedimentation from the surrounding urbanized watershed. It became clear that aprogram was needed to develop a long‐term management plan to control sediment deposition inUNB and to preserve the health of its habitats. Through a partnership among the U.S. Army Corpsof Engineers (ACOE), the County of Orange, CDFW, and the California Coastal Conservancy, the UNBEcosystem Restoration Project was developed. The UNB Ecosystem Restoration Project wasdesigned to allow for the effective management of sediments deposited into the bay, reduce thefrequency of maintenance dredging, improve or restore estuarine habitats, sustain a mix of openwater, mudflat, and marsh habitat, increase tidal circulation for water quality, reduce predatoraccess to sensitive habitats, improve public use and recreational access, and improve educationalopportunities. The restoration project was initiated in 2006 and completed in October 2010.Merkel & Associates, Inc. #10‐098‐021
10-098-020200400800Photo Source: County of Orange, July nit I/IIIBasinNew LeastTern IslandT5STARTSTARTSTARTT2Unit AquaticCenterT9STOPShellmakerIslandT10STOPSanta BarbaraLaunchRampSTARTDe AnzaPeninsulaP acificCoastHighNewportDunesBasinLos AngelesPACI FI CNewport BeachOCEANMAP AREAwwayµSan DiegoVegetation Monitoring TransectsUpper Newport Bay Ecosystem Restoration ProjectPost-restoration Monitoring Program - Year 5Figure 1Merkel & Associates, Inc.
UNB Post‐restoration Monitoring Program –Year 5 Vegetation ReportMarch 2016In order to detect and document the long‐term development processes following the restoration,the ACOE prepared the Post‐restoration Monitoring Program for the Upper Newport Bay EcosystemRestoration Project (ACOE 2010). The program outlines ten years of biological and physicalmonitoring, as detailed in prior annual monitoring reports (Merkel & Associates, Inc. 2014a, 2014b,2013). The first monitoring year extended from January to December 2011 and continued annually.The ACOE performed the first three years of the Post‐Restoration Monitoring Program, with theCounty of Orange and CDFW sharing responsibility for the monitoring and reporting in Years 4through 10. The County of Orange has contracted Merkel & Associates, Inc. (M&A) to perform theVegetation Monitoring portion of the Year 5 (2015) Post‐Restoration Monitoring Program.Merkel & Associates, Inc. #10‐098‐023
UNB Post‐restoration Monitoring Program –Year 5 Vegetation ReportMarch 20162.0 METHODSThe distribution, composition, and evolution of vegetation communities and unvegetated habitatswere monitored through the use of aerial photography and quantitative transect methods. TheMonitoring Program calls for the use of aerial photographs in Years 1, 2, 3, 5, and 8 and quantitativesurveys of transects in Years 2, 5, and 8. Therefore Year 5 monitoring included both habitatmapping from aerial photography and quantitative transect surveys.Measurement units of numerical data are presented as a combination of metric and EnglishStandard System units in this report. Typically, collected scientific data would be reported usingmetric units such as hectares and meters; however, UNB has a long regulatory, engineering, andbiological monitoring history that has made use of a blend of metric and English units. For tidalelevation and habitat area measurements, metric unit presentations are less familiar to mostreaders than English units. Therefore, where an area measurement has been made through GIS‐based mapping efforts, the results are presented in hectares, with conversions to acres provideddue to the greater ease with which many readers can envision areas in this unit of measurement.Tidal elevations are described in feet, rather than meters, due to the greater familiarity of mostreaders with tidal ranges in feet and the historic usage of English units for this project. The verticaldatum used in this document is Mean Lower Low Water (MLLW) (83‐01 epoch). Horizontally geo‐referenced data are on the California State Plane Zone 6, North American Datum of 1983 (NAD 83).2.1.Habitat MappingTo map vegetated and non‐vegetated habitats during Year 5 (2015), the County of Orangecontracted GPSi Corp. to collect the aerial imagery of the UNB study area. The study area was flownby GPSi Corp. on July 10, 2015. Four‐band (RGB and near infrared) imagery was collected togenerate an orthomosaic of the study area at a pixel resolution 3‐inch Ground Sampling Distance.The imagery was collected between 10:15am and 11:52am at roughly a 1.6‐foot MLLW tidalelevation. To collect imagery at the 0 MLLW elevation called for in the Monitoring Program, andcaptured in the prior monitoring years, the flight would have needed to be scheduled during thespring, when low tides coincide with suitable sun angles for image collection. A delay in theinitiation of Year 5 monitoring pushed the imagery collection to July when only higher tidesoccurred during appropriate flight times. No other complications were encountered with the imagecollection.To establish a consistent study area, a boundary was established during Year 1 at the extreme highwater line, which is 7.8 feet MLLW for UNB, and generally corresponds to the upper boundary ofsalt marsh habitat. All areas extending from that outer boundary toward the main channel wereincluded, including raised areas above 7.8 feet, such as the least tern islands. The geographicposition of the 7.8 feet contour line was determined using topographic data collected by ACOE in2011. It was not possible to also evaluate only the habitat occurring within the UNB EcologicalReserve because a GIS‐based reserve boundary was not available at the time of analysis. Inaddition, some portions of the Reserve extend outside the boundary of the Restoration andMonitoring Program.Heads‐up digitization of vegetation boundaries visible in the imagery was performed using ArcGIS10. Each polygon was assigned a habitat description, based on the plant assemblages present orMerkel & Associates, Inc. #10‐098‐024
UNB Post‐restoration Monitoring Program –Year 5 Vegetation ReportMarch 2016the origin and nature of other non‐vegetated areas. Eelgrass (Zostera marina) visible in the aerialimage was delineated, however the higher tide at the time of image collection likely limited theamount of eelgrass that could mapped visually from aerial images and complicated comparisons toprior mapping efforts made using imagery collected a the 0 MLLW tidal elevation.The only habitats that were not mapped strictly from the aerial were intertidal mudflat and openwater. During the project planning process, the lower edge of the mudflat was defined as the ‐1.54feet MLLW contour. Therefore all post‐restoration habitat monitoring has used the same definitionand relied on bathymetric data provided by the ACOE to position that mudflat boundary. Thisapproach was problematic in Years 2 and 3 (2012 and 2013), because in many cases thebathymetric data did not extend up as shallow as the –1.54‐ft MLLW contour, so it could not beused to delineate the lower boundary of the mudflat (and upper edge of open water). In thesecases, attempts were made to estimate the position of the ‐1.54‐ft MLLW contour by joining theends where the contour line broke off, by examining the aerial photo, or through comparison withthe previous contours. In Year 5 the bathymetric dataset extended high enough to capture the ‐1.54‐ft MLLW contour for most of the study area. Where gaps occurred, the same method ofestimation was used to delineate the mudflat boundary.Bathymetric data were not collected in most of the shallow side channels of UNB. In these areas,the open water/mudflat boundary was mapped from the aerial image. For example, the Santa AnaDelhi Channel was not included in the bathymetric survey, therefore the open water and emergingmudflat was mapped exclusively from the aerial photographs. This was done by examining thevisual characteristics of the boundary in adjacent areas where bathymetric data were available, andusing those same indicators to estimate the lower mudflat edge where data were not available.The 2011 (Year 1) dataset was also examined as a guide; bathymetric data was collected for theentire site that year. To maintain consistency in this technique, the same GIS Specialist hasperformed the habitat delineation at M&A during each monitoring year.The draft digitized habitat maps were printed and taken into the field for ground‐truthing fromvarious vantage points along the shoreline and from the water. The habitat maps were updatedand map products and summary statistics of habitat acreage and distribution were generated.Comparisons were made between the habitats mapped in Year 1 post‐restoration (2011) and Year 5(2015). Comparisons were not made to the interim monitoring Years 2 and 3, because the aerialimagery was manually georeferenced during those monitoring efforts, resulting in habitat mappingthat was affected on a small scale by factors such as camera tilt, terrain relief, lens distortion, andimage stretching. As was recommended in the Year 3 report (M&A 2014a), collection of anorthophoto in Year 5 allowed for comparison with the Year 1 habitat map, which was alsogenerated from an orthophoto, allowing better detection of small‐scale changes in habitatdistribution.Cordgrass Transplant MonitoringSeparate from the Post‐restoration Monitoring Program habitat mapping, an assessment was alsomade of the cordgrass (Spartina foliosa) that was transplanted in November 2009 on the windward(south) and west shores of New Least Tern Island. The purpose of the transplant effort was tomitigate the estimated 500 square meters (0.1 acre) of cordgrass loss that resulted from theexcavation of the channel around New Least Tern Island as part of the Restoration Project. TheMerkel & Associates, Inc. #10‐098‐025
UNB Post‐restoration Monitoring Program –Year 5 Vegetation ReportMarch 2016mitigation obligation for the project included the creation of 1,500 square meters (0.4 acre) of newcordgrass beds. The condition of the transplanted cordgrass was evaluated on foot on November12, 2015.2.2.Vegetation Transect MonitoringAlthough the Vegetation Monitoring Program includes a transect element, there are no specificgoals or questions identified by the Monitoring Program in relation to plant communitycomposition that can be answered by transect work. Therefore, the first transect monitoringperformed in Year 2 (2012) was designed simply to repeat transect investigations conducted priorto the restoration for comparison to post‐restoration conditions. The Year 5 monitoringimplemented the same methodology.The two pre‐restoration studies that were reviewed were the Newport Bay Sediment andVegetation Monitoring Sediment Total Maximum Daily Load, Vegetation Monitoring 2004performed by Wetlands Research Associates in October 2004 (WRA 2004) and Biological Resourcesof Upper Newport Bay, California (MEC 1997), which included transect monitoring performed inOctober 1997. The 2004 WRA study included survey transects in roughly the same location as thoseestablished by MEC in 1997. At that time, WRA adjusted some of the transect endpoints andincluded their coordinates in the report. Prior to the Year 2 (2012) field work, both the 2004 and1997 transects were plotted on an aerial image using GIS. With two exceptions, the 2004 transectswere best positioned to capture the 2012 post‐restoration configuration of the marsh at UNB. The2004 report included a typo in the coordinate table that made the recovery of Transect 1impossible; in that case the 1997 transect was adopted. There was also a typo in one of thecoordinates for the 2004 Transect 10, so it was adjusted until it matched the alignment shown in afigure presented in the report.A total of ten transects were established, with new transect endpoints recorded with a differentialGlobal Positioning System (dGPS) unit in Year 2 and recovered in Year 5 (Figure 1). Endpointcoordinates are provided in Appendix A. It is important to note that there is a mix of measurementunits involved with the transects. The coordinates of the transects are provided in meters (StatePlane), the standard unit of measurement established for the Restoration Project. However, to beconsistent with the pre‐restoration vegetation transect survey work, the positions of survey plotsalong each transect were recorded in feet. The transect start point coordinates provided inAppendix B mark the absolute 0 start point, of which all plots are measured. However, the transectend point coordinates provided in Appendix B are only the approximate end point. The pointsestablish the alignment of the transect, but in some cases, based on the judgment of the fieldsurveyor, data collection along the transect may have stopped short of or gone past the end point.The Year 5 transect monitoring was performed on November 11 and 12, 2015 by M&A biologistsRachel Woodfield, Thomas Valencia, and Cameron Newell. The start of each transect wasrecovered by dGPS and generally was positioned at the upper edge of the mudflat. The transectthen generally extended up through low, middle, and high marsh communities, terminating at thelower edge of the fringing upland habitat. In some cases, the positioning of the transect andtopography of the site was such that this progression of communities was different. For example,Transects 8 and 9 both start and end at the mudflat/low marsh interface after crossing over anisland (Figure 1). A photo was taken of each transect from the start point. A photo was also takenMerkel & Associates, Inc. #10‐098‐026
UNB Post‐restoration Monitoring Program –Year 5 Vegetation ReportMarch 2016from the end point on transects where the alignment made it difficult to view it in its entirety fromthe start point only. In several cases the ends of the transects were in the water, therefore photoswere taken from the closest accessible point near the transect end.A series of two to three 330‐foot tape measures was extended end to end along the transect. Aseries of plots were analyzed along each transect, characterizing each marsh community. The lowmarsh, middle marsh, and high marsh communities were identified in Year 2 using indicator speciescoverage identified in the 1997 and 2004 studies. Low marsh was identified as areas dominated(60‐70% cover) by cordgrass. Middle marsh was at least 50% pickleweed (Sarcocornia pacifica),with other species such as saltwort (Batis maritima) and jaumea (Jaumea carnosa). High marsh wasdefined as dominated by salt grass (Distichlis spicata), with areas of shore grass (Distichlis littoralis)and pickleweed. One transect (Transe
The UNB Ecosystem Restoration Project was designed to allow for the effective management of sediments deposited into the bay, reduce the frequency of maintenance dredging, improv