Transcription
Hawaii Energy Facts & FiguresNovember 2014State of Hawaii Department of Business, Economic Development and TourismHawaii State Energy Office · energy.hawaii.govTwitter : @EnergyHawaiiGov Facebook: facebook.com/HawaiiStateEnergyOfficeHawaii Energy OverviewElectric U li esElectric U li es: Customers & RatesRenewable Energy:BioenergyElectric VehiclesGeothermalHydropowerInter‐Island Cable Grid‐TieOceanSmart GridSolarWindPermi ngEnergy Efficiency:Energy Performance Contrac ngState of Hawaii Agencies Lead By ExampleLeadership in Energy and Environmental DesignENERGY STAR BuildingsGreenSun Hawaii Loan ProgramHawaii Green Business ProgramEnd Notes/References
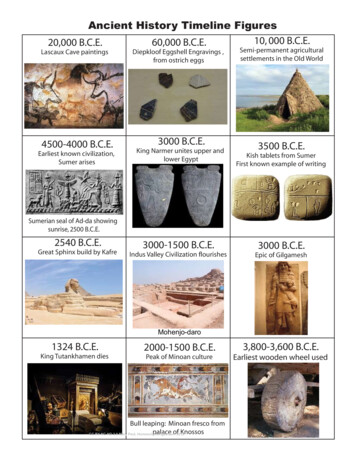
Hawaii Energy OverviewOil1% 0.30Apr-14Oct-13Apr-13Oct-12Apr-12Crude oil (Brent) spot price, /gallonHawaii electricity prices, statewide, all sectors /kWh23HawaiiU.S.Hawaii, 0.34Electricity and gasoline are just part of Hawaii’s energy picture. Large quantities of jet fuel arealso used (this is different from the Mainland, where most petroleum is used for groundtransportation). In Hawaii, roughly equal amounts of petroleum are used for electricityproduction, ground transportation, and commercial aviation, with the rest used for marine6transport, military, and other uses. 0.20 0.10U.S., 0.10 2006 2007 2008 2009 2010 2011 2012 2013 2014Although Hawaii’s electricity production and costs are still heavily reliant on oil, energy4efficiency and renewable energy have been increasing in all counties.Hawaii's PetroleumUse, Galons By SectorAverage ElectricityPrice, /kWh 0.40Oct-11Hawaii statewide regular gasoline prices, /gallonNatural Gas30%Hawaii’s electricity prices are three times higher than the U.S. average. -Dollars per Kilowatt-hour Apr-11Nuclear19% 0.10 1.00Coal37%Biomass1%Coal15% 0.20 SolarHydro 0%7%Geothermal0% 0.30 3.00Apr-09Geothermal2% 4.00Oct-08Other4%Apr-08Wind4% 0.40Oct-07Solar0% 5.00Apr-07Hydro1%U.S.Electricity Production by Source, 2012Oct-06HawaiiElectricity Production by Source, 2012In Hawaii, both electricity and gasoline prices follow the price of petroleum. The graph5below shows the prices of Brent crude oil, gasoline, and electricity.Dollars per GallonHawaii is the only state that depends so heavily on petroleum for its energy needs. Whereasless than 1% of electricity in the nation is generated using oil, in 2012 Hawaii relied on oil for171% and on coal for 15% of its electricity generation.OTHER3%MILITARY ERCIALAVIATION27%Total petroleum use 2013(million barrels per year) 7Total petroleum use 2013(million gallons per year) 9Hawaii’s rank among 50 statesfor energy prices 11GROUNDTRANSPORT28%44.218561Fuel for electricity production(million gallons per year) 8Fuel for air transportation (i.e. jet fuel)(million gallons per year) 10Fuel for ground transportation(million gallons per year) 124094764461 DBEDT Hawaii State Energy Office Hawaii Energy Facts & Figures, November 2014
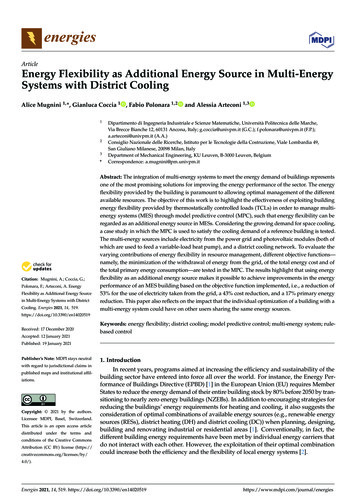
Electric UtilitiesKIUCEach of Hawaii’s six main islands has its own electrical grid, not connected to any otherisland. Hawaiian Electric Company (HECO) and its subsidiaries, Maui Electric (MECO) andHawaii Electric Light Company (HELCO), serve about 95% of the State’s population. The13island of Kauai is served by Kauai Island Utility Cooperative 9Not14applicable78 71423,28133,7569,35624056212,91856,8328,34365,175% of kWh usedby Residential27%35%30%36%39%30%15%31%% of kWh usedby tion(GWh)Firm capacity(MW)Intermittentcapacity (MW)System Peak(MW)Lanai MolokaiHawaii’s electric utilities deliver electricity generated with their own units as well as powergenerated by Independent Power Producers (IPPs). If new or replacement generation isrequired, HECO, MECO, and HELCO are required to follow the “Competitive BiddingFramework” for new generation with capacities greater than 5 MW (Oahu) or 2.72 MW(MECO, HELCO), or receive a waiver of the competitive bidding requirements from the1718Hawaii Public Utilities Commission (PUC). Current procurement activities include:MECO:MolokaiLanaiCOMPETITIVE BIDDINGHECO:KauaiOahuKIUCSTATETOTAL2013NiihauA Request for Proposals (RFP) for 600-800 gigawatt-hours (or 200 MW) of as-availablerenewable electricity for use on Oahu is being redrafted per a July 2013 Order from the PUC.The redrafted RFP will remove references to the Lanai Wind Project and eliminatesolicitations for an undersea transmission cable. Also in July 2013, the PUC opened a newdocket to examine whether the cable may be in the public interest.On 7/11/13, the PUC closed the competitive bidding proceedings to acquire up to 50MW ofnew, renewable firm dispatchable capacity generation resources on the island of Maui. Thecommission will consider future requests from MECO to open another proceeding to conducta RFP for firm generation upon a demonstration of need and a plan focused on customerneeds.HELCO: A RFP for up to 50 MW of geothermal capacity, for use on Hawaii Island, was released on2/28/2013; six proposals were received and are under consideration. Generation is desiredon-line 2018 to 2023, or earlier.MauiKahoolaweHawaii’s ElectricUtility ServiceTerritoriesNHawaiiCONVERTING MW OF CAPACITY INTO MWh OF ELECTRICITY PRODUCTIONGenerators do not always produce at full capacity, due to resource limits (sun not shining, windnot blowing), maintenance requirements, or power not needed.The “capacity factor” is the percent of time a facility is expected to operate at full capacity (orits equivalent, in terms of energy production) over a one year period. For example, if a facilityhas a capacity of 1 MW and a capacity factor of 100%, it will generate 1MW x 24hours/day x365 days/year 8760 MWh per year.CAPACITY FACTOR ASSUMPTIONSFOR RENEWABLE RESOURCESCapacity Factors(assumed)*MWh producedper MW capacity 19Biomass-Direct Firing80%7,000Wind (Oahu, Hawaii, Kauai)**35%3,100Wind (Lanai, Molokai)40%3,500Wind (Maui)45%3,900Geothermal96%8,400Hydro44%3,900Solar (rooftop)23%2,000Solar (utility)24%2,100Ocean35%3,100Capacity factors presented in this table are assumptions used by Booz Allen, under contract to theNational Renewable Energy Laboratory, in the Hawaii Clean Energy Initiative Scenario Analysis,Appendix C, Slide 26. March 2012.*Actual capacity factors may vary from the assumptions presented here. **The Pakini Nui wind farm(on Hawaii island) generally has an annual capacity factor of over 60%.2 DBEDT Hawaii State Energy Office Hawaii Energy Facts & Figures, November 2014
Electric Utilities: Customers & RatesResidential electricity use, rates, and average bills are shown below for 2013 and 2012.20In general, rates were fairly stable and electricity use declined, so bills also declined.Residential Electricity Use, Rates, and Average Bill, 2013OahuHawaiiKauaiMauiMolokaiLanaiStateAverage use(kWh/month)523473464557329430514Average costper kWh 0.35 0.42 0.44 0.38 0.46 0.46 0.37Averagemonthly bill 181 199 205 211 153 199 189NET ENERGY METERINGCustomers who generate renewable solar, wind, hydro, or biomass energy on their ownproperty may be eligible for “net energy metering” (NEM) to offset their own use. Residential Electricity Use, Rates, and Average Bill, 2012OahuHawaiiKauaiMauiMolokaiLanaiStateAverage use(kWh/month)561494465574345413543Average costper kWh 0.35 0.42 0.45 0.39 0.46 0.47 0.37Averagemonthly bill 197 210 209 222 159 192 203 FEED - IN TARIFF (FIT)Renewable electricity suppliers with generators smaller than 5 MW may be eligible to21participate in the HECO Companies’ Feed in Tariff, supplying as-available power to the utilityat constant, contracted rates over 20 years. The FIT queue, managed by the Accion Group, lists22117 active (57 MW) and 64 reserve (42 MW) projects as of September 2014.23 If the customer uses more electricity than is produced, the customer pays for that netamount.If the customer produces more electricity than used, the customer pays a minimumbill (e.g. 17 for Oahu residential customers) or customer charge, and excess creditsare carried forward to the next month, for up to 12 months.About 10% of Hawaii’s residential electric utility customers had NEM agreements as24of December 2013.As of December 2013, there were more than 38,700 NEM systems, with a total25capacity exceeding 234 MW, installed statewide.On 8/26/14, under PUC Docket 2001-0206, the HECO companies delivered to the PUCthe Reliability Standards Working Group distributed generation interconnection plan(DGIP). The DGIP is presently under review and should “include actionable strategiesand implementation plans for distribution system upgrades and utilization ofadvanced inverter technical functionality to enable distribution circuit solar PVpenetrations to be increased over time in a safe and reliable manner.”2627KIUC: New interconnections use Schedule Q (100 kW or less) and “NEM Pilot”(200 kW or less; 20 /kWh for excess).1IslandTierFeed-in Tariff (FIT) Rates, Hawaiian Electric Companies' Service AreasAllIslandsOahu23Maui &HawaiiLanai &MolokaiOahuMaui &HawaiiPhotovoltaics (PV)rate( /kWh)21.8 *27.4 **18.9 *23.8 **18.9 *23.8 **18.9 *23.8 **19.7 *23.6 **19.7 *23.6 **sizelimit20 kW500 kW250 kW100 kW5 MW2.72 MWConcentrating SolarOn-Shore WindIn-line HydroPower (CSP)ratesizeratesizeratesize( /kWh)limit( /kWh) limit( /kWh) limit26.9 *20 kW16.120 kW21.3 20 kW33.1 ***25.4500 kW13.8 100 kW18.9 100 kW27.5 ***25.4500 kW13.8 100 kW18.9 100 kW27.5 ***25.4100 kW13.8 100 kW18.9 100 kW27.5 ***31.55 MW12.05 MW--33.5 ***31.52.72 MW----33.5 *** With tax credit of 35%. ** With tax rebate of 24.5%.HECO and the Independent Observer submitted a joint plan to the PUC for administering the FITqueues in September 2013.Rates may be modified by the PUC if Federal or State tax laws change.FIT aggregate limits: Oahu: 60 MW; Big Island: 10 MW; Maui, Lanai, Molokai (combined): 10 MWSample Locational Value Maps for HECO, HELCO, and MECO Service Territories3 DBEDT Hawaii State Energy Office Hawaii Energy Facts & Figures, November 2014
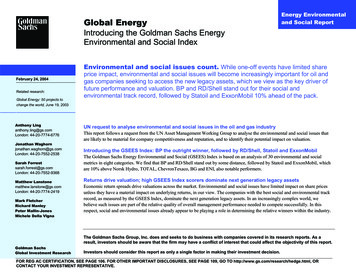
Renewable Energy28“Renewable Energy” is energy from: Sun (i.e. solar) Wind Falling water (i.e. hydropower) Bioenergy, including biomass (e.g. crops, agricultural and animal residues, municipaland other solid waste); biofuels, and biogas Geothermal Ocean water, including ocean thermal energy conversion (OTEC) and wave energy Hydrogen produced from renewable energy sourcesIn 2013, approximately 18% of Hawaii’s electricity was generated from renewable sources.Renewable electricity production is primarily from bioenergy, wind, and geothermal, with29solar, especially distributed photovoltaics, increasing rapidly.Electricity must be used, transmitted, or stored at the instant it is produced. If renewableenergy is not used when it’s produced, it is usually curtailed (i.e., not used).Baseload generation facilities produce energy at a constant rate. They generally do not react(ramp up or ramp down) quickly.Dispatchable (cycling and peaking) units produce power when called upon by the utility, to fillgaps between production and load; they can ramp up and down quickly.Independent power producer contracts may govern which units are brought on-line(dispatched) first when load is increasing, and which are taken off-line first, when load isdecreasing. A new facility generally will not displace an older facility’s place in the dispatchorder, unless there is a technical reason for the utility to do so.Intermittent (as-available) energy, such as from photovoltaic and wind independent powerproducers, may be curtailed at times of low load. The yellow line in the graph shows solarsystems, on a sunny day, reducing mid-day demand for electricity from other sources.Electric vehicle charging, if managed so that it occurs at times of low load, can use energy thatotherwise may have been curtailed.120%Source: Renewable Portfolio Standards Status Reports, 2007-2013 (Hawaii Public Utilities Commission)Solar (Sunny Day)State Hawaii Maui LanaiMolokaOahu KauaiRenewable resource potential, statewide, is greater than current electricity demand.30CurtailmentDemandRE PotentialBiomassDemandRE PotentialHydroDemandWindRE Potential40%Cycling (Load Following) Units20%Baseload(Firm power: geothermal, coal, waste-to-energy)SolarDemand60%Independent Power Producer - OldDemand(SystemLoad)Geothermal80%Independent Power Producer - NewDemandRE t of Peak Load10% EV,9PM 3AMchargingPeaking (QuickResponse) Units9pm 11pm0%OceanRE PotentialDemandAnnual UseRE PotentialPercent of Hawaii’s electricityfrom renewable sources (2013)Renewable generation required(RPS) by 12/31/2020DemandRE le generation required (i.e. RenewablePortfolio Standard, “RPS”) by 12/31/2015 31Renewable generation required (RPS) by12/31/203015%40%15,000Renewable Electricity Potential and Demand by Island, Gigawatt-hours4 DBEDT Hawaii State Energy Office Hawaii Energy Facts & Figures, November 2014
“Levelized Cost of Energy” is the price per kilowatt-hour required for an energy project tobreak even; it does not include risk or return on investment. Costs (land, construction, labor)are different for every project.32The Transparent Cost Database compiles cost information from studies and projects acrossthe United States. The box & whisker chart below shows the data distribution using fivenumbers: The minimum (bottom of the whisker), lowest 25% (below green box), median,highest 25% (above blue box), and maximum point (top of the whisker). Where fewer thanthree data points are available, the individual data points (green diamonds) are shown. Yellowdiamonds are US Department of Energy estimates.MaximumUpper 25%MedianLower 25%Minimum5 DBEDT Hawaii State Energy Office Hawaii Energy Facts & Figures, November 2014
Bioenergy“Bioenergy” includes both electricity generation and fuel production from biomass.Biomass is plant and animal matter, including energy crops, wood, grasses, algae, vegetableoils, and agricultural and municipal wastes. Bioenergyproduction potential in Hawaii depends on theavailability of land and feedstock; CO2 sources (foralgae); markets and values for primary products(electricity, fuels) and by-products (animal feed); and overall revenues compared to costs.Hawaii’s demand for liquid fuels is shown below. Locally-produced biofuels could be blendedwith several petroleum-based fuels listed in the table.Hawaii’s Liquid Fuel Demand RTATIONCOMMERCIAL AVIATIONMARINETRANSPORTATIONMILITARY USEOTHER USESTOTAL (Rounded)FuelFuel OilDieselNaphthaGasolineDieselJet FuelBunker FuelDieselJP8 JetJP5 JetDieselMethane, PropanePetroleum-based fuelsBiofuelGoal(million gallons per year) 33(mgy)3909043040040501450701308025% (32 mgy)10renewable by201840601800 mgy (1.8 billion gallons/yr)Bioenergy facilities: Kauai: Green Energy is building a 6.7 megawatt biomass-fired generator that willproduce 11% of Kauai’s electricity once completed.34 Oahu: H-POWER produces 5% of Oahu’s electricity from trash. Maui:o Hawaiian Commercial and Sugar (HC&S) generates 4% of Maui’s electricity from thefiber (bagasse) by-product of sugar production.o Maui County has contracted for an Integrated Waste Conversion and Energy35Project which could have a capacity of 1.5 MW Hawaii Island: Hu Honua is developing a 21.5 MW facility that will produce 10% of theBig Island’s electricity when completed.Waste materials (such as used cooking oil) and by-products from food, feed, or fiberproduction, although limited in quantity, are often the first bioenergy feedstocks due to theirrelatively low cost and the need for reduced waste management costs.Since biodiesel fuel imports for electricity production began in 2010, the relative cost of theimported biodiesel fuel has been significantly higher than for the fossil-based fuels used for36electricity generation in Hawaii. In June 2014, fuel oil averaged 129.47/bbl, diesel fuel37averaged 139.34/bbl, and biodiesel averaged 197.98/bbl.Crops may also be cultivated to produce biomass materials (oils, fiber, sugar) usable forelectricity or fuel production.Studies indicate that 136,000 suitable acres could be available without displacing current farmingin Hawaii; with biomass production of 10 - 20 tons of fiber per acre per year, potential would be38about 1.4 - 2.7 million tons of biomass per year. As a reference, two million tons of biomass, ifburned in conventional biomass combustion processes, would generate energy equivalent 39 totwo million barrels (84 million gallons) of oil. Or, two million tons could be converted (at 8040gallons per ton, via thermochemical processes) into 160 million gallons of fuel.Algae has also been receiving attention, due to high yields per acre and potential use of CO2. The11 million tons of CO2 produced by large energy facilities (power plants and refineries) in Hawaiicould theoretically support the production of over 400 million gallons of oil per year.Hawaii Biofuel ProjectsFacilityAina Koa PonoBig Island BiodieselCellanaHawaii BioEnergy,LLC Renewable FuelsProjectInput (feedstocks)1. Remove invasivespecies. 2. Plant crops.Used cooking oil, greasetrap waste, crop oilsAlgaeEucalyptus, energygrasses, otherHawaiiGasRenewable NaturalGas (RNG) PlantPhycalAnimal and plant fatsand oilsUOP HoneywellIntegratedBiorefineryWoody materials,agricultural residues,algaeAlgaeOutput (products)Renewable diesel,gasoline, biocharBiodiesel, glycerin,animal feedAlgae oil, animal feedRenewable fuel oil,jet fuel, gasoline;feeds, fertilizers,electricity possibleRenewable methane,hydrogen, propaneProduction Capacity24 million gallons per year(mgy) (planned)5.5 mgy (built)Fuel oil; renewablejet fuel; renewabledieselRenewable gasoline;diesel; jet fuel100,000 gallons per yearpilot, followed by 3 mgydemonstration (planned)62,000 gal/y, pilot(planned); 50 mgy facility(potential)1.26 mgy (planned)Fuel oil replacement: 20mgy (planned)1 mgy (built)Biofuel, a renewable energy source that can be stored and transported in a manner similar tofossil fuels, can often be used in existing equipment and be blended with petroleum fuels.One ton of biomass replaces approximately one barrel of oil.Hawaii’s current use of petroleumbased fuels (million gallons/yr)Target cost per gallon, bio-based jetfuel 42Median Levelized Cost of Biomass43Energy1,800 36 /kWhAlgae oil yields demonstrated onKauai 41Pounds of animal feed per gallonof biodiesel from crop oilAnimal feed used in Hawaii(million pounds/year) 442000gal/acre25100-2006 DBEDT Hawaii State Energy Office Hawaii Energy Facts & Figures, November 2014
Electric VehiclesAn electric vehicle (EV) uses electricity in place ofgasoline, reducing the need for petroleum-based fuel.Since EVs can use electricity produced from renewableresources available in Hawaii (i.e. sun, wind, hydropower,ocean energy, geothermal energy), the transition fromgasoline fueled vehicles to EVs supports Hawaii’s energy independence goals.Based on statewide averages, the amount of fossil fuel used to power an electric vehicle in45Hawaii is 31% less than the fossil fuel required to power a similar gasoline-fueled vehicle.This is expected to get even better as renewable energy increases in Hawaii.Registered Electric Vehicles (EVs)and Publically Available Charging Stations in Hawaii, September 2014ElectricVehiclesLevel 2 46Charging StationPortsLevel 3 47Charging tyKauaiState of Hawaii9332129214091349EVs have a greater initial purchase price than comparable gasoline-fueled vehicles. Mostexperts, including Hawaii’s auto dealers, believe that wid
Hawaii is the only state that depends so heavily on petroleum for its energy needs. Whereas less than 1% of electricity in the nation is generated using oil, in 2012 Hawaii relied on oil f