Transcription
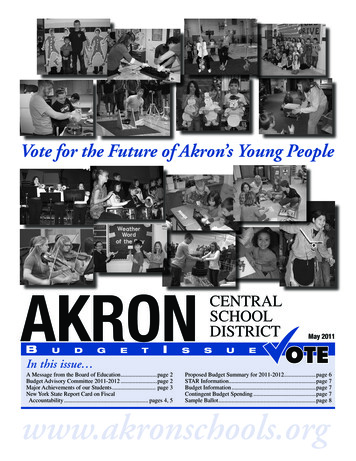
Vote for the Future of Akron’s Young PeopleAKRONBudgetIsCENTRALSCHOOLDISTRICTsuMay 2011eIn this issue A Message from the Board of Education.page 2Budget Advisory Committee 2011-2012.page 2Major Achievements of our Students. page 3New York State Report Card on FiscalAccountability. pages 4, 5Proposed Budget Summary for 2011-2012.page 6STAR Information.page 7Budget Information.page 7Contingent Budget Spending.page 7Sample Ballot.page 8www.akronschools.org
Page 2A Message from the Board of EducationA Message From the Board of EducationDaniel CaprioPresidentKevin StoneVice-PresidentMark BramleyJody BregeFrancis DahillPhillip KenlineDavid PennSuperintendentof SchoolsRobin B. ZymrozDear District Residents:This budget season has been the most challenging we have experienced in more than two decades.While the New York State budget was adopted on time, it calls for a decrease to education fundingestimated to be 1.3 billion. In addition, this state budget follows two years in which aid has been “frozen”and redistributed to districts via the foundation aid formula. Rural/suburban school districts in upstateNew York, like Akron, have suffered the greatest. We are experiencing an expected revenue shortfall ofnearly 2.6 million for the upcoming 2011-12 school year; and as the need for reductions accumulates,year after year, it becomes more and more difficult to spare instruction and student services.In these critical times, Boards of Education face increasingly difficult decisions regarding what is bestfor students and districts. The proposed Akron Central School budget for 2011-12 recommends anexpenditure plan of 28,996,791 and reflects necessary reductions in our administrative, program andcapital expenditures in response to the 2.6 million in lost state aid. The adopted budget represents amodest increase of less than 1% (0.13%) from 2010-11 and maintains our commitment to preserving ourinstructional program and our desire to support student development in the arts and athletics.We have worked diligently to develop a financial plan that not only addresses the substantial loss of stateaid in this year’s state budget, but one that continues to support our mission of excellence for our students,uses our reserves sensibly given the economic uncertainty of future years, and refrains from placing undueburden on our taxpayers. It is our hope that as the New York State economy recovers, we will be able torestore programs and positions lost as a consequence of years of diminishing state aid support.On the following pages you will find a detailed description of the proposed budget and school highlightssupporting the many accomplishments of our students. If you have any questions please contact Mrs.Robin Zymroz, Superintendent of Schools, by phone at 542-5006 or e-mail at rzymroz@akronschools.org.Please remember to vote on May 17, 2011 between noon and 9:00 p.m. in Gym #3 (Orange Gymnasium)located adjacent to the upper parking lot of the High School.Very truly yours,Akron Board of EducationThank You to the Members of the 2011Budget Advisory CommitteeCarole BorchertChristopher GinestreFred PaskDaniel BorchertSuzanne GuytonCarl PattersonDarlene BramleyRichard HegmannScott PayneJody BregeKeith HochreiterWesley RehwaldtDaniel CaprioMary KalinowskiMelissa SanfordJoseph CaprioPhillip KenlineGina SarowDouglas DaileyJoseph LucentiColleen ScotchThe polls will be open from12:00 Noon - 9:00 p.m.Dawn DojnikJessica MatusekCynthia TretterRichard EhrensbergerJames MayroseJudy ZitzkaOrange Gymnasiumlocated adjacent to theupper parking lot of the High SchoolDeby EppolitoPaul MuckRobin B. ZymrozTodd EspositoAnthony PanellaPlease come outand vote onMay 17, 2011!www.akronschools.org
Highlights of our Schools’ AchievementsPage 3Our District Has Enjoyed Many Outstanding Moments in 2010-2011At the Elementary School level At the Middle School level . Grade 3-5 NYS ELA – 67.2% scored at Levels3 and 4 in 2009-10 despite drastic changes tocut score measures by NYS Educ. Dept. (Stateaverage is 54.6%) Grades 3-5 ELA – Number of students achievingLevel 4 increased to 15.5% from 13% despite cutscore changes. Grade 3 ELA – In 2009-10 - 71% scored atLevels 3 and 4 as compared to 55% statewide. Grade 4 ELA – In 2009-10 - 67% scored atLevels 3 and 4 as compared to 57% statewide. Grade 5 ELA – In 2009-10 - 63% scored atLevels 3 and 4 as compared to 52% statewide. Grade 4 NYS Science – 96% scored at Levels 3and 4 in 2009-10 as compared to 92% in 200809. Percentage of students scoring a Level 4increased from 54% to 62% in 2009-10. Grade 3-5 Math – 96.1% scored at Levels 2-4in 2009-10 despite drastic changes to cut scoremeasures by NYS Educ. Dept. (State average is93.3%) Grade 5 Math – 73% scored at Levels 3 and 4 ascompared to 65% statewide. 4th and 5th grade choir led by ElementaryMusic teacher Mrs. Kim Stachowski performedat Kleinhans Music Hall for Community NightMusic Program for 12th consecutive year. The implementation of Response to Interventionand AIMSweb in Grades K-2 has positivelyimpacted our efforts to better serve the literacyneeds of all students. Elementary service learning opportunitiesgenerated over 3,000 food items for the AkronNewstead Food Pantry as well as a combined 3400 for the Pennies for Patients and JumpRope for Heart Health Campaigns. Elementary students participate successfully inachieving reading goals with support from ourReading Department, teachers across the gradelevels, the elementary office, the PTA, DarienLake (Read to Ride), Perry’s Ice Cream and theBuffalo Sabres (Shoot, Score, Read More). Each grade level participated in the celebrationclosing the building project by providing goods,for a time capsule that will be opened in 50 years. The elementary PTA efforts to gather box topsresulted in Akron receiving “Top Ten” statusin NYS; this translated into more learningopportunities for all students. The following middle school strings students,under the direction of Mrs. Komosinski, wereselected to perform in a sectional All-StateEnsemble: Emma Conway, Maggie Kowalik,Anna Pisano, Carly Staebell, Kaitlyn Stachowiakand Jessica Wood. Students in Mrs. Carlson’s 6th grade Readingand Writing and English Language Arts classesexplored the power of using Web 2.0 toolsfor project-based learning that encompassedDistance Learning to enhance critical thinkingand technology skills in collaboration withthe Buffalo Zoo. The multiple uses of digitaltechnology support a broad scope of learningstandards essential to raise state test scores andmotivate all students to be in charge of their ownlearning with classroom to community activitiesfor real audiences. Three teams of Akron Middle school studentsalong with their teachers Mrs. Zuba & Mrs.Graham participated in a physics competition atBuffalo State College. Our 8th grade Middle School team of BeckyLobur, Zach Pfentner, Mack Lasker, and CarrieAkin took first place in the Physics Obstaclecourse out of all participating Middle Schools. The 7th grade team consisted of Emma Chubb,Emily Buckley, Ryan Meek, and Evan Venter.The 6th grade team consisted of James Gibbs,Sydney Leeds, Cierra Janis, and Alex Koch. Allteams put forth great effort. Musicians Kayleah Aldrich, Leah Czechowski,Cameron Harsch, Maggie Kowalik, CarlyStaebell, and Kaitlyn Stachowiak were chosento play in an All-County ensemble. Kudos toRachel Heim and Cierra Janis for being chosen asalternates. The following Akron Middle School ArtDepartment students were chosen to display theirwork at Guy’s Subs: 8th grader, Paige Buscaglia;7th graders, Henryetta “Henry” Jones and JennaLittle; 6th graders Breiann Hager and CierraJanis. The school Leadership Team coordinated along-term celebration to reward all middle schoolstudents that were able to Act Responsibly,Maintain Safety and Show Respect consistently.86 percent of our students met the criteria forparticipation indicating great strides in students’ability to successfully negotiate the pressures andchanging demands of middle school personal andacademic growth. The Seneca 7 and 8 students worked on a crosscultural unit culminating in using traditionalmethods for making Haudenosaunee cornbread.The study of the Seneca language requiresstudents to reflect on traditional culturalvalues through activities which enhance anunderstanding of Native American traditions bothhistorical and contemporary.At the High School level . Akron High School is ranked 4th in 113 WNYdistricts for high achievement on NYS Regentsexams. Varsity field hockey goalie, Shannon Winney, wasnamed Channel 7 #3 Athlete of the Week. Katie Mapley was named Commended Student inthe 2011 National Merit Scholarship Corporation. The following students were selected toparticipate in a sectional All-State Musicensemble: Leah Bisson, Nathan Bryk, LaurenDorobiala, Meghan Grant, Jennifer Komosinski,Nina Komosinski, Luke Klimchuk, JacobKlimchuk, Jessica Lobur, Mardi Mangus.Alternates: Nate Borchert & Jessica Cobti The JV Field Hockey team played the Play ForThe Cure game raising 700 for the AmericanCancer Society in memory of Miss CandyKruschke. Varsity Girls Soccer Team earned N-O LeagueChampion Title. Varsity Boys Soccer Team earned N-O LeagueChampion Title. Varsity Field Hockey finished 2nd in the League. Varsity Boys Soccer team advanced to the NYSfinal four competition. Jaime Salcedo earned an individual All-WNYScholar Athlete. Three Boys Varsity Soccer werenamed as 1st Team All-WNY Soccer players:Jaime Salcedo at midfield, Nathan Borchert atdefense, and Sam Torrelli as goalie. The following students are local winners of the2010 National PTA Reflections Contest: AshleyGielow, Jessica Lobur, Ellen Papke, RachelRobinson, Brittany White and Joshua Weeks. Tyler Zbytek signed to play NCAA football forBucknell University. Travis Willard, Dylan Jonathan, Marc Waltersand Brendan Frey took 2nd place while TimMcGorray, Lauren Cianfrini and Matt Carberrycame in 3rd out of 20 other structures at theNCCC Tech Wars. Nathan Jones and NateSweitzer dominated the on-site engineeringchallenge. Jacob Stone was selected as the All State ScholarAthlete for Football in Class B. Five students from Akron High School wereamong the honorees from Erie 1 BOCESHarkness Career & Technical Center: AndrewO’Brien, Justina Helta, Katelynn Lang, JenniferMcKissick and Amanda Stabell.
Page 4New York State Report CardSDL: 1491LEA: 142101040000The New York State School Report CardFiscal Accountability SupplementforAkron Central School DistrictNew York State Education Law and the Commissioner's Regulations require the attachment of the NYS SchoolReport Card to the public school district budget proposal. The regulations require that certain expenditure ratiosfor general education and special education students be reported and compared with ratios for similar districtsand all public schools. The required ratios for this district are reported below.2008-2009 School YearGeneral EducationSpecial EducationThisSchoolDistrictInstructional ExpendituresPupilsExpenditures Per Pupil 13,671,5421,660 8,236 3,711,419170 21,832SimilarDistrictGroupInstructional Expenditures 7,988,861,195 2,951,989,735PupilsExpenditures Per Pupil828,326 9,645115,502 25,558Total of AllSchoolDistricts inNY StateInstructional Expenditures 29,417,505,672 10,926,323,8992,705,290411,516 10,874 26,551PupilsExpenditures Per PupilSimilar District Group Description: Average Need/Resource CapacityInstructional Expenditures for General Education are K-12 expenditures for classroom instruction (excluding Special Education) plus a proration of building level administrative and instructional support expenditures. These expenditures include amounts for instruction of students with disabilities in a general education setting. District expenditures, such as transportation, debt service, and district-wide administration, are not included.The pupil count for General Education is K-12 average daily membership plus K-12 pupils for whom the district pays tuition to anotherschool district. This number represents all pupils, including those classified as having disabilities and those not classified, excluding onlystudents with disabilities placed out of district. For districts in which a county jail is located, this number includes incarcerated youth towhom the district must provide an education program.Instructional Expenditures for Special Education are K-12 expenditures for students with disabilities (including summer special educationexpenditures) plus a proration of building-level administrative and instructional support expenditures. District expenditures, such as transportation, debt service, and district-wide administration, are not included.The pupil count for Special Education is a count of K-12 students with disabilities as of October 1, 2008 plus students for whom thedistrict receives tuition from another district plus students for whom the district pays tuition to another district. Students attending the Stateschools at Rome and Batavia, private placements, and out-of-state placements are included.Instructional Expenditures Per Pupil is the simple arithmetic ratio of Instructional Expenditures to Pupils. The total cost of instruction for students with disabilities may include both general and special education expenditures. Special education services provided in the general education classroom may benefit students not classified as having disabilities.2008-2009 School YearTotal Expenditures Per PupilThis SchoolDistrictSimilar DistrictGroupTotal of All SchoolDistricts in NY State 15,324 17,709 19,381Total Expenditures Per Pupil is the simple arithmetic ratio of Total Expenditures to Pupils. Total Expenditures include district expendituresfor classroom instruction, as well as expenditures for transportation, debt service, community service and district-wide administration thatare not included in the Instructional Expenditure values for General Education and Special Education. As such, the sum of General Education and Special Education Instructional Expenditures does not equal the Total Expenditures.The numbers used to compute the statistics on this page were collected on the State Aid Form A, the State Aid Form F, the School DistrictAnnual Financial Report (ST-3), and from the Student Information Repository System (SIRS).
New York State Report CardPage 5SDL: 1491LEA: 142101040000The New York State School Report CardInformation about Students with DisabilitiesforAkron Central School DistrictNew York State Education Law and the Commissioner's Regulations require the attachment of the NYS SchoolReport Card to the public school district budget proposal. The regulations require reporting students with disabilities by the percent of time they are in general education classrooms and the classification rate of students withdisabilities. These data are to be compared with percentages for similar districts and all public schools. The required percentages for this district are reported below.Student Counts as ofOctober 7, 2009Student Placement -Percent of Time InsideRegular ClassroomThis School DistrictSimilar DistrictGroupTotal of All SchoolDistricts in NY StateCount ofPercentage ofStudents with Students withDisabilitiesDisabilitiesPercentage ofStudents withDisabilitiesPercentage ofStudents withDisabilities80% or more11179.3%57.7%55.6%40% to 79%64.3%11.7%Less than 40%139.3%19.1%17.3%23.1%Separate Settings107.1%3.8%6.0%Other Settings00.0%2.2%3.7%The source data for the statistics in this table were reported through the Student Information Repository System (SIRS) and verified inVerification Report 5. The counts are numbers of students reported in the least restrictive environment categories for school-age programs(ages 6-21) on October 7, 2009. The percentages represent the amount of time students with disabilities are in general education classrooms, regardless of the amount and cost of special education services they receive. Rounding of percentage values may cause them tosum to a number slightly different from 100%.School-age Students with Disabilities Classification Rate2009-10 School YearSpecial Ed Classification RateThis SchoolDistrictSimilar DistrictGroupTotal of All SchoolDistricts in NY State9.24%12.3%13.2%This rate is a ratio of the count of school-age students with disabilities (ages 4-21) to the total enrollment of all school-age students in theschool district, including students who are parentally placed in nonpublic schools located in the school district. The numerator includes allschool-age students for whom a district has Committee on Special Education (CSE) responsibility to ensure the provision of special education services. The denominator includes all school-age students who reside in the district. In the case of parentally placed students innonpublic schools, it includes the number of students who attend the nonpublic schools located in the school district. Source data aredrawn from the SIRS and from the Basic Education Data System (BEDS).Similar District Group Description: Average Need/Resource CapacitySimilar District Groups are identified according to the Need-to-Resource-Capacity Index defined and used in the Annual Report to the Governor and Legislature on the Educational Status of the State's Schools.
Page 6Proposed Budget Summary 2011-20122011-2012 Proposed ExpendituresInstruction 13,834,71247.71%Employee Benefits 5,698,76019.65%General Support 1,278,1594.41%Bond Principal & Interest 5,036,38317.37%Operations & Maintenance 1,861,4286.42%Transportation Services 1,287,3494.44%Final Budget2010-11%InstructionTransportation ServicesOperations & MaintenanceBond Principal & InterestGeneral SupportEmployee BenefitsTotal Expenditures 6,220 28,958,370Proposed Budget2011-12%48.97%4.60%6.31%17.24%4.25%18.63% 8,76047.71%4.44%6.42%17.37%4.41%19.65%100.00% 28,996,791100.00%2011-2012 Anticipated RevenuesAppropriated Fund Balance 2,200,000Native American Aid7.59% 1,054,0003.63%Other 1,531,3585.29%Federal Aid 50,0000.17%State Aid 14,250,00049.14%Erie CountySales Tax 1,100,0003.79%Property Tax 8,811,43330.39%Final Budget2010-11%Proposed Budget2011-12%State AidProperty TaxErie County Sales TaxFederal AidNative American AidAppropriated Fund BalanceOther 301,096,00050.71%28.98%3.80%0.17%3.64%8.91%3.79% tal Revenues 28,958,370100.00% 28,996,791100.00%
Proposed Budget Summary 2011-2012Page 72011-2012 Required Budget Vote Format2010-11 2011-12Budget%Proposed Budget%AdministrativeCapitalProgram 2,964,160 7,184,676 18,809,53410.24%24.81%64.95% 2,921,103 7,431,029 18,644,65910.07%25.63%64.30%Total Budget 28,958,370100.00% 28,996,791100.00%Prior year totals were restated to reflect a change in classification for two salaries.Administrative 2,921,10310.07%Capital 7,431,02925.63%Program 18,644,65964.30%STAR Program InformationSTAR ProgramThe New York State School Tax Relief Program (STAR) provides New York homeowners with partial exemptions from school property taxes. If you earn less than 50,000 and own and live in your home, you are probably eligible for the STARexemption.Basic STAR is available for owner-occupied, primary residences where the owners’total income is less than 50,000. Basic STAR works by exempting the first 30,000of the full value of a home from school taxes.Enhanced STAR provides an increased benefit for the primary residences ofs
instructional program and our desire to support student development in the arts and athletics. . levels, the elementary office, the PTA, Darien Lake (Read to Ride), Perry’s Ice Cream and the Buffalo Sabres (Shoot, Score, Read M