Transcription
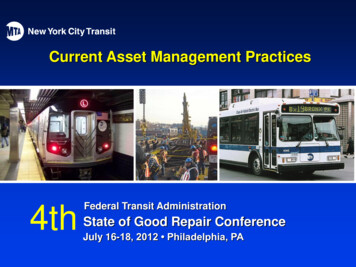
Current Asset Management Practices4thFederal Transit AdministrationState of Good Repair ConferenceJuly 16-18, 2012 Philadelphia, PA
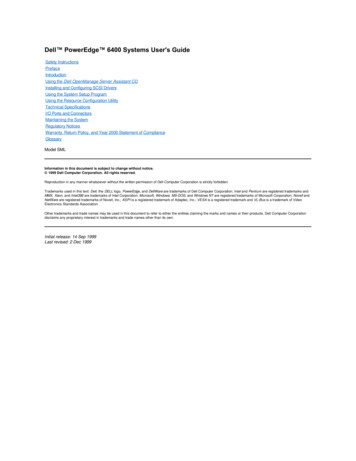
Overview of AssetsVisible Infrastructure 6,737 Railcars 4,336 Buses 468 Stations (with 409elevators/escalators)
Overview of AssetsInvisible Infrastructure230 Pump Rooms216 Power Substations720 Miles of Track3,446 Miles of Power Cabling190 Fan Plants16 Railcar Maintenance/Overhaul Shops24 Rail Yards728 Signal track miles (183 interlockings)1,541 Mainline Switches23 Bus Depots/Shops136 Subway tunnel route miles70 Elevated structure route miles22 At-grade route miles
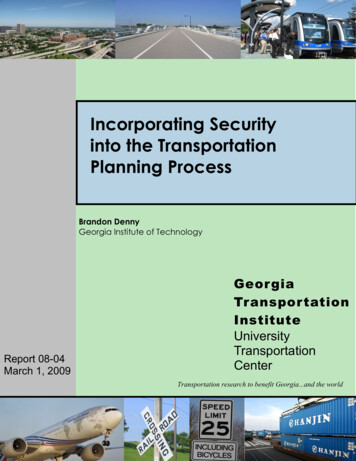
Capital Planning Process20-Year Needs AssessmentAsset Inventory andCondition AssessmentInvestment Pace& Strategy20-Year InvestmentSummariesRolling Five-Year Plan ProcessProjectProblem StatementProjectScopingDesign/Construction
20-Year Needs AssessmentStep One - Asset Inventory & Conditions Asset inventory updated by user groups Includes location, age, most recentcapital investment, and a 1-4 conditionrating Condition of assets: typically an extract ofmore detailed maintenance data Determination of whether asset is in good repair or not
20-Year Needs AssessmentStep Two - Investment Pace and Strategy Statements Statement required for eachinvestment group (e.g., signals,station rehabilitation) Provides rationale/justification forlevel of investment and timing Pace and strategy also guided byother agency planning efforts (e.g.,compliance issues, operationsdirectives, constructability)
20-Year Needs AssessmentFinal ProductInvestment strategy of five year increments: Number of units (total #, in SGR) Investment projections, in dollars andunits Updated every five years Broadly defined dollar constraints
Managing the Asset DataProject Status Reporting (PSR) system Home-grown system (Oracle server-Windows client) Project budgets/milestones Project description/purpose Asset records have been added to the system Project-to-asset linkages for reporting on capital projectsfrom asset perspective Outputs include: Capital program progress to MTA Board Website information Federal biennial “satisfactory continuing control” Continual enhancements with a dedicated staff of applicationspecialists
Examples of Asset Groups Track Subway Cars Traction Power Stations Each group has different levels of asset management“sophistication” Each has different levels of detail depending on themaintainer and the needs of the capital plan and 20year needs process (grain of investment)
Track and Switches720 miles of track, 1,541 switchesMulti-level inspection and assessment protocols;weekly, monthly, quadrennial conditionassessmentsDetailed database by track segment: Defects to be fixed by maintenance. Major issues affecting replacementdecisions, e.g. track type, alignment, etc. Expected remaining useful lifeTrack reconstruction priorities weighed by ROW access opportunitiesCondition data is maintained in Excel spreadsheets based onquadrennial condition assessments
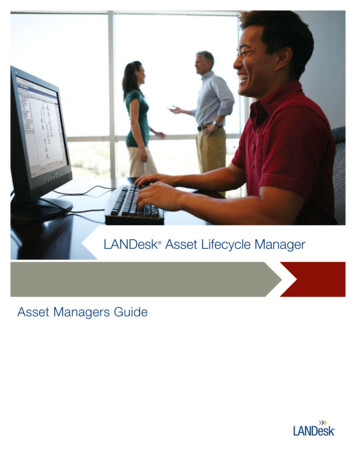
Subway Cars6,737 cars in fleet Replacements programmed on40-year useful life, based onirreparable structural fatigue Detailed investigations influencespecific retirement decisions,e.g. 42-year-old cars retained while36-year-old cars with structuraldeterioration were retired Summary of car class characteristics is extracted from detailedoperating data and maintained in Excel spreadsheets
Traction Power216 substations; 303 circuit breaker houses;3,446 miles of power cablesSubstations components rated separately, informing a componentbased investment strategy Enclosures Rectifiers Utility feeders/transformersExcel spreadsheets updatedfrom operating information Asset condition determinesSGR status
468 Stations277 subway, 142 elevated, 49 at-grade Condition-based survey of stationelements – performed every five years Coordinated consultant teams collectdata over a 12-month period Over 14,000 components rated,including: stairs, platforms,mezzanines, windscreens, andcanopies Condition data kept in an Oracledatabase; allows tracking of repairprogress and updated conditioninformation
NYCT has numerous, complex and sizeable assets to maintainSeveral Means to End Different asset different means of gathering and maintainingasset information Simple spreadsheet toolsValue of Accurate / Timely Data Proper planning leads to fewer surprises Foresees size of problem/scale of the roll-out for assetinvestmentConsistency of Condition Data from Program to Program Changes over time must be explainable by investment,degradation, or obsolescence.
Next StepsMove to enterprise-wide asset management, to align capitalinvestment with maintenance and operations towardoptimal whole-life costs Decide on suitability of available standards: PAS 55, ISO 55000 Design standardized core business processes -- work orders;failure analysis; performance reporting Roll out as a pilot to selected infrastructure categories Develop models for whole life costs, including O&M, capitalrenewal/replacement
Managing the Asset Data . Project Status Reporting (PSR) system Home-grown system (Oracle server-Windows client) Project budgets/milestones Project description/purpose Asset records have been added to the system Project-to-asset linkages for re