Transcription
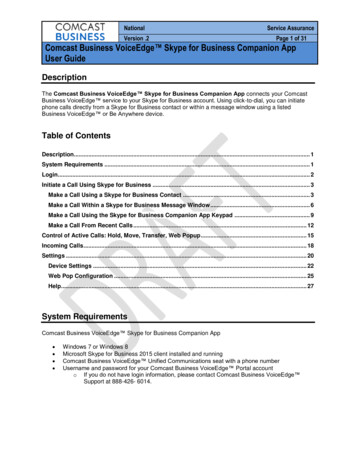
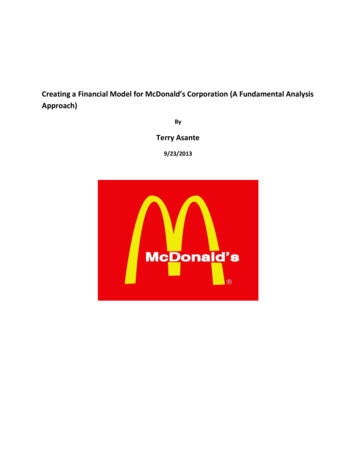
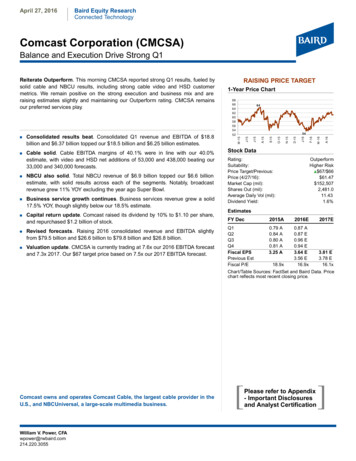
April 27, 2016Baird Equity ResearchConnected TechnologyComcast Corporation (CMCSA)Balance and Execution Drive Strong Q1 NBCU also solid. Total NBCU revenue of 6.9 billion topped our 6.6 billionestimate, with solid results across each of the segments. Notably, broadcastrevenue grew 11% YOY excluding the year ago Super Bowl. Business service growth continues. Business services revenue grew a solid17.5% YOY, though slightly below our 18.5% estimate. Capital return update. Comcast raised its dividend by 10% to 1.10 per share,and repurchased 1.2 billion of stock. Revised forecasts. Raising 2016 consolidated revenue and EBITDA slightlyfrom 79.5 billion and 26.6 billion to 79.8 billion and 26.8 billion. Valuation update. CMCSA is currently trading at 7.6x our 2016 EBITDA forecastand 7.3x 2017. Our 67 target price based on 7.5x our 2017 EBITDA forecast.A-16F-16M-16J-16D-15N-15O-1554S-15Cable solid. Cable EBITDA margins of 40.1% were in line with our 40.0%estimate, with video and HSD net additions of 53,000 and 438,000 beating our33,000 and 340,000 forecasts.64A-15 686664626058565452J-15Consolidated results beat. Consolidated Q1 revenue and EBITDA of 18.8billion and 6.37 billion topped our 18.5 billion and 6.25 billion estimates.1-Year Price ChartJ-15 RAISING PRICE TARGETM-15Reiterate Outperform. This morning CMCSA reported strong Q1 results, fueled bysolid cable and NBCU results, including strong cable video and HSD customermetrics. We remain positive on the strong execution and business mix and areraising estimates slightly and maintaining our Outperform rating. CMCSA remainsour preferred services play.Stock DataRating:Suitability:Price Target/Previous:Price (4/27/16):Market Cap (mil):Shares Out (mil):Average Daily Vol (mil):Dividend Yield:OutperformHigher Risk 67/ 66 61.47 152,5072,481.011.431.6%EstimatesFY Dec2015A2016E2017EQ1Q2Q3Q4Fiscal EPSPrevious EstFiscal P/E0.79 A0.84 A0.80 A0.81 A3.25 A0.87 A0.87 E0.96 E0.94 E3.64 E3.56 E16.9x3.81 E3.78 E16.1x18.9xChart/Table Sources: FactSet and Baird Data. Pricechart reflects most recent closing price.Comcast owns and operates Comcast Cable, the largest cable provider in theU.S., and NBCUniversal, a large-scale multimedia business.William V. Power, CFAwpower@rwbaird.com214.220.3055[Please refer to Appendix- Important Disclosuresand Analyst Certification]
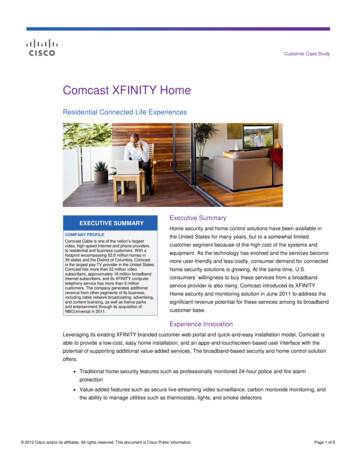
April 27, 2016 Comcast CorporationDetailsValuation Current valuation. Comcast is currently trading at 7.6x our 2016 EBITDA forecast and 7.3x 2017,vs. the cable group at 8-8.5x 2016 and T & VZ at 6.5-7x 2016. Target price. Our 67 target price is based on 7.5x our 2017 EBITDA forecast, which we view asfair relative to the cable and telco peer averages.Revised ForecastsQ2'16 Estimates (000s)Cable RevenueNBCU RevenueTotal RevenueRevised 12,436,660 7,019,745 19,256,405Previous%Change 12,412,5630.2% 7,019,7450.0% 19,232,3080.1%Adj. EBITDAAdj. EBITDA Margin6,604,95234.3%6,589,60233.8%Net IncomeDiluted GAAP EPS2,124,322 0.872,121,348 0.870.1%0.3%Free Cash FlowCapital 7.0%0.0%Video Net AddsBroadband Net AddsVoice Net 50 bps-50.0%0.0%0.0%Source: Robert W. Baird & Co. Estimates2016 Estimates (000s)Cable RevenueNBCU RevenueTotal RevenueRevised 49,943,988 30,754,255 79,823,243Previous%Change 49,767,1260.4% 30,481,0470.9% 79,448,1730.5%Adj. EBITDAAdj. EBITDA Margin 26,771,27833.5% 26,604,36633.5%0.6%0 bpsNet IncomeDiluted GAAP EPS8,824,774 3.648,625,685 3.562.3%2.3%Free Cash FlowCapital .8%-0.3%Video Net AddsBroadband Net AddsVoice Net 7.4%8.7%20.7%Source: Robert W. Baird & Co. EstimatesRobert W. Baird & Co.2
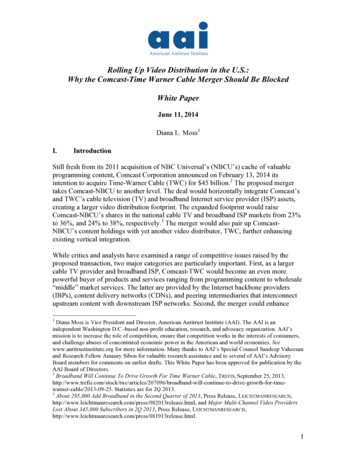
April 27, 2016 Comcast CorporationQ1 SummaryQ1'16 Results (000s)Cable RevenueNBCU RevenueTotal RevenueQ1'16A 12,204,000 6,861,000 18,790,000Year Ago 11,430,000 6,604,000 17,853,000YOY %6.8%3.9%5.2%6,251,55033.8%%0.8%4.1%1.6%Adj. EBITDAAdj. EBITDA Margin6,367,00033.9%5,956,00033.4%Net IncomeDiluted GAAP EPS2,134,000 0.872,059,000 0.793.6%9.4%1,944,383 0.799.8%9.7%Free Cash FlowCapital 1.9%9.2%2,227,0701,909,10026.0%-1.3%Video Net AddsBroadband Net AddsVoice Net 00067,00060.6%28.8%52.2%(8,000)407,00077,0006.9%50 bpsEstimate 12,108,057 6,587,792 18,495,8491.8%10 bpsSource: Robert W. Baird & Co. EstimatesInvestment ThesisBest-in-class consumer cable business driven by broadband. With a growing broadband businessand a stabilizing video business, we view Comcast’s consumer cable business as best in class. In Q1,the company added 438,000 broadband subscribers, 102,000 voice subscribers, and 53,000 videosubscribers.Strong ARPU growth. Comcast has generated strong, consistent ARPU growth for the past severalquarters. In Q1, the company generated total ARPU (inclusive of business services) of 146.15,growing 4.1% YOY. Q1 video ARPU of 82.51 grew 3.9% YOY, driven in part by digital and advancedservices adoption.Solid margin outlook despite programming costs. Notably, Comcast expects relatively stable cablemargins in 2016 despite an anticipated 10% ramp in programming costs. We currently forecastconsolidated 2016 EBITDA margins of 33.5%, with cable margins of 40.5%.NBCU asset provides diversification. Comcast’s NBCU acquisition provides revenue diversificationand a solid growth profile. We also view NBCU as somewhat of a hedge against over-the-top, mobile,and other “off channel” video consumption.Business services small, but adds to growth profile. The company has generated strong growth inthe business services segment, with revenue of 1.31 billion growing 17.7% YOY in Q1. Comcast hasbeen particularly successful in the small business space.Returning cash to shareholders. Comcast repurchased 6.75 billion worth of shares in 2015 andplans to repurchase another 5 billion in 2016.Robert W. Baird & Co.3
April 27, 2016 Comcast CorporationConsumer video and broadband markets highly competitive. Comcast faces competition in videofrom both satellite operators and from AT&T and Verizon in many markets. Currently, the companyestimates its U-Verse and FiOS overlap at 20% and 15%, respectively. Additionally, as wirelessspeeds increase, Comcast may someday see broadband competition from LTE providers as well.Over-the-top video poses additional disruption threat. As high-speed broadband access becomesmore ubiquitous and over-the-top offerings become more robust, Comcast may increasingly face videocompetition from players like Netflix, Hulu, YouTube, and iTunes.Risks & CaveatsConsumer video and broadband markets highly competitive. Comcast faces competition in videofrom both satellite operators and from AT&T and Verizon in many markets. Currently, the companyestimates its U-Verse and FiOS overlap at 20% and 15%, respectively. Additionally, as wirelessspeeds increase, Comcast may someday see broadband competition from LTE providers as well.Over-the-top video poses additional disruption threat. As high-speed broadband access becomesmore ubiquitous and over-the-top offerings become more robust, Comcast may increasingly face videocompetition from players like Netflix, Hulu, YouTube, and iTunes.Programming costs could pressure cable margins longer term. Comcast’s Cable video marginsare highly sensitive to video programming costs. In 2016, Comcast expects programming costs togrow 10%.Family control risk. The Roberts family owns 100% of Comcast’s super-voting Class B shares, whichgive the family roughly 33% voting power. Together, Brian and Ralph Roberts own just 0.02% ofComcast’s Class A shares.NBCU TV businesses subject to ratings risk. NBCU’s cable and broadcast businesses aresensitive to patterns in viewership, which can be volatile. Dips in ratings for its broadcast or cableproperties could lead to lower advertising revenue.Sensitivity to economic factors. Comcast’s cable business is sensitive to various economic factors,including the relative strength of the U.S. housing market. Broad economic weakness could also leadto weakness in Comcast’s TV ad business. Additionally, due to the discretionary nature of some ofNBCU’s offerings, including its film and theme park businesses, the company could be affected bychanges in consumer spending patterns.Regulatory risks. Comcast’s cable video business is subject to regulation from federal, state, andlocal governments, and Internet and VoIP regulation could increase over time. Additionally, NBCU’scable, film, and theme park businesses are also subject to various international, federal, and statelaws.Robert W. Baird & Co.4
April 27, 2016 Comcast CorporationCompany DescriptionHeadquartered in Philadelphia, Pennsylvania, Comcast Communications operates two majorbusinesses: Comcast Cable and NBCUniversal. Comcast Cable is the largest cable provider in theUnited States, passing 55.7 million homes. The business provides cable video, broadband, and voiceservices to consumers. Additionally, Comcast Cable provides services to small and medium-sizedbusinesses. Comcast Cable’s top markets include Philadelphia, Atlanta, Boston, Chicago, and Detroit.NBCU operates a series of entertainment-related businesses including its cable networks, broadcastnetworks, film, and theme parks businesses. NBCU’s assets include cable properties like USANetwork and CNBC, Broadcast channels like NBC and Telemundo, Universal Pictures, and themeparks like Universal Studios.Robert W. Baird & Co.5
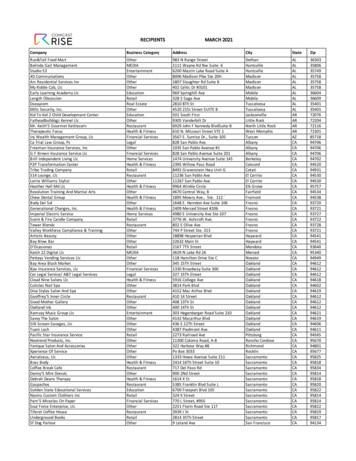
BAIRD 777 EAST WISCONSIN AVENUE MILWAUKEE, WI 53202William V. Power, CFA (214) 361-1129 wpower@rwbaird.comComcast CorporationIncome Statement( 000, Except per-share amounts)Year2014Act.RevenueCableNBC UniversalTotal RevenueYOY GrowthCableNBC UniversalTotal %6.7%24.8%13.9%ExpensesCableNBC UniversalDepreciationAmortizationTotal Operating 52,000Adjusted EBITDAAdjusted EBITDA 033.9%6,604,95234.3%6,929,10532.6%GAAP Operating IncomeOperating 021.8%4,284,95222.3%Interest ExpenseInvestment 000(703,000)30,000(764,968)39,731GAAP Income Before TaxesIncome Tax 971,0008,163,0002,134,0002,124,322 2.94 3.20 0.79 0.81 0.84 0.84 0.80 0.80 0.81 0.79 3.25 3.24 0.87 ,517,5002,462,000GAAP Net IncomeDiluted Adjusted EPSDiluted GAAP EPSDiluted Shares 2,309,9602,256,4938,824,7748,881,122 0.87 0.87 0.96 0.96 0.94 0.94 3.64 3.64 3.81 lease refer to Appendix - Important Disclosures and Analyst CertificationSource: Robert W. Baird & Co. Estimates, Company DataRobert W. Baird & Co.6
BAIRD 777 EAST WISCONSIN AVENUE MILWAUKEE, WI 53202William V. Power, CFA (214) 361-1129 wpower@rwbaird.comComcast CorporationCable Metrics( 000, Except subscriber and ARPU 0%25.69-3.0%25.49-3.0%25.73-3.2%24.96-3.0%Video RevenueGrowth 798,3922.2%Broadband RevenueGrowth %14,253,3475.5%Voice RevenueGrowth 7%Business Services RevenueGrowth 17.5%6,520,89017.0%Advertising RevenueGrowth 0%Other RevenueGrowth l Cable RevenueGrowth 86.5%52,234,8264.6%Cable EBITDAEBITDA 1,950,0002,150,0007,501,0007,951,060Act.Video CustomersBeginning SubscribersNet AdditionsEnding SubscribersGrowth %Penetration of Homes Passed %Video ARPUGrowth %Broadband CustomersBeginning SubscribersNet AdditionsEnding SubscribersGrowth %Penetration of Homes Passed %Broadband ARPUGrowth %Voice CustomersBeginning SubscribersNet AdditionsEnding SubscribersGrowth %Penetration of Homes Passed %Voice ARPUGrowth %Cable Capital ExpendituresPlease refer to Appendix - Important Disclosures and Analyst CertificationRobert W. Baird & Co.Year2015Act.Year2016Year2017Est.Est.Source: Robert W. Baird & Co. Estimates, Company Data7
BAIRD 777 EAST WISCONSIN AVENUE MILWAUKEE, WI 53202William V. Power, CFA (214) 361-1129 wpower@rwbaird.comComcast CorporationNBCUniversal Metrics( 000, Except per-share amounts)Year2014Q12015(03/31)Act.Act.Cable Networks RevenueGrowth %Broadcast TV RevenueGrowth %Film RevenueGrowth %Theme Parks RevenueGrowth %NBC Universal RevenueGrowth %Cable Networks EBITDAEBITDA MarginGrowth %Broadcast TV EBITDAEBITDA MarginGrowth %Film 682108,329764,054920,504EBITDA 7.0%12.1%13.5%Growth -24.2%-38.1%20.5%Theme Park ITDA %46.5%45.2%45.8%Growth %42.9%8.9%NBC Universal 2,7007,276,412EBITDA %21.9%23.2%23.6%Growth .2%2.0%NBCU Capital Expenditures1,221,000268,000Please refer to Appendix - Important Disclosures and Analyst CertificationRobert W. Baird & ,900612,7001,524,8001,562,920Source: Robert W. Baird & Co. Estimates, Company Data8
BAIRD 777 EAST WISCONSIN AVENUE MILWAUKEE, WI 53202William V. Power, CFA (214) 361-1129Comcast CorporationBalance Sheet & Cash Flow ProjectionsY 2014AQ1 2015AQ2 2015AQ3 2015AQ4 2015ABalance SheetCash & ST InvestmentsAccounts ReceivableOther Current AssetsPP&E, netFranchise RightsLT Marketable SecuritiesOther AssetsTotal 0003,135,00052,356,000159,339,0004,095,0006,144,0
Comcast’s NBCU acquisition provides revenue diversification and a solid growth profile. We also view NBCU as somewhat of a hedge against over-the-top, mobile, and other “off channel” video consumption. Business services small, but adds to growth profile. Th