Transcription
Chapter 8Managing a Virtualization ProjectIn this chapter, we use the example of a large corporation that has decided to accelerate thepenetration rate of virtualization within its information system. This company is alreadyfamiliar with virtualization technology. Approximately 30% of its server environment hasalready been virtualized. It wants to move on to the second phase and virtualize on a largescale, including its servers that run critical applications. To ensure the project’s success, aproject team is set up.ContextThe IT system at this corporation consists of global servers with a high obsolescence ratefor both hardware and software. With 362 servers (on x86 systems) spread out betweentwo datacenters, more than 50% are older than four years and will reach the end of themanufacturer’s support period at the end of the current year. The cost to replace theservers cannot be covered by IT budget allocations, which shrink every year. Certainarchaic applications (10 years and older) are still used but for compatibility reasons cannotbe migrated with the current hardware and operating systems. The company doesn’t evenhave the documentation needed to reinstall some of these applications.The IT department is under pressure. It must answer both to internal clients with newneeds (40 new requests per year) and to corporate management, who demand higherservice levels coupled with cost reductions. In a tight economic context, internal IT teamsbear a significant workload because many agreements with service providers have not beenrenewed.
258Chapter 8Managing a Virtualization ProjectThe datacenters are another source of great concern—they are reaching their limits interms of floor space and energy consumption (only a few kilowatt in reserve). No newhardware can be added, which prevents any new project from being undertaken.A disaster recovery plan (DRP) solution is in place, but it is not satisfactory; only 5% of theapplications are secured on remote sites, and tests are sporadically performed.Backups are also problematic; several solutions are in place, but there is no globalmanagement, and backup windows are often too narrow. Many restorations from tapes faildue to a lack of backup testing.The company decides to rely heavily on the virtualization technologies best suited to facethese issues. It decides to proceed with a large-scale deployment of virtualization for allapplications, even the most critical.ObjectivesThe IT department defines its objectives as follows:nnnCost reduction:nReduction in the datacenter’s power consumptionnInfrastructure rationalizationnAutomation of certain tasks performed by administratorsSecuring the production site by implementing a DRP with a recovery point objective(RPO) of 0 and an recovery time objective (RTO) of less than four hours on the entireIT system.The IT system must be the company’s growth engine. It must favor innovation,creativity, and new projects.The IT department also identifies the following future projects that are outside the scopeof the immediate objectives:nProvisioning cloud-type servicesnProviding end users and project teams with easy access to IT servicesnImplementing chargeback toolsnImplementing a unified backup solutionnImplementing a third replication sitenStandardizing processes
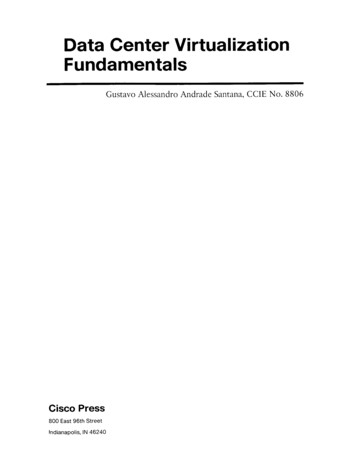
Project Stages259Criteria to Choose a SolutionTo evaluate the relevance of existing virtualization solutions in reaching its goals, thecompany looks at offerings from three top companies: Microsoft, Citrix, and VMware.After an in-depth examination of the different solutions, the company chooses VMwarebased on the following criteria:nThe product’s maturity within large datacentersnThe upgradeable nature of the solutionnnnThe possibility of attaining high levels of service through VMware’s advancedfeaturesA single tool to administer and monitor the virtual platform and DRP; integration ofSite Recovery Manager within vCenterA robust ecosystem, with numerous options (including migration tools, wide compatibility with backup tools, and reporting)nThe ability to implement a global backup policynPreexisting in-house VMware competenciesProject StagesAs shown in Figure 8.1, this virtualization project is planned in four stages: Planning,Design, Implementation, and Management.PlanningDiscoveryand analysisDesignDesign pilotand testImplementationSetup nFigure 8.1 Planning stages for virtualization project.For any virtualization project, including critical production servers, the goal of theplanning stage is a preliminary eligibility study. The planning stage includes two steps:1.Discovery, which involves collecting all information on servers, storage, andproduction equipment to draft a production plan.2.Analysis, which involves interpreting results from the discovery step and draftingoptimized consolidation scenarios.
260Chapter 8Managing a Virtualization ProjectThe Design stage involves proposing various target scenarios, taking into account the results ofthe eligibility study, and providing the technical specifications and performance metrics requiredfor the target platform. This guarantees a level of performance at least equivalent to what it wasbefore virtualization. (In fact, it is often much higher.) During this stage, the detailed referencearchitecture is drafted. This document serves in the drafting of the equipment specifications sothat the various providers offer solutions that meet the needs as defined.The Implementation stage defines the time phasing of migration for priorities defined bythe IT department, such as end-of-server warranty contracts, urgency, or capacity. If theproject’s priority is to decrease energy consumption (kWh), groups of the most energyintensive applications will be defined and migrated first. The implementation of the targetplatform will be accomplished by using physical-to-virtual (P2V) tools and in compliancewith the detailed reference architecture.The Management stage allows the application of best practices to add operationalefficiency to the environment. Strict rules must be followed to maintain control. Toolscomplementing those offered by VMware can be used to manage day-to-day operations.PlanningAs mentioned in the preceding section, the Planning stage consists of discovery and analysis(see Figure 8.2).PlanningDiscoveryand analysisDesignDesign pilotand testImplementationSetup nFigure 8.2 At the Planning stage.DiscoveryThis stage includes the production plan—the exact inventory of the servers and preciseinformation about the use of the various elements over a defined period. Informationcollected is used to size the target architecture and determine which servers are not eligiblefor the virtualization project. Information collected is also used for the proper implementation of Site Recovery Manager (SRM).The project’s scope includes x86 processor-based servers. Other types of servers, such asUNIX or mainframe, are excluded.
Planning261The study to gather information is realized through a collection server. The infrastructure’s physical servers send back all data related to production over a period that is representative of the activity. Usually, a period of 30 days is selected, excluding July and August(months that often are not representative of a typical production plan due to a slowingof business activity). The analysis tool chosen for this particular project is PlateSpinPowerRecon. The analysis stage can begin at the end of the 30-day period, covering thefollowing technical angles listed in Table 8.1.Table 8.1 Planning Objectives During Discovery PhaseAudit ThemeGoalsNotesOS typeVerify the compatibility of the OSwith VMware vSphere 5’s compatibility matrix.Unsupported operating systems are not eligible,because this means there will usually be no toolsallowing P2V or manufacturer support for the OS.CPU use rateAllows the determination of theaverage use rate of the currentserver park’s calculation power.Useful for the sizing of the targetarchitecture.Servers with intensive CPU use are not usuallygood candidates for virtualization, but if the goalis to simplify the DRP, even a processor-intensiveserver may be put on vSphere (1 VM for one ESXihost).CPU usagepatternAllows figuring whether the CPUactivity can be predictable (forspecific hours of days of theweek) or whether it is random.Allows the determination of which servers are “atrisk.” One determining factor to validate a physical machine’s virtualization eligibility.Memory usedeterminationAllows the determination of thememory’s average use rate.Memory is one of the first elements to take intoaccount when sizing a virtual architecture.Storagevolume sizingDefines required storage capacities and performance.The choice of the destination storage architectureis extremely important. Storage is the most criticalcomponent of a virtualization environment, becauseif storage-space and performance (in IOPS) sizingis not defined correctly, the project could fail.NetworkconnectionsDefines prerequisites to ensurenetwork streams in optimumconditions.The nature of servers (supported applications)and the report scheduling (batch, backups)should be analyzed in detail to determine network activity.Profiling theapplicationAllows the determination of thecriticality and performance ofeach application. The switch tovirtual should be done only whenservice levels and performanceare at least equivalent.Special attention should be given to critical applications for their protection and during migrationphases.
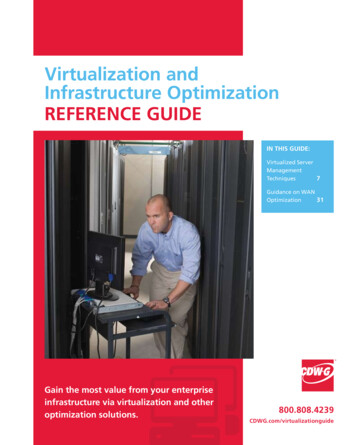
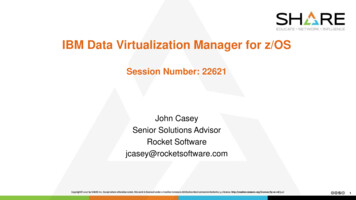
262Chapter 8Managing a Virtualization ProjectNoteDuring this period, it is imperative that the data collection operations and the team incharge do not interfere with current production, respecting the company’s business reality.Data collection follows a logical process. The activity of CPU, memory, network, and diskcomponents is collected at all times. Every five minutes, a maximum value is retrieved.After one hour, an average is generated from these maximum values. Each hour is calculated in this manner to establish a profile over 24 hours. In this way, the average valueover one month is found for each server. Each server’s profile can be calculated, and agraphic representation can be created, as shown in Figure 8.3, showing the activity from allmachines. The collection allows the precise determination of the servers’ activity and theirproduction plan.Figure 8.3 Representation of the datacenter’s production plan.In Figure 8.3, each color stacked in the histogram represents the activity of one machinewithin the datacenter. The collected activity accumulation represents the maximum loadobserved that the virtualized platform will need to offer when it is in place to ensure, ata minimum, a performance equivalent to pre-virtualization. Note that a large portion ofactivity occurs at night: backups, batches, database indexing, defragmentation, and so on.On some servers, the busiest time is at night.As shown in Table 8.2, limit thresholds must be set to determine which servers are eligiblefor virtualization. These thresholds are based on VMware recommendations as well as ourown experience. Every organization may set the limit thresholds differently.
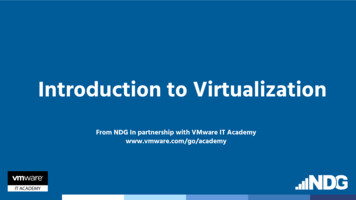
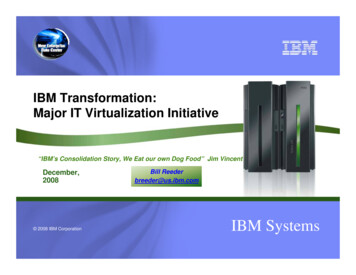
Planning263Table 8.2 Limit ThresholdsSet ThresholdsCPU6 GHzMemory6 GBDiskNetworkDisk transfer 1700 IOPSBandwidth 20 MBps20 MBpsServers above these thresholds will be isolated and not eligible for this virtualization project.Operating SystemsAs shown in Table 8.3, the collection provides a precise description of the servers.Table 8.3 Distribution of Existing Physical and Virtual ServersTotal Numberof x86 ServersNumber ofPhysicalServersNumberof VMsNumber of ServersConnected to theSANNumber of VMsReplicated onthe SAN3622421205035362 physical and virtual servers are included in the scope of this project. Approximately30% of the servers have already been virtualized using vSphere 4.1. The majority ofservers use internal storage, although some use storage-area network (SAN) Fibre Channel(FC) shared storage (50 servers). Only 35 servers are secured on a remote site. The goalfor this project is to virtualize the physical servers and to reuse the VMs that already exist.Figure 8.4 shows the operating system environment.Windows is used in 95% of the environment (four different versions of Windows).The vast majority use Windows 2003, but a trend toward Windows 2008 Server can beobserved.NoteAll operating systems are found in VMware’s hardware compatibility matrix.CPU Data CollectionOf the physical servers, 50% are uniprocessor servers and 44% are biprocessor servers.Only 6% use quad processors.
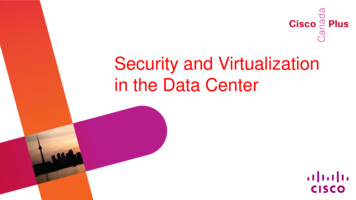
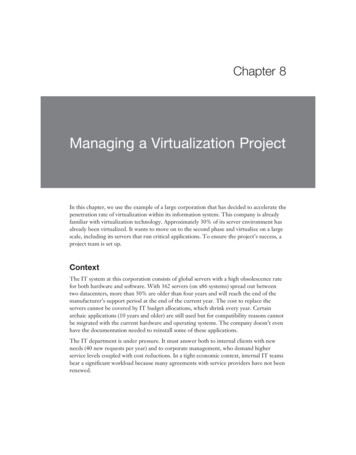
264Managing a Virtualization ProjectChapter 8362 VMs / iseververrprreeSSntedo003008at EWins2s2dHdowRedownniiWWerv0S2002ws003ServerFigure 8.4 Operating systems in use.NoteExperience shows that the more sockets a server has, the more difficult it will be to virtualizebecause of the presence of an application requiring significant resources.An in-depth view (see Figure 8.5) of the servers’ CPU use shows the activity.CPU Use Distribution40%35%30%% Servers34%30%Threshold 6 GHz25%20%4%15 4-Hz5G5-Hz6G6-Processor Frequency Used in GHzFigure 8.5 Server CPU activity.3%1%Hz7G 7zGH
Planning265As you can see in Figure 8.5, the majority (87%) of servers make reasonable use of theCPU (less than 4 GHz). There are 47 servers (13%) with high CPU activity (more than4 GHz). 4 percent (15 servers) use the CPU above the threshold set at 6 GHz.NoteThese figures are global averages and do not rule out excessive use on a particular server.The average is calculated over periods representative of the activity.Memory Data CollectionWhen the memory installed in all servers is added up, you can see that 64% of all memoryis used; 36% is free (see Figure 8.6).% Memory Used70%64%% Servers60%50%40%36%30%20%10%0%FreeUsedFigure 8.6 Total server memory usage.An in-depth view, displayed in Figure 8.7, shows how used memory is distributed.As Figure 8.7 shows, 90% of servers use a capacity equal to or less than 8 GB of RAM;these can be virtualized. Three percent use a significant amount of memory—more than8 GB. These 10 servers are mainly SQL and Oracle databases. They are above the setthreshold and will not be eligible for this project.Servers with a significant amount of memory used must be analyzed in more detail toconfirm whether they can be virtualized. In vSphere 5, licensing is partially linked to theconfigured memory of the VMs, so this must be taken into account when large memorycapacities are necessary.
266Managing a Virtualization ProjectChapter 8Used Memory Distribution40%35%35%% Servers30%Threshold 8 GB25%25%20%20%3%10 BG-5BG5GB-62%BG6BG-72%BG7GB-82%GB8BG-91%BG 9GBMemory Size in GBFigure 8.7 Detailed presentation of used memory distribution.NoteA server with significant memory usage should not be excluded in all cases. Indeed, if themain goal is to set up a DRP simply, it can be interesting to keep such a server within thescope of the project.DiskThere are 312 servers using local storage, and 50 are connected to the SAN. The totalstorage capacity (local and SAN) of the 362 servers is 25 TB, including 15 TB used, or55%. This makes an average capacity per server of 40 GB used for 70 GB provisioned.Implementing an architecture with centralized storage will allow consolidation andimprove the use rate of the storage.NoteThis information serves as a base to size storage. The size needed is one of the indicatorsused to choose the correct type of disk to use: vmdk, RDMp, or RDMv.The graph shown in Figure 8.8 illustrates the number of servers per disk capacity used.
Planning267Use Capacity in GB/server 500 GB1%4%100 - 500 GB9%50 - 100 GB27%20 - 50 GB35%10 - 20 GB24% 10 GB0%10%20%30%40%Number of ServersFigure 8.8 Number of servers per disk capacity.Eighty-six percent of servers use a reasonable capacity, below 100 GB of disk, and thesecan be virtualized. Fourteen percent have significant volumes, including two above 1 TB.Large-volume servers require an in-depth study.NoteUsing Raw Device Mapping (RDM) mode disks is appropriate for large volumes.Bandwidth is an important aspect of eligibility. Generally, a good candidate for virtualization requires an I/O disk bandwidth below 20 MBps. Fortunately, as shown in Figure8.9, most servers fall below that limit.Disk Bandwidth Distribution30%25%% Servers25%21%20%21%15%Threshold 20 1BpM180-22%1%MsBp 20sBpMBandwidth in MBpsFigure 8.9 Two percent of servers (seven servers) require more bandwidth than 20 MBps.
268Managing a Virtualization ProjectChapter 8An in-depth study is needed to identify values and periods. I/O activity, shown in Figure8.10, is a critical element to monitor when servers hosting virtual machines share disks.IO/sec Disk Distribution70%58%% Servers60%50%Threshold 1,700 5-1Disk I/O1%PSIO0015-1750PSIO05173%1%-2000PSIO 2000ec/sIOFigure 8.10 IOPS activity.As you can see in Figure 8.10, the servers’ overall IOPS activity is reasonable. Fifteenservers have significant activity, greater than 1700 IOPS, and require in-depth study.The peaks primarily take place at night. Activity is not necessarily a hindrance in transitioning to the virtual, but it comes at a price. Indeed, for the VM to offer the performancerequired, it must have its own dedicated RDM disks with a sufficient quantity of diskspindles to absorb the load.If it is part of the target, dedicating portions of SAN for this VM is recommended. Whatwould prevent virtualization would be caused by financial concerns, not technologicalreasons.NetworkAs shown in Figure 8.11, 264 servers are using bandwidth of less than 20 MB/s. 10 serversuse bandwidth greater than 20 MBps. Among these are servers for backups, antivirussoftware, and scanning applications. In a virtualized environment, 20 MBps is the limitfor a machine’s network traffic. A Gigabit Ethernet adapter usually does not provide morethan 70 MBps.The peaks primarily take place at night and correspond to backup periods. A discussioninvolving the client must take place regarding backup issues of the target infrastructure.The network activity can be offloaded if a SAN architecture is set up.
Planning269Network Bandwidth Distribution70%62%% Servers60%50%Threshold 20 1%1%3%ssssBpBpBpBpMMM08M0212 1618Network Bandwidth in MB/secFigure 8.11 Network activity and bandwidth demands.ApplicationsThe collection provides a precise description of the application environment:nSQL Server: 124 servers host SQL.nOracle Server: 50 servers.nApproximately 100 existing VMs for tests, development, preproduction, and so on.nThe rest are related to infrastructure servers: Active Directory (AD), Domain NameSystem (DNS), web, files, printing, BlackBerry, business applications, and so on.SQL Server: We have found 124 servers/VMs that host SQL. Certain servers have asignificant queue length between 5 a.m. and 7 p.m. Performance issues can occur forservers with a queue length beyond 12. If they are retained for virtualization, it will benecessary to increase the number of disk spindles in building these servers’ logical unitnumber (LUN)—one disk from the RAID group for every queue length unit above 12. Thisincrease is important, or the contention of target disks could be displaced major concern,which would deteriorate the performance of other VMs.Oracle Server: 50 servers run Oracle databases. The number of licenses required must bechecked directly with Oracle. Some se
Project Stages As shown in Figure 8.1, this virtualization project is planned in four stages: Planning, Design, Implementation, and Management. Setup and migration Design pilot and test Discovery and analysis Planning Design Implementation Management Administration and optimization Figure 8.1 Pla