Transcription
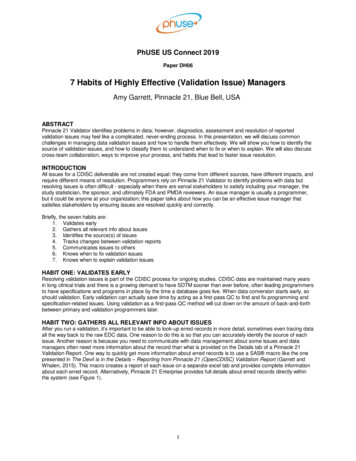
M10 CHRI5988 07 SE C10.QXD12/18/074:21 AMPage 276Palm–oak forest hammock (“shady place”), featuring a mixed hardwood forest. There are bromeliads(epiphytes) growing on the live oak trees and a few on the cabbage, or sabal, palms. This palm is Florida’sstate tree. A hammock is slightly higher ground, surrounded by wet prairies, mixed swamp, and cypressforest marshes. Such “islands” of vegetation result from having few fires, protected as they are by surroundingmarshes. These two photos are in Myakka River State Park, Sarasota County, about 15 miles inland from thecentral Gulf Coast. [Overhead and forest-floor photos by Bobbé Christopherson.]276
M10 CHRI5988 07 SE C10.QXD12/18/074:21 AMPage 277CHAPTER10Global ClimateSystems䊏Key Learning ConceptsAfter reading the chapter, you should be able to:䊏 Define climate and climatology, and explain the difference betweenclimate and weather.䊏 Review the role of temperature, precipitation, air pressure, and airmass patterns used to establish climatic regions.䊏 Review the development of climate classification systems, andcompare genetic and empirical systems as ways of classifyingclimate.䊏 Describe the principal climate classification categories other thandeserts, and locate these regions on a world map.䊏 Explain the precipitation and moisture efficiency criteria used todetermine the arid and semiarid climates, and locate them on aworld map.䊏 Outline future climate patterns from forecasts presented, andexplain the causes and potential consequences of climate change.Earth experiences an almost infinite variety of weather—conditionsof the atmosphere—at any given time and place. But if we considerthe weather over many years, including its variability and ex-tremes, a pattern emerges that constitutes climate. Think of climatic patterns as dynamic rather than static, owing to the fact that we are witnessingclimate change. Climate is more than a consideration of simple averages oftemperature and precipitation.277
M10 CHRI5988 07 SE C10.QXD278Part II12/15/071:14 AMPage 278The Water, Weather, and Climate SystemsToday, climatologists know that intriguing globalscale linkages exist in the Earth–atmosphere–ocean system. For instance, strong monsoonal rains in West Africaare correlated with the development of intense Atlantichurricanes; or, one year an El Niño in the Pacific is tied torains in the American West, floods in Louisiana andNorthern Europe, and a weak Atlantic hurricane season.Yet, the persistent La Niña in 2007 strengtheneddrought’s six-year hold on the West. The El Niño/LaNiña phenomenon is the subject of Focus Study 10.1.Climatologists, among other scientists, are analyzingglobal climate change—record-breaking global averagetemperatures, glacial ice melt, drying soil-moisture conditions, changing crop yields, spreading of infectiousdisease, changing distributions of plants and animals, declining coral reef health and fisheries, and the thawing ofhigh-latitude lands and seas. Climatologists are concernedabout observed changes occurring in the global climate,as these are at a pace not evidenced in the records ofthe past millennia. Climate and natural vegetation shiftsduring the next 50 years could exceed the total of allchanges since the peak of the last ice-age episode, some18,000 years ago. In Chapter 1, Geosystems began withthese words from scientist Jack Williams,By the end of the 21st century, large portions of theEarth’s surface may experience climates not found at present, and some 20th-century climates may disappear. . . .Novel climates are projected to develop primarily in thetropics and subtropics. . . . Disappearing climatesincrease the likelihood of species extinctions and community disruption for species endemic to particular climatic regimes, with the largest impacts projected forpoleward and tropical montane regions.*We need to realize that the climate map and climate designations we study in this chapter are not fixed but are on themove as temperature and precipitation relationships alter.In this chapter: Climates are so diverse that no twoplaces on Earth’s surface experience exactly the sameclimatic conditions; in fact, Earth is a vast collection ofmicroclimates. However, broad similarities among localclimates permit their grouping into climatic regions.Many of the physical elements of the environment,studied in the first nine chapters of this text, link togetherto explain climates. Here we survey the patterns of climateusing a series of sample cities and towns. Geosystems usesa simplified classification system based on physical factorsthat help uncover the “why” question—why climates arein certain locations. Though imperfect, this method iseasily understood and is based on a widely used classification system devised by climatologist Wladimir Köppen(pronounced KUR-pen). For reference, Appendix Bdetails the Köppen climate classification system and allits criteria.*Jack Williams et al., “Projected distributions of novel and disappearingclimates by A.D. 2100,” Proceedings of the National Academy of Sciences(April 3, 2007): 5739.Climatologists use powerful computer models tosimulate changing complex interactions in the atmosphere, hydrosphere, lithosphere, and biosphere. Thischapter concludes with a discussion of climate change andits vital implications for society. Climate patterns arechanging at an unprecedented rate. Especially significantare changes occurring in the polar regions of the Arcticand Antarctic.Earth’s Climate Systemand Its ClassificationClimatology, the study of climate and its variability, analyzes long-term weather patterns over time and space andthe controls that produce Earth’s diverse climatic conditions. One type of climatic analysis locates areas of similarweather statistics and groups them into climatic regions.Observed patterns grouped into regions are at the core ofclimate classification.The climate where you live may be humid with distinct seasons, or dry with consistent warmth, or moist andcool—almost any combination is possible. There areplaces where it rains more than 20 cm (8 in.) each month,with monthly average temperatures remaining above27 C (80 F) year-round. Other places may be rainless fora decade at a time. A climate may have temperatures thataverage above freezing every month yet still threatensevere frost problems for agriculture. Students readingGeosystems in Singapore experience precipitation everymonth, ranging from 13.1 to 30.6 cm (5.1 to 12.0 in.), or228.1 cm (89.8 in.) during an average year, whereas students at the university in Karachi, Pakistan, measure only20.4 cm (8 in.) of rain over an entire year.Climates greatly influence ecosystems, the natural, selfregulating communities formed by plants and animals intheir nonliving environment. On land, the basic climaticregions determine to a large extent the location of theworld’s major ecosystems. These regions, called biomes,include forest, grassland, savanna, tundra, and desert.Plant, soil, and animal communities are associated withthese biomes. Because climate cycles through periodicchange, it is never really stable; therefore, ecosystemsshould be thought of as being in a constant state of adaptation and response.The present global climatic warming trend is producing changes in plant and animal distributions. Figure 10.1presents a schematic view of Earth’s climate system, showing both internal and external processes and linkages thatinfluence climate and thus regulate such changes.Climate Components: Insolation,Temperature, Pressure, Air Masses,and PrecipitationThe principal elements of climate are insolation, temperature, pressure, air masses, and precipitation. The firstnine chapters discussed each of these elements. We reviewthem briefly here. Insolation is the energy input for the
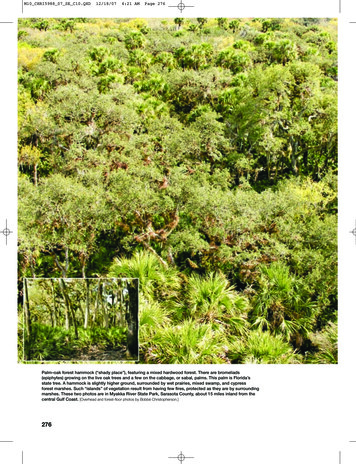
M10 CHRI5988 07 SE C10.QXD12/15/071:15 AMPage 279Chapter 10Global Climate sATMOSPHERECompositionN2, O2, CO2, H2O, O3,aerosolsAtmosphereCRYOSPHEREIce SPHEREWind effectsSea iceHYDROSPHEREInternalprocessesIceLandOceanChanges in the land:elevation, vegetation,albedoChanges inatmosphericcompositionLITHOSPHEREOceanChanges in the oceanbasin shape, salinity,sea temperatureExternalprocessesFIGURE 10.1 A schematic of Earth’s climate system.Imagine you are hired to write a computer program that simulates Earth’s climates. Internal processes that influence climateinvolve the atmosphere, hydrosphere (streams and oceans), cryosphere (polar ice masses and glaciers), biosphere, andlithosphere (land)—all energized by insolation. External processes, principally from human activity, affect this climatic balanceand force climate change. [After J. Houghton, The Global Climate (Cambridge, UK: Cambridge University Press, 1984); and the GlobalAtmospheric Research Program.]climate system, but it varies widely over Earth’s surface bylatitude (see Chapter 2 and Figures 2.9, 2.10, and 2.11).Daylength and temperature patterns vary diurnally (daily)and seasonally. The principal controls of temperature arelatitude, altitude, land-water heating differences, andcloud cover. The pattern of world temperatures and theirannual ranges are in Chapter 5 (see Figures 5.14, 5.15,5.17, and 5.18).Temperature variations result from a coupling ofdynamic forces in the atmosphere to Earth’s pattern ofatmospheric pressure and resulting global wind systems(see Figures 6.10 and 6.12). Important, too, are the location and physical characteristics of air masses, those vastbodies of homogeneous air that form over oceanic andcontinental source regions.Moisture is the remaining input to climate. Thehydrologic cycle transfers moisture, with its tremendouslatent heat energy, through Earth’s climate system (seeFigure 9.1). The moisture input to climate is precipitationin all its forms. Figure 10.2 shows the worldwide distribution of precipitation, our moisture supply. Its patterns areimportant, for it is a key climate control factor. Averagetemperatures and daylength help us approximate POTET(potential evapotranspiration), a measure of naturalmoisture demand.Most of Earth’s desert regions, areas of permanentwater deficit, are in lands dominated by subtropical highpressure cells, with bordering lands grading to grasslandsand to forests as precipitation increases. The most consistently wet climates on Earth straddle the equator in theAmazon region of South America, the Congo region ofAfrica, and Indonesia and Southeast Asia, all of which areinfluenced by equatorial low pressure and the intertropical convergence zone (ITCZ, see Figure 6.11).Simply relating the two principal climatic components—temperature and precipitation—reveals general climatetypes (Figure 10.3). Temperature and precipitation patterns, plus other weather factors, provide the key to climateclassification.Classification of Climatic RegionsThe ancient Greeks simplified their view of world climatesinto three zones: The “torrid zone” referred to warmerareas south of the Mediterranean; the “frigid zone” was tothe north; and the area where they lived was labeled the“temperate zone,” which they considered the optimum climate. They believed that travel too close to the equator ortoo far north would surely end in death. But the world is adiverse place and Earth’s myriad climatic variations aremore complex than these simple views.
M10 CHRI5988 07 SE C10.QXD280Part II12/15/071:15 AMPage 280The Water, Weather, and Climate Systems80 ARCTIC OCEANARCTIC OCEAN70 Arctic Circle60 60 50 50 50 50 PACIFIC40 40 ATLANTICOCEAN30 40 40 OCEAN30 30 30 Tropic of Cancer20 20 160 100 10 50 0 90 cm20 200 andover150–199100–14940 70 80 INDIAN10 10 in.10 20 140 90 150 30 OCEAN10 120 80 and20 over20 20 20 30 30 30 40 40 50 50 30 40–5920–39 40 25–4910–19150 160 170 CORAL SEA20 20 Tropic of Capricorn60–7950–9940 Under50 2560 EquatorEquator10 50 BAY OFBENGAL10 OCEAN140 130 120 110 30 20 ARABIANSEAPACIFIC10 0 Tropic of Cancer30 30 40 40 110 120 130 140 150 160 Under 1050 50 001,0002,000180 3,000 MILES1,000 2,000 3,000 KILOMETERSMODIFIED GOODE'S HOMOLOSINE EQUAL-AREA PROJECTIONFIGURE 10.2 Worldwide average annual precipitation.The causes that produce these patterns should be recognizable to you: temperature and pressure patterns; air mass types;convergent, convectional, orographic, and frontal lifting mechanisms; and the general energy availability that decreases towardthe poles.Global Patterns ofPrecipitationColdColdPolar ice sheetHighland climatesat elevationTundraTaiga – cool summerColddesertCold steppeMidlatitudesemiaridMidlatitude and steppearidhotHot d continental, mild summerHumid continental, warm-hot summerFIGURE 10.3 Climatic relationships.Mediterranean,dry summer subtropicsHumid subtropicsSeasonal wet-and-dry Monsoon Equatorial tropics –tropics – SavannatropicsRain forestIncreasing precipitationClassification is the process of grouping data or phenomena in related categories. Such generalizations areimportant tools in science and are especially useful for thespatial analysis of climatic regions. Just as there is noagreed-upon climate classification system, neither is therea single set of empirical (statistical) or genetic (causal) criteria on which everyone agrees. Any classification systemshould be viewed as developmental, because it is alwaysopen to change and improvement.A climate classification based on causative factors—forexample, the interaction of air masses—is a genetic classification. A climate classification determined by statisticalWetHotA temperature and precipitationschematic reveals climatic relationships.Based on general knowledge of yourcollege location, can you identify itsapproximate location on the schematicdiagram? Now locate the region of yourbirthplace.data of observed effects is an empirical classification.Climate classifications based on temperature and precipitation data are examples of empirical classifications.Genetic classifications explain climates in terms of netradiation, thermal regimes, or air mass dominance over aregion. This chapter uses a system that draws on both agenetic and an empirical approach, which allows description of the climatic regions and also provides informationas to why such climates are found where they occur.One empirical classification system, publishedby C. W. Thornthwaite in 1948, identified moistureregions using the water-budget approach (Chapter 9) and(text continued on page 283)
M10 CHRI5988 07 SE C10.QXD12/15/071:15 AMPage 281Chapter 10Global Climate Systems281Focus Study 10.1The El Niño Phenomenon—Global LinkagesClimate is the consistent behavior ofweather over time, but average weatherconditions also include extremes thatdepart from normal. The El Niño–Southern Oscillation (ENSO) in thePacific Ocean forces the greatest interannual variability of temperatureand precipitation on a global scale.The two strongest ENSO events in120 years hit in 1997–1998 and1982–1983. The spring wildflowerbloom in Death Valley in 1998 provides visible evidence of the resultantheavy rains (Figure 10.1.1). Peruvianscoined the name El Niño (“the boychild”) because these episodes seem tooccur around the traditional December celebration time of Christ’s birth.Actually, El Niños can occur as earlyas spring and summer and persistthrough the year.Revisit Figure 6.21 and see thatthe northward-flowing Peru currentdominates the region off SouthAmerica’s west coast. These coldwaters move toward the equator andjoin the westward movement of thesouth equatorial current.The Peru current is part of thenormal counterclockwise circulation ofwinds and surface ocean currentsaround the subtropical high-pressurecell dominating the eastern Pacific inthe Southern Hemisphere. As a result,a location such as Guayaquil, Ecuador,normally receives 91.4 cm (36 in.) ofprecipitation each year under dominanthigh pressure, whereas islands in theIndonesian archipelago receive morethan 254 cm (100 in.) under dominantlow pressure. This normal alignment ofpressure is shown in Figure 10.1.2a.What Is ENSO?Occasionally, for unexplained reasons,pressure patterns and surface oceantemperatures shift from their usuallocations. Higher pressure than normal develops over the western Pacificand lower pressure develops over theeastern Pacific. Trade winds normallymoving from east to west weaken andcan be reduced or even replaced byan eastward (west-to-east) flow. Theshifting of atmospheric pressure andwind patterns across the Pacific isthe Southern Oscillation. Chapter 6 discussed the Pacific Decadal Oscillation(PDO) and its interrelation withENSO.Sea-surface temperatures increase, sometimes more than 8 C (14 F ) above normal in the central(a) 1998and eastern Pacific during an ENSO,replacing the normally cold, upwelling, nutrient-rich water alongPeru’s coastline. Such ocean-surfacewarming, the “warm pool,” mayextend to the International Date Line.This surface pool of warm wateris known as El Niño. Thus, the designation ENSO is derived—El Niño–Southern Oscillation. This conditionis shown in Figure 10.1.2b in illustration and satellite image.The thermocline (boundary ofcolder, deep-ocean water) lowers indepth in the eastern Pacific Ocean.The change in wind direction andwarmer surface water slows the normal upwelling currents that controlnutrient availability. This loss of nutrients affects the phytoplankton andfood chain, depriving many fish, marine mammals, and predator birds ofnourishment.Scientists at the National Oceanographic and Atmospheric Administration (NOAA) speculate thatENSO events occurred more than adozen times since the fourteenth century. More recently, there was anENSO in 1982–1983 (second-strongestevent), 1986–1987, 1991–1993 (oneof the longest), and the most intense(b) 2002FIGURE 10.1.1 El Niño’s impact on the desert.Death Valley, southeastern California, in (a) full spring bloom following record rains triggered by the1997–1998 El Niño and (b) the same scene in spring 2002 in its stark desert grandeur. A dramatic effectcaused by changes in the distant tropics of the Pacific Ocean. [Photos by Bobbé Christopherson.](continued)
M10 CHRI5988 07 SE C10.QXD282Part II12/15/071:15 AMPage 282The Water, Weather, and Climate SystemsFocus Study 10.1 (continued)SST*28 C(82.4 F)InternatioDate LinenalIndonesiaDarwin,Northern Territory40 cm0m150 W180 30 N o/ EI Nin aEI Nin15 NTrade windsEquatorTahiti, Society IslandsNormal sea levelSST 25 C (77 F)Upwelling0 0m50 mineThermoclAustraliaSouthAmerica200 m*SST Sea-surface temperature130 EIndonesia180 SST 28 C150 WInternationDate Line al(a)Trade windsDarwin30 N15 N0 15 cm0m50 mEquatorTahiti30 cm0mEl NiñoNovember 10, 1997New thermoclineUpwelling blocked bywarm surface watersAustralia200 mSouthAmerica(b)(c)La NiñaOctober 12, 1998(d)A persistent La NiñaMarch 11, 2000(e)June 7, 2001(f)July 12, 2004(g)February 22, 2005(h)August 26, 2007FIGURE 10.1.2 Normal, El Niño, and La Niña changes in the Pacific.(a) Normal patterns in the Pacific; (b) El Niño wind and weather patterns across the Pacific Ocean and TOPEX/Poseidonsatellite image for November 1997 (white and red colors indicate warmer surface water—a warm pool). (c) TOPEX/Poseidonimage of La Niña conditions in transition in the Pacific in October 1998 (purple and blue colors for cooler surface water—acool pool). (d) A persistent La Niña in a March 2000 satellite image. (e) Image from June 2001 showing no El Niño asequatorial waters slowly warm with sea-surface temperature near normal. (f) The warm pool of waters retreated westward,leaving neutral or a mild La Niña off South America, July 2004 image. (g) More neutral conditions February 22, 2005. (h) LaNiña growing in size, August 26, 2007. [(a) and (b) adapted and author corrected from C. S. Ramage, “El Niño.” 1986 by ScientificAmerican, Inc.; (b)–(e) TOPEX/Poseidon and (f, g, and h) Jason–1 images courtesy of Jet Propulsion Labora
These two photos are in Myakka River State Park, Sarasota County, about 15 miles inland from the . tion of precipitation, our moisture supply. Its patterns are important, for it is a key climate cont