Transcription
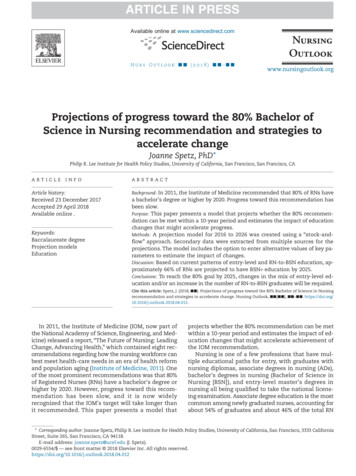
Research BriefRTI PressISSN 2378-7929May 2021Social Network Analysis Methods for International DevelopmentEric M. Johnson and Robert ChewKey Research Needs Incorporate social network analysis (SNA) into monitoring,evaluation, and learning processes. SNA can be conductedat various points of a project to inform program design,adaptive management, learning, and evaluation byconsidering network structure and network changes overtime. Demystify the use of SNA. Increased use of SNA tools andclear presentation in widely read publications are neededto bring the analytic approach into the mainstream ofinternational development. Build capacity to conduct SNA. The capacity to conductand interpret SNA is lacking across actors in internationaldevelopment. Efforts by some organizations to buildcapacity in the community are well noted and should bebuilt upon.At their core, international development programs attempt tocatalyze new relationships and new ways of working amongprogram stakeholders. For example, youth developmentprograms may seek to connect educators to private sectoremployers to make skills training more demand-driven,increasing youth employability. Others may seek to steer at-riskyouth toward positive role models and community services,and away from gangs, to improve their safety and resiliency.Reflecting this, an official at the United States Agency forInternational Development (USAID), the world’s largestbilateral international development donor, recently stated,“the design, implementation and evaluation of developmentprograms is intrinsically about people, institutions and therelationships between them.”1 Many development programs,however, lack a sophisticated understanding of theserelationships and a way to measure change in them. Social Build understanding of relationships between socialnetworks and development outcomes. SNA will be usefulonly to the extent it helps users understand the relationshipbetween networks and development outcomes that matter. Establish norms for data collection and identity protection.Data about individuals and their interactions with othersare inherently sensitive data. As a part of standard researchethics protocols, SNA practitioners must make carefullyconsidered decisions about how or if to anonymize datawhen reporting it.network analysis (SNA) is a quantitative research method thatprograms can use to help address this critical knowledge gap.This policy brief advances the case for SNA in internationaldevelopment, outlines general approaches, and reviews tworecently conducted case studies that illustrate its potential.Included is an agenda for future work and applications ininternational development.RTI Press Publication No. RB-0026-2105. Research Triangle Park, NC: RTI 6.2105
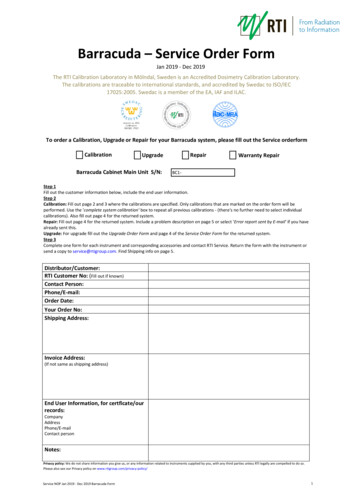
SNA for International DevelopmentSocial Network AnalysisThe position and partitioning of nodes in the network mapsvisualizes the network structure, including central actors,isolated actors, bridging actors, and any sub-groupings orcliques. See the Annex for more on the computing softwareneeded and approaches to network visualization.Social networks are “a set of players and patterns of exchangeof information and/or goods among these players.”2 Theintellectual home of network analysis is in sociology, whereDurkheim emphasized the study of social relationshippatterns, and Granovetter advanced the importance of “weakties” (distant acquaintances) in relational phenomena, such assuccessfully acquiring leads for job opportunities.3 Later, inpolitical science, Putnam explained waning social capital inUnited States by the breakdown of community networks, suchas bowling leagues and economic structures like labor unions.4Only recently, though, have researchers drawn on the methodsand empirical basis of SNA to elevate it to a mainstreamanalytic tool. The rapid growth in published papers and grantfunding over the past 15 years demonstrates this uptake.5SNA metrics are often grouped into two categories tocharacterize networks by their level of (1) network closureor cohesion, measured by levels of density, reciprocity,transitivity, degree centrality, and shortest path, and(2) network heterogeneity, measured by modularity.Networks with higher levels of closure are associated withhigher familiarity, trust, and social capital, and moreefficient exchange of information, goods, or services. Moreheterogeneous networks are considered more effective atmobilizing resources, given that network exchanges oftenrequire coordination of many skills and various inputs acrossdifferent types of actors.SNA is a quantitative analysis tool used to identify andunderstand relationships between people or, in other words,social networks. It visually displays data so researchers cansee behavioral relationships at the micro level (individual,institutional) and patterns at the macro or network level. SNAhas the flexibility to treat networks as both independent anddependent variables. For example, it can help answer howdifferences in individuals’ networks (independent variable)explain their risk for contracting COVID-196 or how raciallysegregated schools affect a young person’s friendship networks(dependent variable).7For SNA to be useful or effective, it should be methodologicallywell-aligned to answer clear research questions. Ininternational development, it presents a potentially useful toolfor understanding a range of network relationships, includinglevels of collaboration and exchange; the existence of centralactors; excluded populations; and absent connections amongindividuals, organizations, or groups. Two recent applicationsof SNA to international development used SNA to understandcollaboration among different types of actors that programshad been unable to assess adequately in the past.The data used in SNA can include secondary sources, such associal media data (connections, likes, shares, etc.); evidence ofcollaboration, such as co-authoring a paper; or administrativerecords such as school attendance, employment history, orclub membership. Surveys can also collect primary data forSNA, with respondents asked to answer questions about theirrelationships, exchanges, and affiliations. Surveys often askabout the level of respondents’ connection to the others (i.e.,frequency of communication); the nature of those exchanges(information, goods and services, collaboration); and the valuethe respondent assigns to them.El Salvador: Research and Development Clustersfor Innovation-Led Economic GrowthIn 2018, a team from RTI International and Duke Universityconducted SNA in El Salvador to assess network connectionsamong university, private sector, and governmentcollaborators in distinct economic sector clusters (energy,light manufacturing, information and communicationstechnology [ICT], and agroindustry and food processing).These clusters had been formed as a part of a 5-year USAIDprogram in El Salvador to advance economic growth throughimproved higher education performance. At the time in ElSalvador, university faculty generally lacked knowledge ofindustry trends, had few connections with employers, and,thus, were largely unaware of in-demand competenciesneeded for student employment. Further, faculty engaged inlittle research to develop applied solutions to the challengesof private industry. On the private sector side, Salvadoranemployers reported difficulty in finding new hires withappropriate technical and soft skills and had difficulty sourcinginnovation.8SNA data are typically analyzed and interpreted in two ways.First, a set of network metrics can characterize the networkand quantify its dimensions. Typical network measuresinclude density, reciprocity, transitivity, centralization, andmodularity. See Figure 1 for definitions and explanations ofthese metrics, among others. Second, researchers can alsoexplore and interpret social networks visually. Various softwaretools map the connections among network actors and producesocial network graphs or “sociograms.” In these graphs, colorsdemark different kinds of actors, or nodes on the graph.The sizes of the nodes indicate the levels of connectedness.RTI Press: Research Brief2RTI Press Publication No. RB-0026-2105. Research Triangle Park, NC: RTI 6.2105
SNA for International DevelopmentFigure 1. Common social network analysis measuresNetwork metricExplanationNetwork SizeNetwork size refers to the number of nodes in the network.In this example there are two nodes. They are differentcolors to represent people from different groups of interest,like gender. The size of the node is typically related to howmany connections it has.EdgesDensityReciprocityTransitivityShortest PathDegreeCentralizationModularityRTI Press: Research BriefBAEdges are connections among nodes. Edges can be directed,meaning we care if the connection goes both ways (i.e., isreciprocal), or undirected, where we only seek to understandif there is any connection between A and B.ACBCABTransitivity is the proportion of all possible triads connectedwithin a graph. Among the nodes A, B, C, D, there are fourpossible triads that can be formed. In this example, we seeone connected triad with solid lines, or 25% transitivity.Shortest path is the path that represents the shortestdistance between a given pair of nodes. To summarizehow isolated a node is, we can take the average of a node’sshortest paths to all other nodes in a network. For example,the average shortest path for A is 1.33 as it takes 1 edgeto get to nodes B and D and two edges (in red) to getto node C, an average distance of 1.33 edges.3BUndirectedAReciprocity is the fraction of all possible connections inwhich nodes are mutually connected. Using the sameexample as above, we see one reciprocal connection out ofthe three connected nodes, or 33%.Modularity is a measure of partitioning between groupsin a network. Scores above 0 indicate more within-groupties than between group ties. Lower scores indicate greatermixing across groups. Scores of 0 indicate a mixing expectedin a random graph.ADirectedDensity indicates how close a graph is to being fullyconnected. 0 no connections at all; 1 all possibleconnections among nodes are made. In this examplethe solid lines represent connections and the dottedlines potential connections that are not realized. In thisdirected network there are 6 possible connections, with4 connections made, or a density of 66%.Degree centralization is a measure of how much“influential” nodes impact network structure. 1 starshaped network with all connections flowing throughone node. 0 fully connected graph or a graph with noconnections, respectively seen in the second exampleshere.BABCDBACDBBACBADHigh Degree CentralityHigh ModularityCADCLow Degree CentralityLow ModularityRTI Press Publication No. RB-0026-2105. Research Triangle Park, NC: RTI 6.2105D
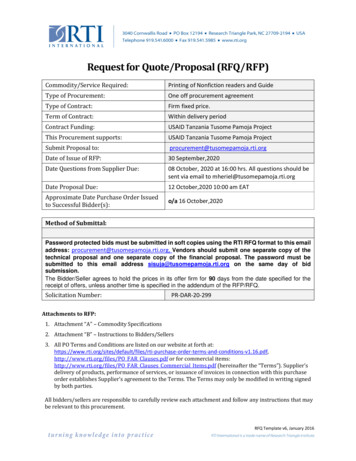
SNA for International DevelopmentTo catalyze mutually beneficial relationships and overcomethese challenges, the USAID program promoted a clusterapproach that brought academic, private, and governmentactors together to develop new curricula, collaborate inresearch and development, and provide new career pathwaysfor students. Each cluster included anchor and affiliateuniversities, industry associations and affiliated businesses, andrelevant government counterparts. These cluster members metregularly across a 5-year period and accessed grant fundingand technical support. Ultimately, collaborations led to 30new industry-aligned academic degree programs. Clustercollaborators also conducted twenty-six applied research anddevelopment programs promoting technology transfer fromuniversities to industry.and projected future collaborations. For example, thenetwork density in light manufacturing on the collaborationmeasure went from 7% (past collaboration), to 14% (currentcollaboration), to 22% (future collaboration). Reciprocity andaverage shortest path displayed similar patterns. Networkheterogeneity decreased slightly when comparing collaborationbefore and after the program. The increase in modularity,combined with an increase in density, suggests that theprogram especially helped grow within sector collaboration,though overall connections across sectors also grew over thecourse of the program.With these data, we created network maps to visualize changesin these networks over time, as seen in Figure 2. The colorsrepresent different clusters, with the light manufacturingsector used in Table 1 in blue. Visually, we observe in the lightmanufacturing graph the increasing density of connections,and the presence of several star-shaped cliques whereimportant nodes act to connect others in the network, as seenin the average shortest path score.Although the program outputs were impressive, programstakeholders wanted to know the structure and strength ofthe cluster networks and whether the collaborations might besustained. One month after program closure, we sent an onlinesurvey to 120 participants in the program’s four economicclusters. The survey presented respondents with a list of namesfrom their cluster. For each name, respondents indicatedtheir level of collaboration with that individual, if any. Ifcollaboration was of a certain level, the respondent answeredfurther questions about that individual. Receiving 80 responses(66% response rate), our research team used these data toassess (1) the importance of reported connections, (2) the levelof prior collaborations, (3) the state of current collaborations,and (4) anticipated future collaborations.Table 1. Network scores for cluster connections in the lightmanufacturing sectorPriorCurrentFutureCollaborations Collaborations CollaborationsFor each network, we produced several network measures(see Table 1 for the light manufacturing cluster, as anexample). Network closure increased as respondents recalledpast collaboration, reported on current Averageshortest path2.21.81.6Modularity0.370.430.28Figure 2. Network maps for prior, current, and future cluster collaborations in El SalvadorDid you collaborate with this person priorto the program?Have you collaborated with this personwithin the cluster (e.g., on joint research,curriculum reform)?Do you anticipate future collaborations withthis person?Lines weighted by certainty ("Definite," "I hope so").SectorAgro-industry and Food ProcessingRTI Press: Research Brief4EnergyICTLight ManufacturingRTI Press Publication No. RB-0026-2105. Research Triangle Park, NC: RTI 6.2105
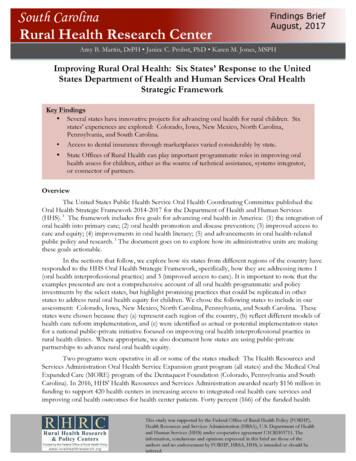
SNA for International DevelopmentThese increasing levels of network closure imply strongercommunication channels, more-efficient collaboration,and improved ability to prioritize collective action.9 Thesenetworks also show moderate levels of heterogeneity, measuredby modularity. Overall, these data indicate networks inEl Salvador that have moderate organizational capacity andappear to be improving over time. The expectation is that thesesocial networks will sustainably support the USAID programgoals of improving the flow of information from the academicto the private sector, promoting technology transfer, andcreating pathways for student internships and employment.city. Each respondent answered a set of questions about the30-person roster: how frequently they communicated witheach person, what level of collaboration they had on aging andelderly policy issues, and how much they trusted the person.Table 2 lists the network data for the question on frequency ofcommunication, and Figure 3 displays the network maps forthese cities across the three questions.Table 2. Network metrics for aging and elderly policynetworks in IndonesiaIndonesia: Knowledge System Connections forBetter Evidence-Based PolicySince 2012, RTI has directed a program in Indonesia called theKnowledge Sector Initiative (KSI), funded by the AustralianDepartment of Foreign Affairs and Trade. KSI seeks to improveIndonesian public policy by strengthening systems thatencourage the use of research and evidence in policy making.10To do this, KSI works to strengthen and connect four parts ofthe evidence-to-policy system: Knowledge enablers: regulatory authorities, public and privatefunding 50%32%20%Transitivity48%17%14%Degree Average Distance0.871.161.11These networks, particularly that of Jakarta, show moderatelevels of closure or cohesion (healthy levels of density,reciprocity, and transitivity; low distance between nodes; andhigh degree centrality). They also show high heterogeneity(i.e., low modularity), as seen visually in the between-groupor multicolor nodal connections. This level of networkclosure and network heterogeneity is associated with strongpolicy network organizational capacity and could lead toefficient and effective policy formation.9 This SNA furtherreveals differences among locations and across the networkconnection questions. Knowledge producers: universities, research centers, thinktanks Knowledge intermediaries: civil society, media Knowledge users: policy makers, parliamentarians,government ministriesKSI operates through policy working groups that combineknowledge enablers, producers, intermediaries, and usersin a particular policy area to build a body of knowledge,promote its use, and develop policy based upon it. Indonesianstakeholders and the Australian funders of KSI have an interestin understanding the strength of these networks and theirchanges over time.Social Network Analysis and InternationalDevelopment: Key RecommendationsWithin the international development field, the use of SNAto improve program design, program implementation, andprogram evaluation and learning is quite limited. USAID’sLearning Laboratory and the World Bank’s IndependentEvaluation Group have both called for the increased useof SNA,1,12 and some recent projects have embraced thesemethods.13 Note that the examples in this brief were bothconducted in relatively high-resource environments (urbanareas of Indonesia and El Salvador) and among welleducated, survey-savvy respondents. Other SNA tools, suchas Net-Mapping and Collaboration Mapping, can be used inlower resource environments, in situations where the networkis not known, or where the network is not as bounded as thosein the case examples presented here.To contribute to that understanding, RTI researchersconducted SNA in 2020 in an area KSI has prioritized: agingand elderly policy. Improving aging and elderly policy,particularly the development of “Aging-Friendly Cities”in rapidly urbanizing environments, is a World HealthOrganization initiative active in Indonesia.11 To conduct SNAin this area, we worked with an Indonesian research institute,SurveyMeter, to develop a list of 65 individuals (researchers,policy makers, journalists, and government funders ofresearch) active in aging and elderly policy networks foreach of three cities: Jakarta, Yogyakarta, and Denpasar (Baliregion). To make the name rosters more manageable forsurvey respondents, the team randomly selected 30 names perRTI Press: Research BriefJakarta5RTI Press Publication No. RB-0026-2105. Research Triangle Park, NC: RTI 6.2105
SNA for International DevelopmentFigure 3. Networks maps for aging and elderly policy networks in IndonesiaLevel of CommunicationIn the last 24 months, how often did youcommunicate with the following peopleprofessionally on aging issues?RTI Press: Research BriefLevel of CollaborationIn the last 24 months, I collaborated(worked together) with this person onaging issues.6Level of TrustI have a good level of trust in thisperson’s work on aging issues.RTI Press Publication No. RB-0026-2105. Research Triangle Park, NC: RTI Press.https://doi.org/10.3768/rtipress.
In 2018, a team from RTI International and Duke University conducted SNA in El Salvador to assess network connections among university, private sector, and government collaborators in distinct economic sector clusters (energy, light manufacturing, information and communications technology [ICT], and agroindustry and food processing).Author: Eric M. Johnson, Robert Chew