Transcription
From “Digital Mapping Techniques ‘11–12—Workshop Proceedings”U.S. Geological Survey Open-File Report 2014–1167http://pubs.usgs.gov/of/2014/1167/Tools and Techniques for 3D Geologic Mapping in ArcScene:Boreholes, Cross Sections, and Block DiagramsBy Jennifer CarrellIllinois State Geological SurveyPrairie Research Institute615 E. Peabody DriveChampaign, IL 61801Telephone: (217) 244-2764email: jcarrell@illinois.eduIntroduction The 3D navigation tools are relatively intuitive andeasy to use.In the life cycle of a geologic mapping project, a geologist is likely to use five or more different software packages,such as borehole logging programs (WellCAD, LogPlot),database programs (Microsoft Access, Oracle), GIS programs(ArcGIS), specialized modeling software (RockWorks, Surfer,gOcad, GSI3D), and Web-based tools (Google Maps/Earth,Microsoft Virtual Earth). In addition to these programs,graphics programs, such as Adobe Illustrator, Photoshop, andInDesign, are used for cartographic and production work.Although there is some overlap in functionality amongsoftware packages, there is currently no one-stop solution forgeologic mapping. For a given task in the mapping process,one program might be better suited than others. The choiceof software is often a matter of personal preference andconvenience as well as functionality.This paper, based on a poster presented at the 2011 DMTWorkshop, focuses on the functionality of Esri’s ArcScenefor 3D mapping. I discuss techniques for creating and editing3D boreholes and cross sections using custom tools as wellas out-of-the-box functionality in ArcScene 10. Examplesfrom mapping projects at the Illinois State Geological Survey(ISGS) illustrate how these are used in the mapping workflow.The customization of ArcScene with Visual Basic forApplications (VBA) has played a key role in making ArcSceneefficient and practical for geologic mapping. With ArcScene, users can take advantage of existingdata storage formats and workflows already developedfor ArcGIS without having to convert data.Advantages of ArcScene The interactive 3D environment that ArcScene provides is useful for helping us visualize and understandgeologic relations in the subsurface. Data in a stand-alone Access database can be read orimported with minimal processing. Multiple options exist for customizing and automatingtasks: Geoprocessor scripting with Python, Add-inswith ArcObjects, and Model Builder. Help and information about customization techniquesare well documented by Esri and an active user community.Limitations of ArcScene Texture mapping of vertical surfaces, for example draping an image of a cross section on a vertical wall, isproblematic. ArcScene still seems to have trouble withvertical surfaces in general. When dealing with the large volumes of data oftenrequired by geologic mapping, memory can get usedup quickly, causing slow performance and hang-ups.The workaround has been to divide data into smallergeographic areas. In ArcScene 10, new 3D geoprocessing tools mightwork for simple multipatches representing buildings,but they tend to crash when 3D geologic volumes areinput.
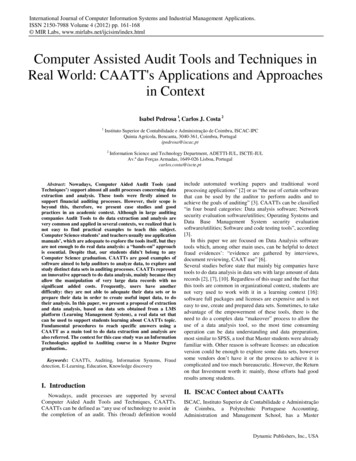
20 Digital Mapping Techniques ‘11–12 Anything beyond simple layer-cake modeling requiressome level of customization to make the multistepworkflows manageable. Custom tools developed over the past 4 years withVBA now need to be rewritten because VBA will benot be supported in future releases of ArcGIS. There is still no labeling functionality in ArcScene. The new out-of-the-box 3D geometry-editing capabilities touted by Esri are still limited and do not alwayswork, especially with the vertical surfaces of boreholesand cross sections. Digitizing in 3D space requires youto snap new features to existing data layers; however,you cannot snap to the face of a vertical areal featuresuch as a cross section wall. The geometry of complex multipatches, such as thosegenerated by extruded surfaces, cannot be edited.Xacto Section ToolsVisual Basic for Applications (VBA) was used to developa cross section tool called Xacto Section within ArcMap(figs. 1 and 2). The tool generates a 2D cross-section profileas a collection of polyline and point shapefiles. The shapefilescan be digitally edited in ArcMap and (or) exported to AdobeIllustrator for finishing. Completed cross sections also can beexported as true 3D vector features for viewing and editing inArcScene (fig. 3). One of the advantages of this program isthat the output features have a spatial reference, meaning that,when the map document is set to the desired map scale, thecross-section measurements will always be correct.In addition to creating cross sections from scratch, thetool can be used in combination with the MaPublisher plug-infor Illustrator to convert legacy cross-section vector graphicsinto 3D georeferenced shapefiles (fig. 4). In this way simple“spaghetti” graphics can be restored to valuable quantitativegeologic data.Figure 1. The Xacto Section toolbar in an example ArcMap document. The blue line represents a cross section drawnwith this tool.
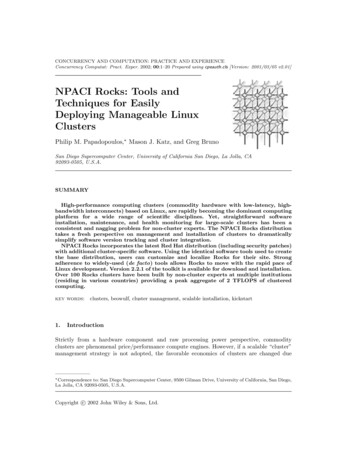
Tools and Techniques for 3D Geologic Mapping in ArcScene: Boreholes, Cross Sections, and Block Diagrams 21Figure 2. The input form for creating 2D cross sections.The ArcMap document (.mxd) containing the Xactotoolbar is available on the ArcGIS Resources Web rocessing/details?entryID C83CC388-1422-2418-7F10B4D3DF5F1EE6. The various data types that Xacto canmanipulate and output are provided below.Program InputsOutput 2D Shapefiles Surface profile line, split at contact points Geologic contact points on the land surface Well and boring points Wells extruded as lines into the subsurface, coded withgeological attributes Additional subsurface profiles Elevation raster (Esri Grid) Cross-section line Geology polygons Well and boring points Additional subsurface rasters Well log data table (.dbf)Output 3D Shapefiles 3D features can be symbolized and attributed withstandard editing tools in ArcScene 10.
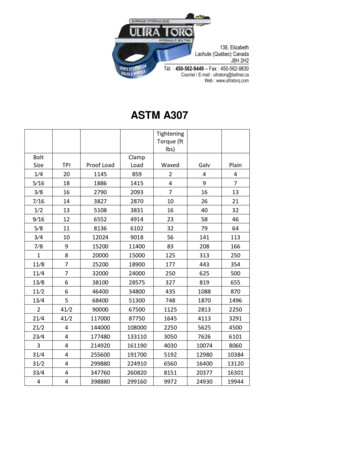
22 Digital Mapping Techniques ‘11–12Figure 3. The output 2D cross-section profile can be edited in ArcMap and converted into a 3D shapefile for displayingin ArcScene.
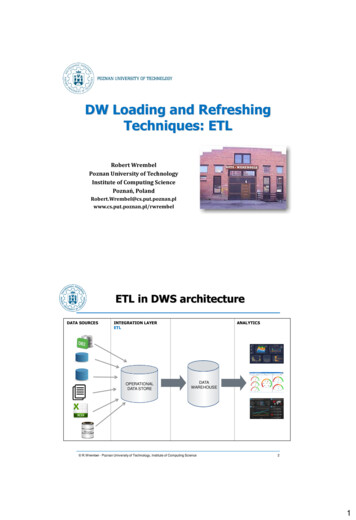
Tools and Techniques for 3D Geologic Mapping in ArcScene: Boreholes, Cross Sections, and Block Diagrams 23Figure 4. 2D cross-section graphics from older maps can be georeferenced with MaPublisher in Adobe Illustrator, thusenabling the graphics to be converted into 3D cross sections in ArcMap.3D Borehole ToolsThe ability to view, zoom, rotate, and fly throughborehole data in three dimensions is vital to understandinggeological relations in the subsurface. ArcScene providesa relatively easy and familiar interface for these tasks. Alimitation, however, has been that prior to ArcGIS 10, editingtools were not available in ArcScene. VBA was used todevelop a custom tool bar in ArcScene, called 3D BoreholeTools (fig. 5). The tool bar contains 14 tools that allow the userto create 3D borehole features from tabular log data, edit thegeometry and attributes of those features, and quickly createsurfaces from queried borehole intervals (fig. 6). Geophysicallog data as .LAS-formatted text files can also be plotted asgraphs along corresponding boreholes. The tools are availablefor download at sing/details?entryID 3CB0669C-1422-2418-7F29072DB9AA0AE3. Some of the highlights of the 3D BoreholeTools include the following:Figure 5. The 3D Borehole Toolbar in ArcScene.
24 Digital Mapping Techniques ‘11–12Figure 6. A 3D scene from ArcScene shows borehole lines symbolized as tubes, geophysical loggraphs as 3D lines, and raster surfaces interpolated from user-selected borehole segments.
Tools and Techniques for 3D Geologic Mapping in ArcScene: Boreholes, Cross Sections, and Block Diagrams 25Figure 7. The input form for creating 3D boreholes.Create 3d linesCreate surfaceThis tool (fig. 7) takes as input a .dbf or geodatabasetable of well log data with fields for X, Y, well elevation, topdepths, bottom depths, and geologic units (fig. 8). The outputis a 3D polyline shapefile. The tool automatically symbolizesthe lines as 3D cylinders. When dealing with several thousandborehole segments, rendering performance can be increased byconverting the 3D lines into multipatches, though the ability toedit the feature geometry will be lost.This tool provides a quick interface to the ArcGIS Topoto Raster interpolation tool. The tool automatically extractseither the top or bottom point of each selected boreholesegment and feeds it into the Topo to Raster tool. The outputraster is automatically symbolized with a default color ramp,and base heights are automatically applied to the layer. Thistool is useful for creating exploratory test surface patches inthe process of interpreting and reclassifying borehole data.Plot gammaThis tool reads geophysical logs (figs. 9 and 10) from adesignated folder. For each log file, the program plots a graphalongside the borehole whose ID matches the log file name.The output is a 3D line shapefile.
26 Digital Mapping Techniques ‘11–12Figure 8. An example of an input data table for creating 3D boreholes.Figure 9. An example of a LAS-formatted geophysical logfile. The file is a basic text file with a “las” extension. Headerinformation is ignored by the Borehole Tool. Each line of datarepresents a depth value and a geophysical measurementvalue.Figure 10. The input form for creating 3D geophysical loggraphs.
Tools and Techniques for 3D Geologic Mapping in ArcScene: Boreholes, Cross Sections, and Block Diagrams 27Fence and Block DiagramsIt is possible to create 3D fence and block diagrams(fig. 11) from surfaces in ArcScene, though a fair amount ofdata processing is required if there are many surfaces in thegeologic model. The workflow presented in table 1 (and infigure 12) could be automated using geoprocessing scriptingwith Python or using add-ins with ArcObjects.Figure 11. A geologic block diagram created in ArcScene.Inputs: Raster top surfaces for each geologic unit, interpolatedfrom point or contour data Depth rasters for each geological unit 2D vector lines representing lines of section
28 Digital Mapping Techniques ‘11–12Table 1. Process of creating a block diagram from surfaces in ArcScene.ProcessTool or MethodInput1Subtract the depth raster from top surfaceraster to generate a bottom surfaceraster for each unit.Spatial Analyst Math Minus2Convert each top and bottom surface3D Analyst Tools ConversionUnit top and bottomraster into a TIN (triangulated irregular From Raster Raster to TINelevation rastersnetwork) format.Unit top and bottomTINs3For fences, create narrow buffer polygons Analysis Tools Proximityfor the cross-section lines. For blocks, Buffercreate a bounding area polygon.2D cross sectionpolyline2D polygon buffer of line4Using the line buffers or bounding areapolygon, extrude the top surfaces tothe bottom surfaces. The output isa single multipatch feature for eachextruded polygon. Repeat for eachgeologic unit.3D Analyst Tools Terrainand TIN Surface ExtrudeBetweenUnit top TIN,unit bottom TIN, 2Dbuffer polygons3D multipatch features5Because the output multipatches containno attribute data, populate the multipatch attribute tables with the geologicunit name or ID.Add Field, Calculate FieldMultipatch featuresMultipatch features6Merge all multipatches into one shapefileor feature class.Data Management Tools General MergeSeparate shapefiles for One shapefile containingeach geologic unitall multipatches for allgeologic units7To separate individual cross sections,Select by Attribute, Dataquery and export multipatches by cross Exportsection ID.Raster surfaces fortop elevation andthicknessOutputRaster surface for bottomelevationAll cross sectionsSeparate shapefiles forcombined in oneeach cross sectionmultipatch shapefile
Tools and Techniques for 3D Geologic Mapping in ArcScene: Boreholes, Cross Sections, and Block Diagrams 29Several other methods of buffering and extruding crosssection lines were tested, but only the method described herewas found useful. Another method I tried was to extrude alltop surfaces to a base height of 0. This produced multipatcheswith overlapping volumes when merged into a single layer. Ithen tried various 3D Analyst tools for 3D Features availablein ArcGIS 10 (Intersect 3D, Difference 3D, Union 3D) inan attempt to remove the overlapping volumes. All of thesemethods proved to be too much for ArcScene to handle, eitherresulting in ArcScene crashing or producing errors citinglack of memory. It seems that the complicated multipatchescreated from TIN surfaces are simply too much data for thegeoprocessor. Decreasing the resolution of the input surfacesor working with smaller areas of a model may produce moresuccessful results with these 3D geoprocessing tools.AcknowledgmentsThe geologic data shown in the screen shots representthe works of Illinois State Geological Survey geologists SteveBrown, Brandon Curry, Andrew Stumpf, and Drew Phillips.Figure 12. The process of creating multiple fences (or blocks)in ArcScene: (a) raster surfaces are created for units’ topsand bottoms; (b) cross-section lines are buffered to createpolygons; (c) the polygons are used as bounding areas to extrudemultipatches between each unit’s top and bottom surfaces; and(d) the extruded multipatches for each unit are merged.
Tools and Techniques for 3D Geologic Mapping in ArcScene: Boreholes, Cross Sections, and Block Diagrams 27 Fence and Block Diagrams It is possible to create 3D fence and block diagrams (fig. 11) from surfaces in ArcScene, though a fair amount of data processing is required if there