Transcription
Improvement Coach Professional Development ProgramWave 3, Workshop 2Control Charts:an overviewWilliam PetersMarch 13th, 2017Day 1
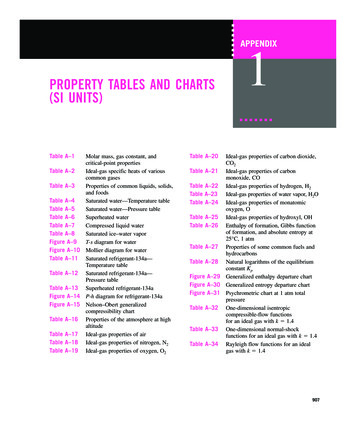
Question 2 of the Model for ImprovementModel for ImprovementWhat are we trying toaccomplish?How will we know that achange is an improvement?What change can we make thatwill result in improvement?ActPlanSource: Associates for Process ImprovementStudyQuality Improvement Fundamentals LLCDoThe most basicunderstanding of the2nd question is this:MEASUREMENT
How Do We Know That a Changeis an Improvement? Improvement is about testing and implementing changewithin a system, not measurement!The purpose of measuring isto answer critical questionsand to guide intelligent action.Quality Improvement Fundamentals LLC
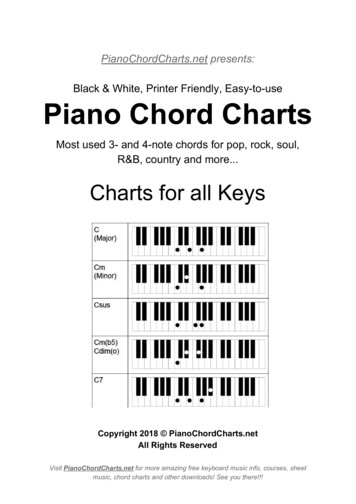
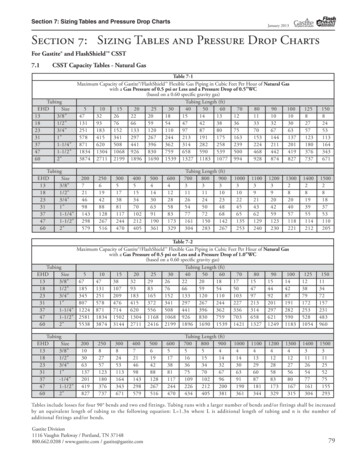
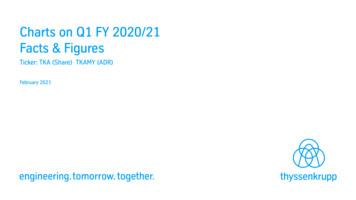
Understanding variation in dataI DON’T know these!I know these!Shewhart ChartRun ChartFrequency Plot# of waits 30 days5030201005152535455565758595 105Wait time (days) for VisitIH p. 8-34Clinic Wait Times 30 daysRelationship Between LongWaits and Capacity20# wait times 30 days161440ScatterplotPareto ChartDistribution of Wait Times60number of visitsThere are severaltools we use inimprovement tomake sense of thevariation that isinherent in EVERYmeasure.121086420151050CFGDAJHClinic IDKBILE7595Capacity UsedHow else would we do it? Make it up?!Quality Improvement Fundamentals LLC
We need data over time to showimprovement14on a measure that mattersto the organizationImprovement is theresult of a change in theprocess2 result ispositive,relevant,meaningful Cycletimebeforeafter3 and gains are held REAL SUSTAINABLE IMPROVEMENT
The biggest difference between Runand Control Charts:If you are using theRun Chart, you use:If you are using theControl Chart, you use:a Run Chart with special softwareQuality Improvement Fundamentals LLC
Differences between Run and Control Charts:You need:Pencil and Paper or ExcelTraining:[you tell me, how hard is it?]Special Software ( 1,200 5,000)Definitely more difficultWho creates:Anyone, front-line safe ideallySpecially trained software dudeInterpretation:[you tell me, how hard is it?]More difficultCenter Line:MedianMeanSensitivity:Easily enough to get the jobdoneMore sensitive, moresophisticated, more detailTests:How many:Ideal use:Data needed:Cool Factor:Quality Improvement Fundamentals LLC4, pretty easy to learn Shift Trend Too many, too few runs AstronomicalDozens of sets, harder to learnEach one of these is aSET of rulescontaining 4 to 8different rules
Differences between Run and Control Charts:You need:Pencil and Paper or ExcelTraining:[you tell me, how hard is it?]Special Software ( 1,200 5,000)Definitely more difficultWho creates:Anyone, front-line safe ideallySpecially trained software dudeInterpretation:[you tell me, how hard is it?]More difficultCenter Line:MedianMeanSensitivity:Easily enough to get the jobdoneMore sensitive, moresophisticated, more detailTests:4, pretty easy to learnDozens of sets, harder to learnHow many:THE run chart7, depending on the measureIdeal use:All improvement activitiesSystem dashboardsData needed:At least 10 points, betterAt least 15 points, betterDo by hand:10-20 minutes?See you in your next life!Cool Factor:“Impressive!”“Improvement Ninja”Quality Improvement Fundamentals LLC
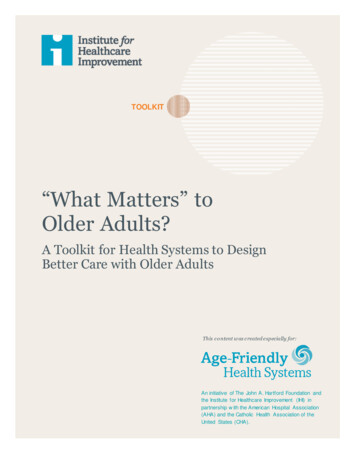
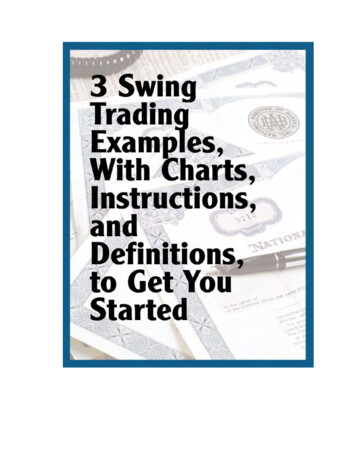
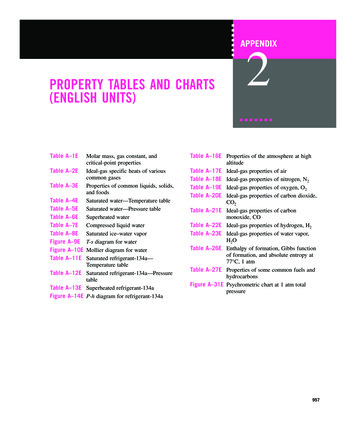
Oh look! A Run Chart!Number of Interruptions During Med Passes by Day16Begin SterileCockpit test1412111086Baseline median 11, extended over test4220 data points, 1 on median, 19 useful observations10 Runs, at 19 points table shows btw 6 - 150Quality Improvement Fundamentals LLCalmost a shift
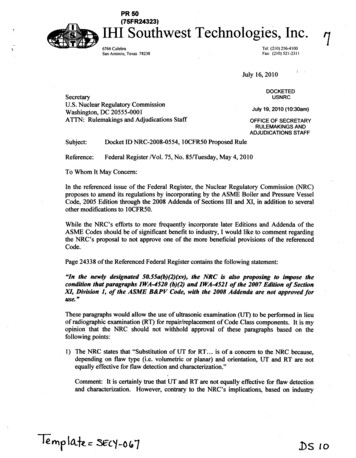
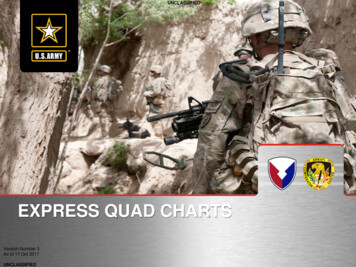
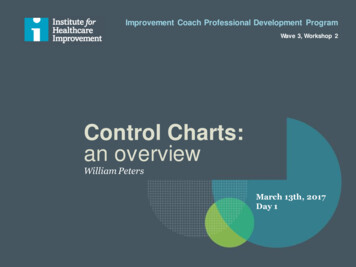
Oh look! A CONTROL CHART!Sigmazones“API” Rules that I use in healthcare(RARE!) Trend of 6 descending/ascending Shift of 8 above/below mean 2 of 3 beyond the second sigma Above/below upper/lower control limit 15 within the 1st sigma321123Quality Improvement Fundamentals LLC
Oh look! A CONTROL CHART!“API” Rules that I use in healthcare Trend of 6 descending/ascending Shift of 8 above/below mean 2 of 3 beyond the second sigma Above/below upper/lower control limit 15 within the 1st sigmaQuality Improvement Fundamentals LLC
Measurement or CharacteristicRemember the “Astro” in the Run Chart?Rule 425201510501234567891011121314151617181920 21 22 23 24Blatantly obvious that value is unusual. SMEs mostly agreeQuality Improvement Fundamentals LLC
A control chart with UCL crossedThere is no argument here these data are different!Quality Improvement Fundamentals LLC
It can get hairy 1 res. had 3 EDtrips resulting in2 admits (HB), 1res. admittedafter fall, 1 res.admitted d/tunresponsiveepisode1 res. related torepertory distressand expired, 1fall, 2 related tofamily insistence,2 admitted withillnessNICE!Remember, I have to teach interpretation to CEO AND the BoD!!!Quality Improvement Fundamentals LLC
The most complicated to grasp:Individuals – Moving RangeNew addition openedwith 13 nursing bedsFoundation Campaignfor the new bus startedThe range chart: only interpret UCL/LCL violations!If range chart is in control we hide itOp-Def: Total income from all sources of revenue all levels ofSME interpretation: Stable since building addition.
In a control chart we can “ghost data points” IF reasonable and rational people can agree to ourreasoning!Quality Improvement Fundamentals LLC
Notice the “staggered limits” in this P ChartThe larger the denominator, the tighter the limitsQuality Improvement Fundamentals LLC
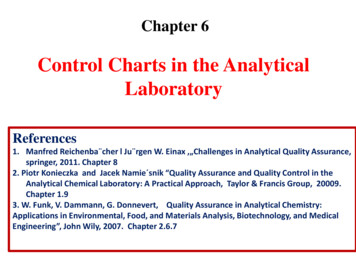
The Control Chart Decision TreeDecide on typeof dataVariables DataYesYes 1observationpersubgroup? 10observationspersubgroup?X bar RX bar SNoNoNoYesXmRAttributes DataIs there anequal area ofopportunity?c-chartQuality Improvement Fundamentals LLCOccurrences& Nonoccurrences?u-chartNoNoYesAre thesubgroups ofequal size?p-chartYesnp-chart
But never forget 50.0Percent All-Cause, 30 Day Readmissions45.040.035.020 data points8 runspoint6/16I&P6 shift30.0or25.020.015.915.010.05.00.0Quality Improvement Fundamentals LLCI&E&LEARN& TAKEACTION!
Differences between Run and Control Charts: You need: Pencil and Paper or Excel Special Software ( 1,200 - 5,000) Training: [you tell me, how hard is it?] Definitely more difficult Who creates: Anyone, front-line safe ideally Specially trained software dude Interpretation: [you tell me, how hard is it?] More difficult Center Li