Transcription
www.mercercapital.comVALUE FOCUSTransportation & LogisticsSecondQuarter 2018First Quarter 2018 Article: Electronic Logging DevicesIn This IssueElectronic Logging Devices1Industry Macro Trends 4Trucking 6Rail & Intermodal 9M&A Activity 11Select Transactions 12Public Company Performance 14
Mercer Capital’s Value Focus: Transportation & LogisticsFirst Quarter 2018FEATUREGone are the days of paper logbooks, because the future is here for truckers in the form of Electronic Logging Devices, orElectronicLoggingDevicesELDs. But what are they, what do they do, and what will they be replacing?Most operators of Commercial Motor Vehicles (CMVs) must keep a Record of Duty Service (RODS) to ensure that theyare complying with federally mandated Hours of Service (HOS) guidelines. All this alphabet soup to say, the federal government regulates how many hours drivers can be on duty in a daily or weekly cycle. Drivers are required to keep recordsabout their duty hours which can be audited by the Department of Transportation or checked by police officers at roadsideinspections. In the past, drivers have kept pencil and paper logs, but these are prone to error and intentional tampering.That is where the ELD comes in. Compliant ELDTimeline of the ELD Mandatedevices connect with the engine by directly interfacing with the CMV electronic control module. Itcaptures engine power status, vehicle motion status, miles driven, and engine hours. These datapoints will combine with the other information thatan ELD records, such as an automated entry whenthe driver’s duty status changes, every 60 minuteswhile the vehicle is in motion, and when the engineturns on or off. ELDs are significantly harder totamper with, so drivers will automatically provideRODS information in an accurate way throughtheir devices. ELDs will also ensure that any editsto RODS data are confirmed by the driver, wherein the past that was not required. These changes are all significant, and will likely impact how many miles a driver can logwhile remaining compliant with HOS guidelines, but it is important to note that said guidelines remain unchanged, they willbe the same as they were prior to the ELD mandate.It wasn’t all paper and pencils before the ELD mandate, however. Some larger companies have already startedimplementing Automatic Onboard Recording Devices (AOBRDs) to track their drivers. Although AOBRDs record certaininformation about the truck, the level of detail captured is not sufficient to meet the requirements of the new mandate.However, carriers who implemented AOBRDs before the compliance date may be allowed to use them until ELDs becomemandatory for all RODS-providing companies at the end of 2019. 2018 Mercer Capital // www.mercercapital.com1
Mercer Capital’s Value Focus: Transportation & )First Quarter 2018Waiting until the last minute to transition may not be beneficial, as companies will likely face a learning curve when itcomes to integrating the devices and redeveloping processes. As FreightWaves’ Brian Straight explains, “How long thatlearning curve is will depend on the individual and waiting to the last minute could be detrimental to the productivity of youroperation.”ELD ViolationsSafety Measurement SystemsSectionDescriptionCategory395.8A-ELDELD - No record of duty status (ELD Required)Incomplete/Wrong LogSeverity5395.8A1Not using the appropriate method to record hours of serviceIncomplete/Wrong Log5395.11GFailing to provide supporting documents in the driver's possession upon requestFalse Log7395.20BThe ELD’s display screen cannot be viewed outside of the commercial motor vehicle.Incomplete/Wrong Log5395.22AOperating with a device that is not registered with FMCSAIncomplete/Wrong Log5395.22GPortable ELD not mounted in a fixed position and visible to driverEOBR-Related1395.22H4Driver failed to maintain supply of blank driver's records of duty status graph-gridsEOBR-Related1395.24C2IIIDriver failed to manually add shipping document numberOther Log/Form & Manner1395.30B1Driver failed to certify the accuracy of the information gathered by the ELDOther Log/Form & Manner1395.32BDriver failed to assume or decline unassigned driving timeIncomplete/Wrong Log5395.34A1Failing to note malfunction that requires use of paper logIncomplete/Wrong Log5Smaller carriers worry that the ELD mandate will disproportionally affect their operations. Many large carriers have alreadyadopted ELDs as a way to monitor their drivers and optimize their business. Additionally, large carriers may find themselves better able to absorb the cost of the mandate. Although the implementation of ELDs offers savings in the long termthrough the reduction in paperwork costs, they can be financially onerous at the outset. Finally, since larger carriers havealready begun implementation, they may be ahead of the competition when it comes to training their drivers at the outsetof the mandate, and have already had the opportunity to work through technical hiccups that small carriers may run intowhen implementing these new systems.Although the industry expects ELDs to be beneficial as a whole, the implementation will require a significant shift in theway many trucking companies operate. ELD technology will enable carriers to gather valuable data on their fleet, savemoney on back office expenses, and provide safety upsides. However, the burden may fall more heavily on smaller carriers, many of whom worry about the initial financial and resource investments required. Whatever your thoughts are, the 2018 Mercer Capital // www.mercercapital.comELD mandate is here, and it looks like it’s here to stay.2
Mercer Capital’s Value Focus: Transportation & LogisticsIndustryMacro TrendsFirst Quarter 2018Industry Production Index (seasonally adjusted)Industry Production IndexDemand for services in the logisticsindustry is tied to the level of domesticindustrial production. The micoutputfrommanufacturing, mining, electric, and gasutilities. The index value in March 2018reached 107.3, up 3.78% from March2017 but approximately flat comparedto the prior quarter. Consumer durablesrose 0.9%, in large part through a gainof 2.7% in automotive products. 2018 Mercer Capital // www.mercercapital.com3
Mercer Capital’s Value Focus: Transportation & LogisticsIndustry MacroTrendsFirst Quarter 2018Transportation Services Index (freight, seasonally adjusted)Transportation ures freight traffic in the United States,rose slightly in February 2018. The index roseto 134.5, up 1.6% from 132.4 in December2017, and 8.2% higher than 124.3 in March2017. The use of freight transportation hasgenerally paced with industrial output overthe last 20 years.Cass Freight IndexCass Freight IndexThe Cass Freight Index of shipments andexpenditures is considered one of the bestindicators of overall U.S. freight activity. Asof March 2018, shipments have increased forthe previous 16 year-over-year periods. Thelast time shipments decreased was over theperiod from November 2015 to November2016. Shipments experienced a year-overyear increase of 11.9% for the period ofMarch 2017 to March 2018. 2018 Mercer Capital // www.mercercapital.com4
Mercer Capital’s Value Focus: Transportation & LogisticsIndustry MacroTrendsFirst Quarter 2018ShipmentsShipmentsShipments in the first three months of2018 exceeded the level recorded at thispoint last year. The index increased ona year-over-year basis for the past 16months, with the strongest year-over-yearincreases occurring in the first quarterof 2018. The Cass Report notes that thedouble digit increases are in comparison tosimilarly strong numbers in prior quarters.Increases and declines in the level offreight shipments are frequent precursorsto economic activity, signaling economicExpendituresexpansion and contraction, respectively.ExpendituresExpenditures remained steady at 2.723 inMarch 2018 compared to February 2018,however, the rate of growth in expenditureshas risen from 2017. The year-over-yearincrease in March 2018 was 15.6%,compared to a 3.0% year-over-year increasein March 2017. 2018 Mercer Capital // www.mercercapital.com5
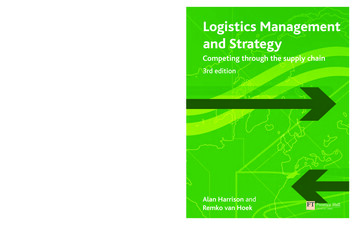
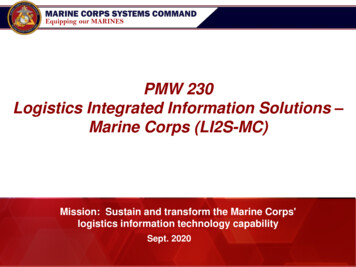
Mercer Capital’s Value Focus: Transportation & LogisticsTruckingFirst Quarter 2018Truck TonnageThe Truck Tonnage Index reached a high level in March 2018 at 112.5, compared to a low of 74.8 in April 2009 during theGreat Recession. Despite a decline in January 2018 to 108.9, tonnage increased in February 2018 to 111.0. The AmericanTrucking Association’s (ATA) chief economist, Bob Costello, attributes this in part to a favorable point in the inventory cyclefor motor carriers and the strong economy.Truck Tonnage (seasonally adjusted) 2018 Mercer Capital // www.mercercapital.com6
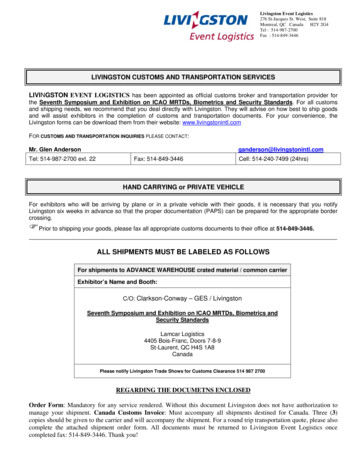
Mercer Capital’s Value Focus: Transportation & LogisticsTruckingFirst Quarter 2018Spot vs. Contract RatesSpot vs. Contract RatesThe Spot vs. Contract Rates chartdepicts monthly national average linehaul rates and fuel surcharges fromDAT. Shippers enter contracts that lockin a static contract rate for a period oftime. Spot rates, on the other hand, areone-time shipping quotes for a specifictransaction or series of transactions. Asof March 2018, spot and contract ratesbegan converging for dry vans, reefers,and flatbeds.ReeferspotratesdeclinedfromDecember 2017 while both flatbedand dry van spot rates increased.Reefer spot rates fell 8 to 2.40 inMarch 2018 from 2.48 in December2017. Conversely, dry van spot ratesincreased 2 to 2.14 in March 2018from 2.12 in December 2017. Flatbedspot rates posted the largest increase,rising 21 to 2.53 in March 2018 from 2.33 in December 2017. 2018 Mercer Capital // www.mercercapital.com7
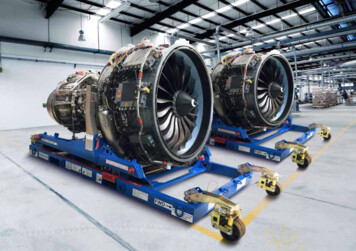
Mercer Capital’s Value Focus: Transportation & LogisticsTruckingFirst Quarter 2018Dry Van Load-to-TruckLoad-to-Truck RatioIncreases or decreases in freight ratesare influenced by trucking capacity, asmeasured by the load-to-truck ratio. Whileeconomic factors typical push supplyand demand, compression or expansionthat occurs faster in the shipping industrycan accelerate movements faster thanReefer Load-to-Truckthe overall economy. DAT measures theavailability of truck per load posted inits database for a real-time indicator oftrucking supply and demand.Movement in the load-to-truck ratiovaried significantly in first quarter 2018.Dry van and reefer ratios fell 23%and 26% over fourth quarter 2017,respectively. The load-to-truck ratio forflatbed rose significantly, experiencing aFlatbed Load-to-Truck155% increase from year-end 2017.Source: DAT 2018 Mercer Capital // www.mercercapital.com8
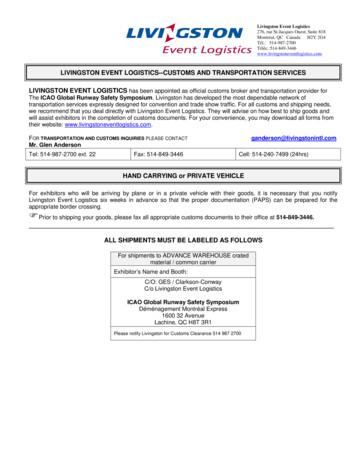
Mercer Capital’s Value Focus: Transportation & LogisticsRail &IntermodalFirst Quarter 2018Rail Freight Intermodal TrafficIntermodal shipments rose in first quarter of 2018, with intermodal freight volumes up 2.4% through February from 1.18million carloads in December 2017 to 1.21 million in February 2018. According to FTR’s senior transportation analystTodd Tranausky, increases in retail sales, automobile sales, and new home sales portend volume and revenue growth inintermodal freight for 2018, despite some capacity issues.Rail Freight Intermodal Traffic 2018 Mercer Capital // www.mercercapital.com9
Mercer Capital’s Value Focus: Transportation & LogisticsRail &IntermodalFirst Quarter 2018Cass Intermodal Index: Historical TrendCass Intermodal IndexThe Cass Intermodal Index measureschanges in per mile U.S. domesticintermodal costs. The index rose toa new high of 143.2 in March 2018,5.8% over the prior year. The CassReport notes that higher diesel pricesin the trucking industry are creatingdemand and pricing power for domesticintermodal.Cass Intermodal Index: Annual Comparison 2018 Mercer Capital // www.mercercapital.com10
Mercer Capital’s Value Focus: Transportation & LogisticsM&A ActivityFeatured TransactionsFirst Quarter 2018Private equity acquisition of PS LogisticsUniversal Logistics Holdings acquired Fore TransportationOEP Capital Advisors, a subsidiary of JP Morgan AssetUniversal Logistics Holdings acquired Fore Transpor-Management, acquired PS Logistics for 400 million ontation for 34.9 million in cash on February 2. Fore,March 14. PS Logistics provides flatbed transportationwhich is based in Illinois, provides local, regional, andand logistics services to oil, natural gas, and steellong-haul transportation services. It primarily providesindustries. It is based in Birmingham, Alabama.overweight, refrigerated, and dry transport services.It now operates as a subsidiary of Universal LogisticsHoldings.Kirby Corporation acquired Higman Marine Servicesand its affiliated companiesKnight-Swift acquired Abilene Motor ExpressKirby Corporation acquired Higman Marine Services oximately 419 million on February 4. According toAbilene Motor Express for an undisclosed amount onKirby CEO David Grzebinksi, "the timing of the HigmanMarch 16. Phoenix-based Knight will expand its profileacquisition is ideal as it will further upgrade our fleeton the US East Coast, with Abilene's presence inand ultimately allow Kirby to emerge from the downturnRichmond, Virginia. The acquisition will bolster Knight'slarger, more efficient, and better able to serve ourfleet by approximately 450 trucks.customers." 2018 Mercer Capital // www.mercercapital.com11
Mercer Capital’s Value Focus: Transportation & LogisticsFirst Quarter 2018Select TransactionsTargetBuyerDateAnnouncedDealStatusDeal Value toImpliedEnterpriseValueTotalDeal ValueSalesEBITDATruckingFore Transportation, Inc.Universal Logistics Holdings, Inc. (NasdaqGS:ULH)Central Arizona Freight, Inc.2/2/18Closed 34.91.1x--Brown Transfer Company2/23/18Closed----Abilene Motor Express, Inc.Knight Transportation Inc.3/16/18Closed----Tibbs Transport Inc.Contrans Group Inc.3/20/18Closed----Artex Inc.Crozier Fine Arts Inc.3/22/18Closed----Marshall Trucking Inc.Mullen Trucking Corp.2/7/18Closed 8.1---P & S Transportation, LLCOEP Capital Advisors, L.P.3/17/18Closed----PS Logistics, LLCOEP Capital Advisors, L.P.3/14/18Closed 400.0---Source: S&P Global Market Intelligencein USD millions 2018 Mercer Capital // www.mercercapital.com12
Mercer Capital’s Value Focus: Transportation & LogisticsFirst Quarter 2018Select TransactionsTargetBuyerDateAnnouncedDealStatusDeal Value toImpliedEnterpriseValueTotalDeal ValueSalesEBITDAMarineHigman Marine Services, Inc.Kirby Corporation (NYSE:KEX)2/4/18Closed 419.0---All Assets of Rand Logistics, Inc.American Industrial Partners3/1/18Closed----Oceanstar, Inc.Seldat Distribution Inc.3/5/18Closed---Volunteer Barge & Transport, Inc.Heartland Barge Management, LLC2/3/18Closed---Drayage and depot operations of H & MInternational Transportation, Inc.IMC Companies LLC1/2/18Closed----The Irwin Brown CompanyC.H. Powell Company1/8/18Closed----AJR Transportation LLCGlobalTranz Enterprises, Inc.1/10/18Closed----Sequel International Logistics (USA) Inc.Loomis AB (publ) (OM:LOOM B)1/19/18Closed 2.00.8x--Ready Machinery & Equipment (Canada) IncBaleForce Recycling Equipment Inc.2/2/18Closed----Innovative Logistics, LLCPatriot Defense Group, LLC2/22/18Closed---11.6xAIRTRADES Freight Forwarders Inc.Delmar International Inc.2/21/18Closed----LBC Mabuhay Saipan, Inc.LBC Express Holdings, Inc. (PSE:LBC)3/8/18Closed 0.2---Globegistics Inc.Asendia Management SAS2/7/18Closed----Freight Force, Inc.St. George Trucking & Warehouse Inc.3/13/18Closed----Aeropost International Services, Inc.PriceSmart, Inc. (NasdaqGS:PSMT)3/19/18Closed---IMEX Global Solutions, LLCLandmark Global Inc.1/12/18Closed---Air Freight & LogisticsSource: S&P Global Market Intelligencein USD millions 2018 Mercer Capital // www.mercercapital.com13
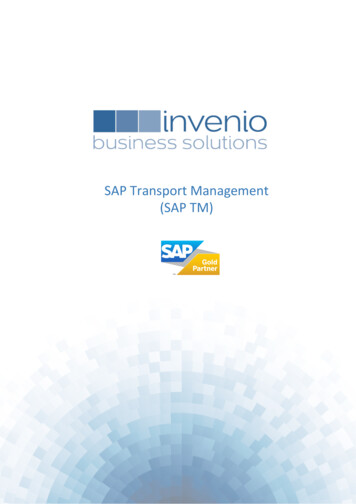
Mercer Capital’s Value Focus: Transportation & LogisticsPublicCompanyPerformance 2018 Mercer Capital // www.mercercapital.comFirst Quarter 2018Monthly Median TEV/EBITDA Multiples14
Mercer Capital’s Value Focus: Transportation & LogisticsFirst Quarter 2018Publicly Traded CompaniesLTMCompany NameTickerPrice at3/31/18QoQPriceChangeJBHT 117.152%Debt /TotalCapitalEnterpriseValueReturn onAssets 13,9308%872%Rev.LTM MultiplesEBITDAMarginEV /Rev.Forward MultiplesEV /EBITDAPrice /Earn.EV /EBITDAPrice /Earn.13.4x18.3x11.1x21.7xTruckloadJ.B. Hunt Transport Services, Inc.Ryder System, Inc. 7,50914%1.9xR 72.795% 9,19858%338% 7,46425%1.2x5.0x4.9x4.7x12.6xKNX 46.01-9% 9,09510%440% 3,42517%2.7x15.7x15.2x9.2x18.0xSchneider National, Inc.SNDR 26.065% 4,7703%631% 4,51613%1.1x8.3x11.1x7.1x17.1xLandstar System, Inc.LSTR 109.65-14% 4,484-3%1575% 3,9168%1.1x14.6x22.8x12.0x18.0xTFI International Inc.TFII 25.66-6% 3,45434%668% 3,74511%0.9x8.5x15.4x7.0x10.3xWerner Enterprises, Inc.WERN 36.50-2% 2,7062%711% 2,17817%1.2x7.5x12.3x6.0x15.7xHeartland Express, Inc.HTLD 17.99-23% 1,423-5%542% 63422%2.2x10.1x20.1x7.6x21.5xMarten Transport, Ltd.MRTN 22.8012% 1,228-1%563% 71219%1.7x9.0x13.5x7.8x23.1xDaseke, Inc.DSKE 9.79-11% 1,15046%127% 1,01310%1.1x11.1x16.4x6.6xnmKnight-Swift Transportation Holdings Inc.Universal Logistics Holdings, Inc.ULH 21.15-31% 83128%819% 1,2678%0.7x8.4x17.5x5.8x10.9xCovenant Transportation Group, Inc.CVTI 29.834% 74527%501% 72015%1.0x7.0x9.1x5.5x13.4xP.A.M. Transportation Services, Inc.PTSI 36.356% 37640%664% 44813%0.8x6.6x5.9xnmnmUSA Truck, Inc.USAK 25.4941% 31334%430% 4707%0.7x9.1x15.3x6.3x17.7xPATI 16.97-13% 51-24%83% Patriot Transportation Holding, Inc.Median-2%10%Source: S&P Global Market IntelligenceUSD millions except per share values Financial statement data as of Q1 2018 Mercer Capital // www.mercercapital.com15
Mercer Capital’s Value Focus: Transportation & LogisticsFirst Quarter 2018Publicly Traded CompaniesLTMTickerPrice at3/31/18QoQPriceChangeEnterpriseValueOld Dominion Freight Line, Inc.ODFL 146.9712% 12,0740%1544% 3,52923%Saia, Inc.SAIA 75.156% 2,0396%786% 1,47413%Company NameDebt /TotalCapitalLTM MultiplesReturn onAssetsRev.EBITDAMarginEV /Rev.Forward MultiplesEV /EBITDAPrice /Earn.EV /EBITDAPrice .3xLess-Than-TruckloadYRC Worldwide Inc.YRCW 8.83-39% 1,11473%349% 4,9355%0.2x4.5xnm3.6x17.2xArcBest CorporationARCB 32.05-10% 91410%520% 2,8756%0.3x5.2x10.7x3.8x8.5xRoadrunner Transportation Systems, Inc.RRTS 63.50-67% 52982%-268% 7.4x6.6x6.5x8.4xMedian-10%10%Air FreightAAWW 60.453%Air Transport Services Group, Inc.ATSG 23.32Forward Air CorporationFWRD 52.86CJT 52.86Atlas Air Worldwide Holdings, Inc.Cargojet Inc.Median 3,47056%1% 1,911-8% 1,60113% 1,0142%344% 2,27121%1.5x28%415% 1,03326%1.8x7.1xnm6.4x18.1x2%967% 1,21012%1.3x10.7x17.3x9.9x17.5x30%461% 17.8x29%Source: S&P Global Market IntelligenceUSD millions except per share values Financial statement data as of Q1 2018 Mercer Capital // www.mercercapital.com16
Mercer Capital’s Value Focus: Transportation & LogisticsFirst Quarter 2018Publicly Traded CompaniesLTMTickerPrice at3/31/19TRTN 30.60-18% 9,38274%473% 1,26096%KEX 76.9515% 5,56818%277% 2,464Textainer Group Holdings LimitedTGH 16.95-21% 3,87875%296%Seaspan CorporationSSW 6.68-1% 3,74574%386%Matson, Inc.MATX 28.64-4% 2,05941%306% 2,084Costamare Inc.CMRE 6.248% 1,72761%295% 400Navios Maritime Partners L.P.NMM 27.00-24% 77160%280% 222Eagle Bulk Shipping Inc.EGLE 4.9510% 61942%243%Global Ship Lease, Inc.GSL 8.80-5% 38684%488%Pangaea Logistics Solutions, Ltd.PANL 2.65-28% 31863%Sino-Global Shipping America, Ltd.SINO 1.12-56% 2nmCompany NameEnterpriseValueDebt /TotalCapitalLTM MultiplesQoQPriceChangeReturn onAssetsEV /EBITDAPrice /Earn.EV m 63068%6.2x9.0x21.5x8.5x16.3x 61%4.3x7.0x9.9x7.7x15.9x54%3.5x6.4xnm5.8x7.7x 27014%2.3x15.9xnm7.8xnm 15664%2.5x3.9xnm3.7x5.0x486% 38012%0.8x7.0x10.8x5.9x4.
395.22G Portable ELD not mounted in a fixed position and visible to driver EOBR-Related 1 395.22H4 Driver failed to maintain supply of blank driver's records of duty status graph-grids EOBR-Related 1 395.24C2III Driver failed to manually a